“We have to be careful of these kind of exponentially rising markets,” chides Marc Faber, adding that he “sees no value in stocks.” Fearful of shorting, however, because “the bubble in all asset prices” can keep going due to the printing of money by world central banks, Faber explains to a blind Steve Liesman the difference between over-valuation and bubbles (as we noted here), warning that “future return expectations from stocks are now very low.”
Nope no bubble here…
Along with this pattern…
which has emerged with striking fidelity since 2010, we observe a variety of other features typically associated with dangerous extremes:
- unusually rich valuations on a wide variety of metrics that actually have a reliable correlation with subsequent market returns; margin debt at the highest level in history and representing 2.2% of GDP (eclipsed only briefly at the 2000 and 2007 market extremes);
- a blistering pace of initial public offerings – back to volumes last seen at the 2000 peak – featuring “shooters” that double on the first day of issue;
- confidence in the narrative that “this time is different” (in this case, the presumption of a fail-safe speculative backstop or “put option” from the Federal Reserve); lopsided bullish sentiment as the number of bearish advisors has plunged to just 15% and bulls rush to one side of the boat;
- record issuance of covenant-lite debt in the leveraged loan market (which is now spreading to Europe);
- and a well-defined syndrome of “overvalued, overbought, overbullish, rising-yield” conditions that has appeared exclusively at speculative market peaks – including (exhaustively) 1929, 1972, 1987, 2000, 2007, 2011 (before a market loss of nearly 20% that was truncated by investor faith in a new round of monetary easing), and at three points in 2013: February, May, and today (see A Textbook Pre-Crash Bubble).
Many of us in the financial world know these to be classic features of speculative peaks, but there is career risk in responding to them, so even those who view the situation with revulsion can’t seem to tear themselves away.
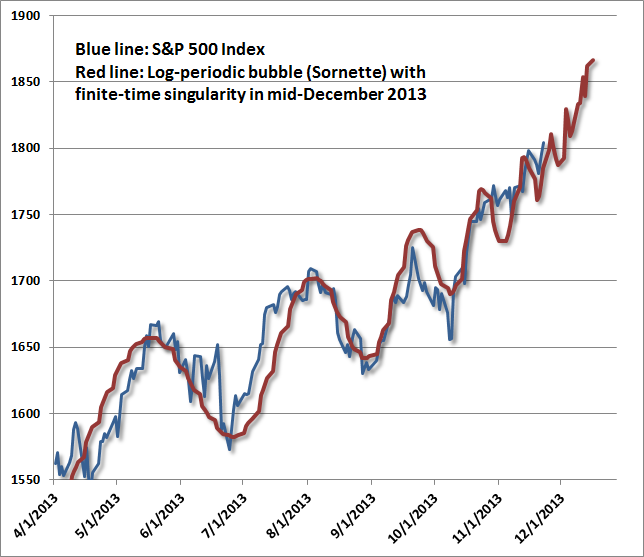
While I have no belief that markets follow any mathematical trajectory, the log-periodic pattern is interesting because it coincides with a kind of “signature” of increasing speculative urgency, seen in other market bubbles across history. The chart above spans the period from 2010 to the present. What’s equally unsettling is that this speculative behavior is beginning to appear “fractal” – that is, self-similar at diminishing time-scales. The chart below spans from April 2013 to the present. On this shorter time-scale, Sornette’s “finite time singularity” pulls a bit closer – to December 2013 rather than January 2014, but the fidelity to this pattern is almost creepy. The point of this exercise is emphatically not to lay out an explicit time path for prices, but rather to demonstrate the pattern of increasingly urgent speculation – the willingness to aggressively buy every dip in prices – that the Federal Reserve has provoked.
![]()
     |
via Zero Hedge http://feedproxy.google.com/~r/zerohedge/feed/~3/OSP_hGzqYsU/story01.htm Tyler Durden