One month ago, in its traditionally cheerful assessment of the US housing market, the NAR’s Larry Yun snuck in an unexpected warning:
“Home prices ascending near or above double-digit appreciation aren’t healthy – especially considering the fact that household income and wages are barely rising.”
He did it again just a few days ago:
“The overall demand for buying is still solid entering the busy spring season, but home prices and rents outpacing wages and anxiety about the health of the economy are holding back a segment of would-be buyers.“
This is about as close to a warning that the US housing market is back into bubble territory as one can hope to get from the NAR.
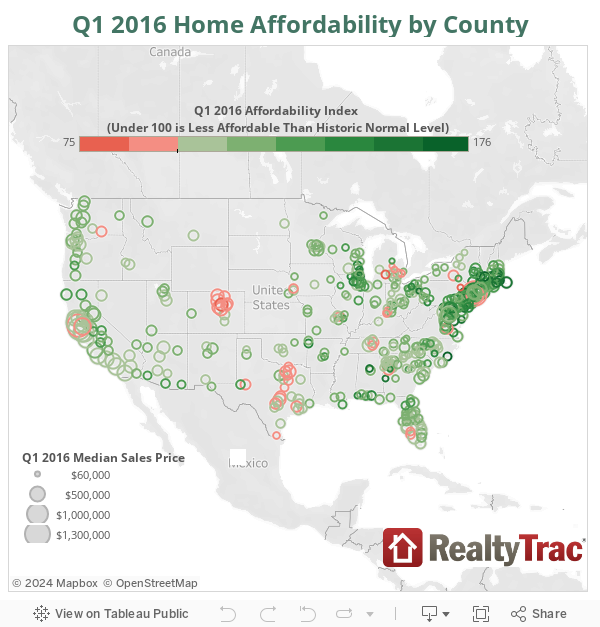
Overnight, we got another confirmation of American runaway – if only for the vast majority of people – home prices, when RealtyTrac released its Q1 2016 Home Affordability Index, which showed that in Q1 2016, 9% of U.S. county housing markets were less affordable than their historically normal levels, up from 2 percent of markets that exceeded historic home affordability levels a year ago.
That may not sound like much but it means that marginal “bubble” conditions of the type the NAR was warning about, have returned. It means that home buyers need to spend more of their incomes on housing, leaving less money for other purchases.
But where this home inflation is most evident is in the clear disconnect between home prices which are rising faster than wages in most of the United States, making homeownership increasingly difficult for average Americans.
The report found that home price growth exceeded wage growth in nearly two thirds of the nation’s housing markets so far this year, with urban centers like San Francisco and New York City among the least affordable.
This is what the RealtyTrac report found:
Annual change in median home prices in Q1 2016 outpaced annual change in average weekly wages in Q3 2015 (the most recent county-level wage data available from BLS) in 276 of the 456 counties analyzed for the report (61 percent).
The top five most-populated county housing markets where price growth outpaced wage growth were Los Angeles County, California (5 percent median home price growth and 3 percent average wage growth); Maricopa County, Arizona in the Phoenix metro area (8 percent median home price growth and 2 percent average wage growth); San Diego County, California (5 percent median home price growth and 4 percent average wage growth); and Orange County, California (5 percent median home price growth and 2 percent average wage growth).
Other markets where median home price growth outpaced average wage growth included counties in Miami, Brooklyn, Dallas, Seattle and Las Vegas.
“I’m sure it comes as no surprise to anyone in Seattle that it’s getting harder and harder to afford a home,” said Matthew Gardner, chief economist at Windermere Real Estate, covering the Seattle market. “Thanks in part to strong income growth and intense competition, home prices continue to escalate at rates that are negatively impacting affordability. Something else pushing up prices is the Washington State Growth Management Act, which continues to limit developable land and is holding back many builders from adding much-needed inventory to the market.”
More troubling is that at the national level, prevailing home prices have now risen faster than average wages for four consecutive years.
It is this troubling trend – which is leading to declining demand as well as even bubblier, debt-fueled conditions for the rest – that the NAR is worried about.
So is RealtyTrac: “While the vast majority of housing markets are still affordable by their own historic standards, home prices are floating out of reach for average wage earners in a growing number of U.S. housing markets,” said Daren Blomquist, senior vice president at RealtyTrac, which monitors housing market trends.
Well, that’s what mortgage debt is for; the same debt the Fed is hoping US consumer will splurge on and US lenders will eagerly hand out just so the housing bubble of 2006/7 can be recreated and housing can again become a “money-like” instrument – which as we have explained in our shadow debt series is the all important missing link which the Fed needs to come back so it can finally stop micromanaging the US market and to a lesser extent, economy.
It is the stubborn unwillingness of Americans to comply with this directive to go out and rake up as much mortgage debt as they can that is the biggest hurdle to “renormalizing” to a post-bubble economy, because in addition to a stock bubble, the US economy also needs a housing bubble to restore its previous “shine.”
RealtyTrac also found that the national median home price requires 30% of average wage. This means that in Q1, the average wage earner needed to spend 30.2% of monthly wages to make monthly mortgage payments (including property taxes and insurance) on a median-priced home ($199,000), up from 26.4 percent of average wages needed to buy a median-priced home in the first quarter of 2015.
It adds that “when home prices were most affordable nationwide in Q1 2012, the average wage earner needed to spend 22.2 percent of monthly wages to buy a median-priced home. When home prices were least affordable nationwide in Q2 2006, the average wage earner needed to spend 53.2 percent of monthly wages to buy a median priced home.“
* * *
What this simply means is that while few will want to admit it, the bubble conditions of an unaffordable (for most) housing bubble have returned.
Finally, for those curious, these are the least and most affordable housing markets in the US:
Markets least affordable by absolute standard
The top five least affordable counties based on percentage of average wages to buy a median priced home were Kings County, New York (Brooklyn) at 120.4 percent; Marin County, California in the San Francisco metro area at 109.2 percent; Santa Cruz County, California in the Santa Cruz metro area at 106.9 percent; New York County, New York (Manhattan) at 105.1 percent; and San Francisco County, California at 95.3 percent.
Markets most affordable by absolute standard
The top five most affordable counties based on percentage of average wages to buy a median priced home were Wayne County, Michigan (Detroit) at 8.5 percent; Baltimore County, Maryland at 9.2 percent; Clayton County, Georgia in the Atlanta metro area at 10.1 percent; Bay County, Michigan in the Bay City metro area at 11.5 percent; and Rock Island County, Illinois in the Davenport-Moline-Rock Island metro area at 12.3 percent.
via Zero Hedge http://ift.tt/1T8viSa Tyler Durden