Among the most memorable events of 2018 is that one of closest correlations across major asset classes – that between stocks and bonds – broke down, prompting Deutsche Bank strategist Torsten Slok to exclaim that “something is wrong.”
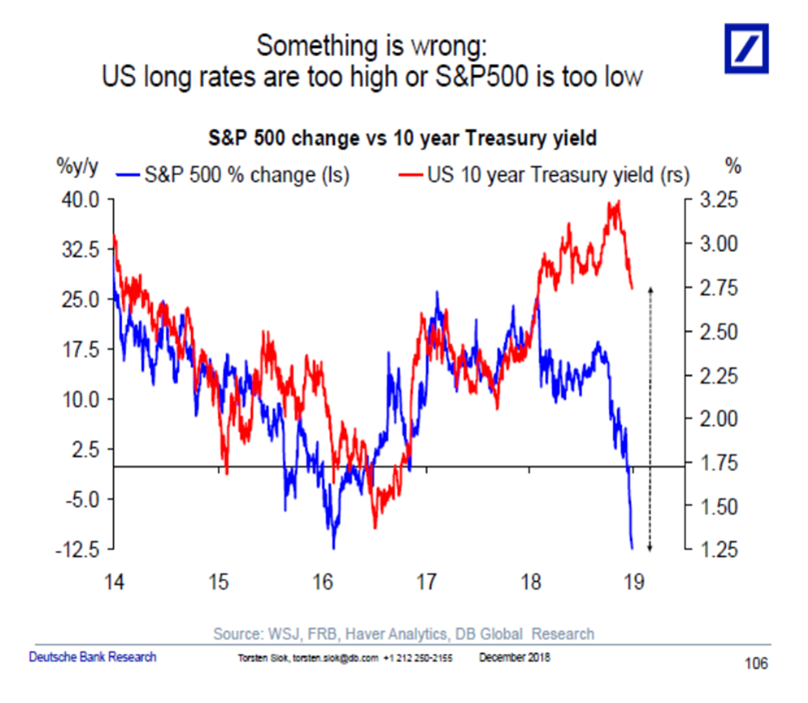
“What is safe to say is that there is something driving equities lower, which is not impacting rates. Or there is something keeping long rates high, which is not impacting equities,” Slok mused in a note in late December, discussed here.
Slok also predicted that anyone expecting this divergence to collapse shortly may be disappointed since the breakdown of the positive correlation between stocks and bond yields may not just be a temporary problem as the federal government is projected to notch annual trillion dollar deficits for a “very long time, prompting traders to demand even higher bond yields in the future regardless if stocks underperform.
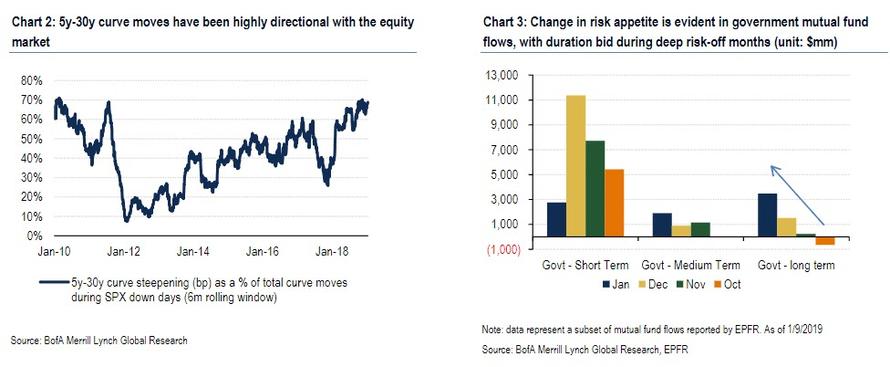
And yet, the breakdown of the bond/equity correlation appears to already be over because as Bank of America observes in its latest weekly Rates report, this dynamic once again changed in the last two months as markets repriced the growth outlook and equity markets sold off, the belly of the curve (5y-7y) led the Treasury market rally, in sharp contrast to the first three quarters of 2018. As a result, 5y-30y curve became increasingly directional with equity markets during risk-off moves (Chart 2).
What prompted this “renormalization” in one of the historically stongest market correlations?
According to BofA, the heart of the concern is global growth. As a result, headlines on central bank dovishness and trade talk progress only provide temporary relief and are discounted by rates investors. By the same logic, investor risk appetite may only be altered materially when US and China data stand on solid footing.
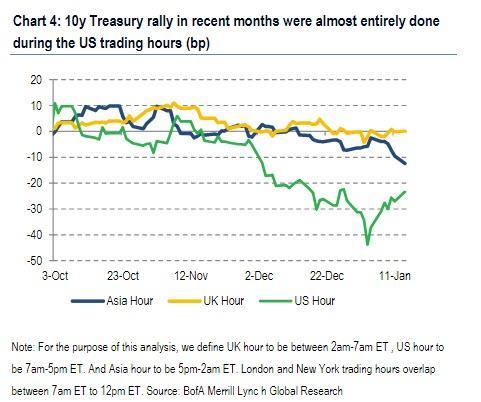
This change in risk appetite has been reflected in flow data as shown in Chart 3 above. Over the course of the Q4 risk-off move, mutual fund flows shifted from the front-end to the long end, similar to the behavior in January 2016. As such, until the market receives new information on growth outlook, for better or worse, Bank of America notes that both the Fed and the markets may need to be patient.
Which brings us to the key question that needs to be answered to determine future asset returns heading into 2019, namely “how much” and “how fast” the US economy is going to slow down, as opposed to the “if” question.
Unfortunately, according to Bank of America, we have to be patient to get a clearer sense of the above question but the next few weeks will be critical as Q4 earnings are released from corporate America and January data start to come in.
As a result, BofA sees three paths for the market:
- The stairs scenario: while there have been scary prints in global data, there is still a possibility that the US economy is weathering the global slowdown just fine. At least some of the most reliable indicators for predicting a recession are still far from stress levels. The flipside is that if what we’ve seen so far is a bad dream, the pause that the Fed is currently engineering may be short lived once we are back on track later this year. In this case, supply pressure would have a much bigger impact than in 2018, and a belly led sell-off could reverse the long end steepening we’ve seen, and the supply pressure could really kick in; the result would be a rerun of the late summer of 2018 when rising yields sparked an equity slump.
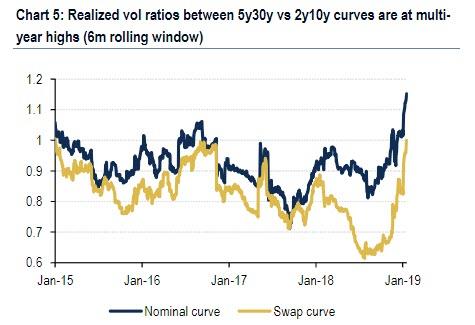
- The escalator scenario: Irrespective of the ongoing sharp bull market rally in stocks, BofA believes that it is increasingly likely that the markets will experience a more volatile H1. As discussed above, while the rest of the world has been dealing with growth roadblocks all of last year, asset prices in the US only re-priced recently. Meanwhile, according to time-zone analysis from BofA, the Treasury rally since Q4 2018 showed that almost the entire 50bp move in 10y UST was done during US hours, reflecting domestic investors pricing in a weaker growth outlook. The silver lining is that while data continues to be sluggish, markets and sentiment were able to at least push central bankers and politicians to be more accommodative, leaving the outlook for H2 a little brighter (for now).
- The roller-coaster scenario: the economy would be a mess in this case, which however is far from reality at least based on recent data; should this scenario materialize the simple call would be to buy bonds no questions asked.

And since the observations above reflect the views of BofA’s rates team, they conclude that without new information on data, earnings, and policies, both rates and curves are likely to stay range-bound, adding that of the scenarios list above, the first one would cause the most positioning pain as investors unwind 5y-30y curve steepeners and short vol positions in the front end (the Fed is not only willing to be patient, they are also willing to be flexible). Scenario two is the most likely according to BofA, with rates continuing to follow risky assets, with the belly leading the moves.
Eventually, as more economic data emerges and solidifes the case for either an accelerating slowdown or a rebound, the Fed will have to react. As long as the Fed is on hold, BofA is confident that the time for a structural steepener is not ripe, and even though steepeners were the trade in vogue in recent weeks, 2y-10y has remained relatively flat. The bank further notes that “the recent 5y-30y steepening is a reflection of growth concerns and haven bid, rather than the beginning of a cutting cycle. “
Finally, if the economic climate improves and the hiking cycle resumes, while stocks will likely resume their slide, the 5y-30y should continue to flatten; alternatively, if the economy hits a brick wall and there is a need for the Fed to cut rates, 2y-10y curve catch up to 5y-30y.
via RSS http://bit.ly/2Czvian Tyler Durden