After 13 weeks of near constant selling by institutional and retail investors, which as we noted last Friday resulted in the worst start to a year for equity flows since 2008, paradoxically even as the market was grinding ever higher…
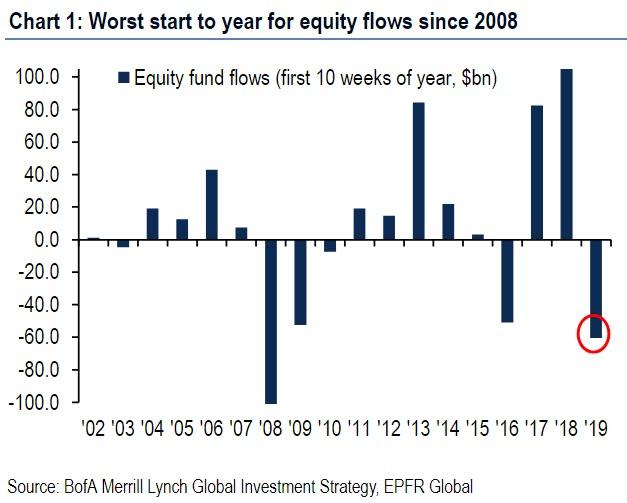
… the bears finally threw in the towel in the latest week, when according to EPFR data compiled by Bank of America, investors bought a whopping $27.26bn of US stock funds and ETFs in the week ending on March 13th. This was the second largest inflow on record, behind $38.30bn from March of last year, and contrasts with a mix of small inflows and outflows earlier this year, including a $5.83bn outflow in the prior week. Drilling down, despite this week’s rather dreary volumes, BofA also notes that the $12.1bn equity buying on Tuesday largest daily bid since Sept. 20, 2018, the S&P 500 market top.

Yet in the latest confirmation of the ongoing confusion of capital allocation, unlike prior episodes of risk on capitulation which saw a wholesale selling of fixed income, buying of bonds also accelerated for a 10th consecutive week, to $7.01bn from $2.74bn on stronger flows for high yield and government bonds while inflows to high grade remained relatively stable
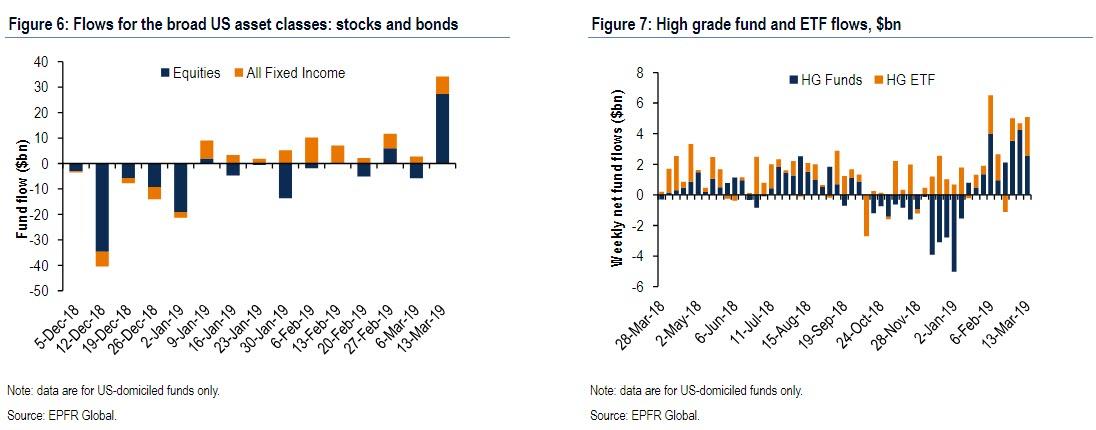
Drilling down into bond flows, last week saw net inflows to high grade of $5.10bn, similar to a $4.68bn inflow a week earlier and $5.01bn inflow for the week ending on February 27. The split between short-term and ex. short-term flows was also little changed. Short-term high grade inflows declined a bit to $2.36bn from $2.55bn, while ex. short-term inflows increased to $2.74bn from $2.13bn. On the other hand, a decline in inflows to funds (to $2.58bn from $4.24bn) was offset by an increase in inflows to ETFs (to $2.52bn from $0.44bn).
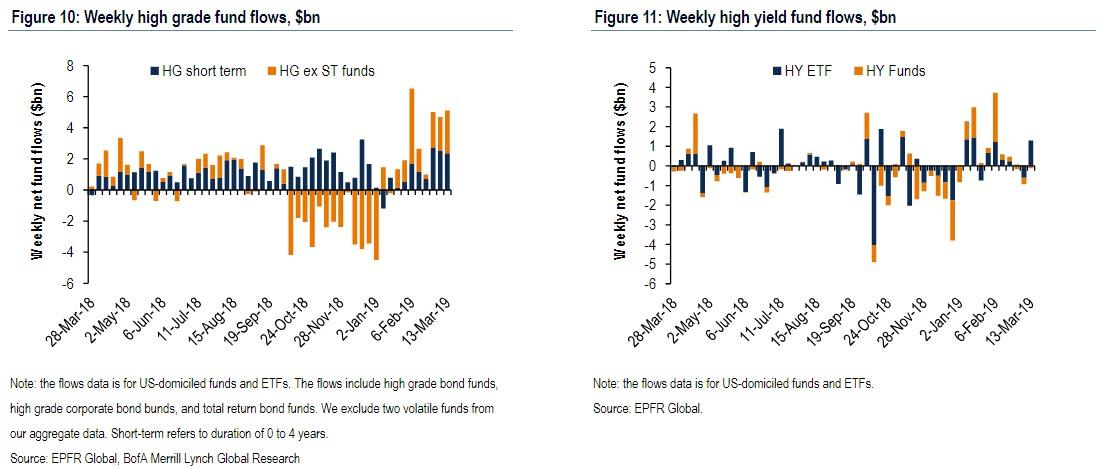
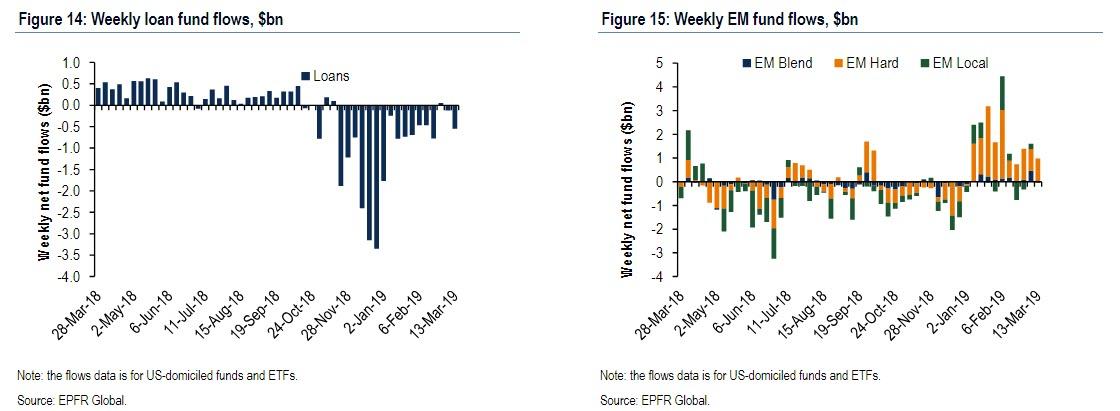
Continuing with credit, flows turned positive for both high yield (to +$1.18bn from -$0.93bn) and government bonds (to +$0.09bn from -$1.95bn). Inflows also improved for munis, rising to $1.20bn from $0.76bn. On the other hand outflows from leveraged loans accelerated to $0.55bn from $0.13bn, a 17th straight week of outflows, while inflows to global EM bonds declined to $0.93bn from $1.61bn. Finally, money markets reported a $1.27bn outflow this past week and a $30.43bn inflow in the prior week.
Going back to equity flows, here are the details:
- Biggest US equity inflows in a year ($25.5bn)
- Japan: 5th week of outflows ($1.1bn)
- Europe: chunky outflows again ($4.6bn)
- EM: biggest outflows since Jun’18 ($2.8bn)
- By style: inflows US large cap ($17.1bn), US small cap ($2.5bn), US growth ($1.0bn), US value ($5.2bn)
- By sector: inflows healthcare ($1.6bn), telcos ($0.6bn), utilities ($0.2bn), real estate ($0.2bn), financials ($8mn), materials ($0.2bn); outflows energy ($1.0bn
Commenting on the latest fund flows, BofA’s CIO Michael Hartnett notes the ongoing resilience of risk assets: minimal “profit-taking” on US-China trade truce news, poor Asian export data, ECB capitulation, and concludes that the “pain trade” is still up.
Why? The answer is familiar and simple: the new highs in IG & HY bond prices, new lows in volatility (e.g. MOVE index), shows that central banks “all-in”, and more importantly, “markets are not yet willing to trade policy impotence.” Of course, if and when “policy impotence” becomes the dominant trading theme, it’s all over.
via ZeroHedge News https://ift.tt/2UJ5vVb Tyler Durden