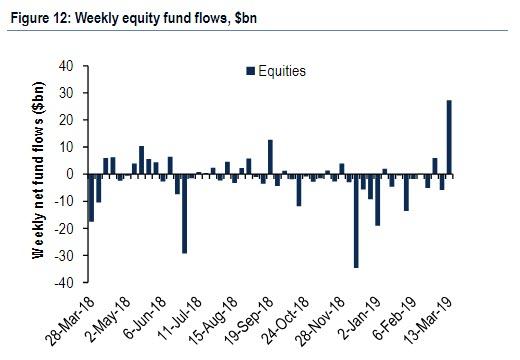
While one market mystery is resolved, as bears finally capitulated resulting in $27.2BN in equity inflows last week, the second biggest equity inflows on record and reversing from 13 weeks of outflows thereby finally validating the relentless move higher in equities…
… others remain, chief among which is the unprecedented divergence between stocks and bonds, as markets increasingly price in QE4 .
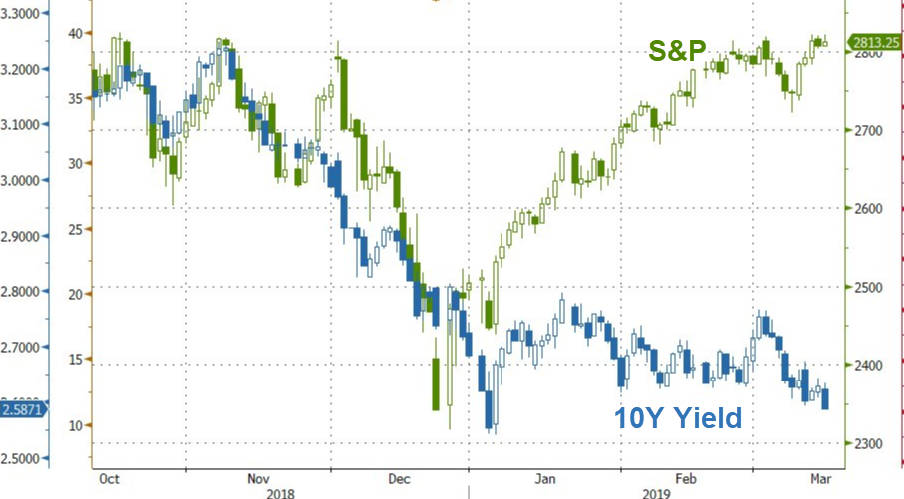
Yet while that divergence appears to merely be a throwback to the market’s POMO days as traders prepares for the Fed to launch QE4 sometime in 2020, many other frequent questions remain, among which Bank of America lists the following”
- What is the “tale of the tape”?
- Where are the “green shoots”?
- Who is buying equities?
- When should we sell?
- What’s the most vulnerable crowded trade?
- Why are bond yields stubbornly low?
Answering these in sequences, and commenting on this ongoing “resilience of risk assets”, which has seen minimal “profit-taking” on US-China trade truce news, poor Asian export data, and the ECB’s recent capitulation, BofA’s CIO Micharl Hartnett addresses the first question…
What is the Tale of the tape
… and answers it simply: the “pain trade” is still up for one main reason: with new highs in IG & HY bond prices, new lows in volatility (the record drop in the MOVE index), all this shows that central banks are “all-in”, even though markets are not yet willing to trade the “policy impotence”.
Some other tape revelations: even as cyclical lead indicators remains mixed: e.g. XBD, XHB, SOX, KOSPI/ChiNEXT treading water on weak macro; global banks are close to new ’19 highs. Meanwhile emerging markets are showing cracks: China & India aside, “short US$, long EM” consensus under pressure, while at the same time the rally is reversing in “high-yielding” EM FX (PHP, IDR, BRL, ZAR, TRY).
Where are the “green shoots”?
Looking at the big picture, there are no “green shoots” to be found with BofA’s global EPS model forecast now plunging from -2% to -10% on “dire Asian exports & global PMI deterioration” in February; this is a far cry from the analyst consensus of 1% EPS growth in 2019. Meanwhile, as we discussed recently, both the Japan and Eurozone economies remain in recession although the silver lining is that BofA’s European Composite Macro Indicator has finally stabilized after 12 consecutive months of decline.
Meanwhile, there are plenty of “green shoots” in China, where both M1 & new orders rose in Feb for 1st time in 9 months, March (first 20 days) exports up 39% & electricity usage +11%; The cherry on top: Jan-Feb investment at state-owned enterprises rose 6%, first big increase in 2 years.
Putting all this together, Hartnett reaches the same conclusion as Morgan Stanley, namely that Q1 is the low for global macro data, while downside risk for growth is more likely from US where consensus sees Q2 GDP bounce to 3% from 1% in Q1. This is also the bogey: should Q2 EPS come in <2%, the risk rally would end. Yet even the US has some good news, namely US survey data which stabilized in Feb and is correlated and consistent with at least 2-3% US growth.

Which brings us to the next frequently asked question…
Who is buying equities?
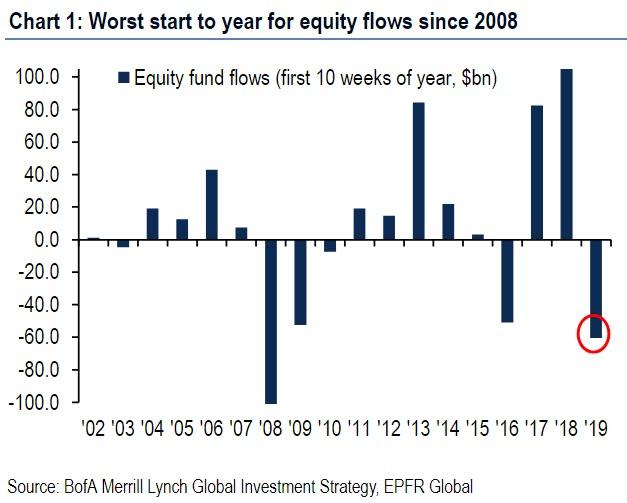
While we answered this question previously, it is gratifying to see that BofA reaches the same conclusion as us. The bank frames the problem as follows: global stocks are up 11% YTD despite $46BN of equity outflows YTD and the BofAML Fund Manager Survey showing drop in asset allocation to global stocks.
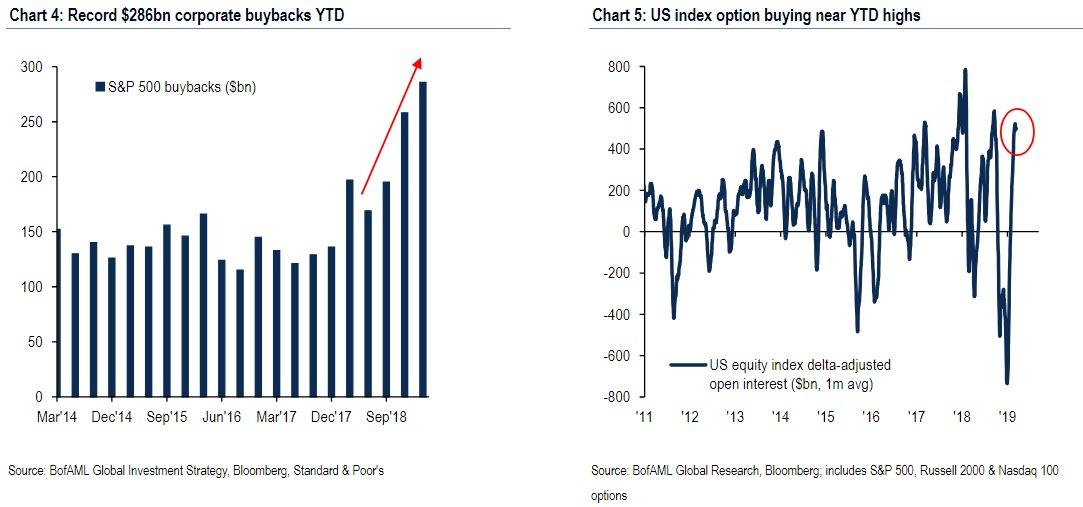
So if investors aren’t (or at least weren’t until this week) buying stocks, who is? The answer: 3 buyers:
- Buybacks: 286bn buybacks YTD (vs. $197bn same period last year);
- Institutional buyers of call options: US equity index delta adjusted open interest $544bn, near YTD highs (Chart 5);
- Retail investors via single stocks: $13.2bn buying YTD from BofAML GWIM data (vs. $5.7bn selling same period last year).
So now that we know who is buying, the next obvious question is…
When Should we Sell?
BofA here has a simple answer: when the BofAML Bull & Bear Indicator moves above 8. There are three drivers that would push the indicator toward “excess bullishness” in the next 4-6 weeks:
- equity inflows >$50bn next 4 weeks
- March BofAML Fund Manager Survey (Tuesday 19th) showing cash levels of <4.5%, equity allocation up from 6% to >30%
- CTFC hedge fund positioning >0.5sd long risky assets (vs. neutral today)
If that is not enough, here is a second answer: when the combo of higher US unemployment claims & higher credit spreads indicate the onset of recession & debt deflation; or when combo of higher Treasury yields & lower US dollar indicate inflation & Fed policy mistake.
To be sure, with the Fed telegraphing “pause” and soon, QE, the moments of selling is still over the horizon. But one doesn’t have to be exposed to the market to get hurt – just being part of the most crowded trade could lead to far more pain, and far sooner. So…
What’s the most vulnerable crowded trade?
Here the answer is simple: emerging market debt and equity: in the February edition of the BofA Fund Manager Survey, the most crowded trade was “long EM”; since it was released, the price return of EM debt 0.4%, of EM equity 0.3%. And in case that point needs to be underscored, Hartnett notes that “historic returns from month of “most crowded trade” poor, e.g. FAANG+BAT stocks after Aug’18, Bitcoin after Dec’17, US dollar after Jan’17.
And with these five questions down, one last puzzle keeps BofA clients up at night, namely:
Why are bond yields stubbornly low?
The answer: easy central bank policy & still-falling global consensus GDP/EPS/interest rate forecasts best explanation why bond yields low. And here Hartnett makes a bigger point:
this is no normal cycle; yields are lower than they would normally be because policy makers in Japan & the Eurozone are completely out of monetary ammunition from a longer-term perspective, Chinese policy makers are targeting lower and rebalanced growth over the medium-term, and future Fed cuts are likely to prove less potent given level of US corporate debt; thus the message from government bonds remains a world where structural deflation continues to be the primal backdrop to financial markets.
Those traders who correctly figure out how to trade this massive disconnect – the structural deflation as hinted by bonds on one hand, and asset price inflation as stocks scream every day – will make a lot of money in 2019.
via ZeroHedge News https://ift.tt/2HmNJUp Tyler Durden