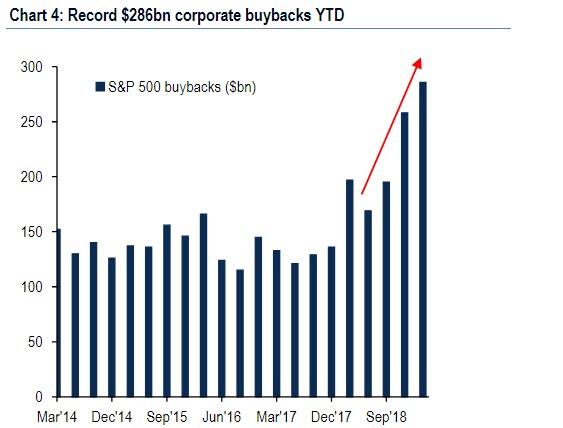
Heading into quad-witching Friday, Nomura’s Charlie McElligott laid out that in addition to systematic overwriters rolling-out In The Money Calls last week forcing significant dealer “delta hedging grab” (a closed loop where dealers buy more risk the higher the market rises), and of course the record notional of corporate buybacks already announced in just the first three months of 2019…
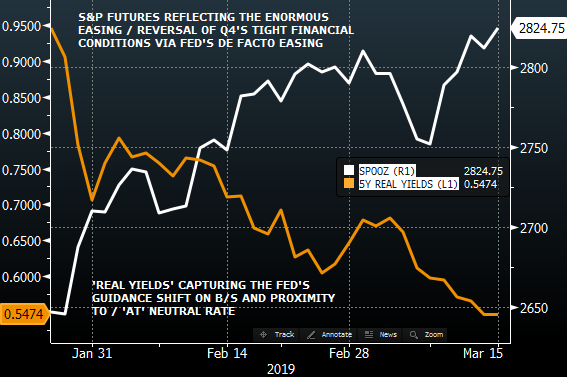
… a key driver behind the ongoing risk rally was the return of the QE trade, or as McElligott put it, the “de-facto easing has already begun.” To McElligott, this was visible in the ongoing collapse in real rates, to wit:
U.S. ‘real rates’ continue to collapse, with 5Y TIPS yields printing fresh 11 month lows yesterday—which is a pure reflection of the market’s perception that we’ve reversed last year’s paradigm (the macro regime shift “from QE to QT” = the catalyst behind my “Financial Conditions Tightening Tantrum” Phase 2 in 2H2018 from my “Two Speed Year” 2018 thesis) and that the Fed have instead already “de facto EASED”
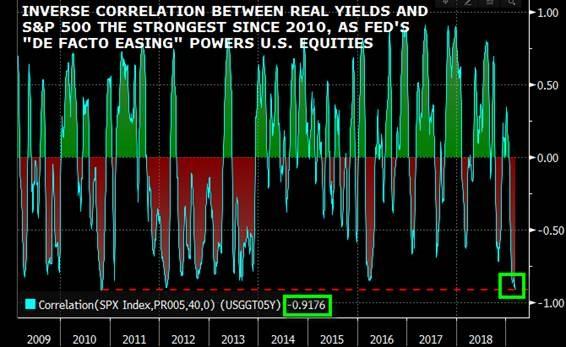
Furthermore, as the chart below shows, the inverse correlation between real yields and the S&P is now a “stunning” -92%, levels last seen during QE1.
Today, with Op-Ex now in the rearview mirror, markets are focusing on the next big event, namely this week’s FOMC meeting, which is expect to add more fuel to the dovish fire. Specifically, Nomura expects the FOMC to:
- Substantially revise their interest rate forecast LOWER, in conjunction with downward revisions to the Committee’s Growth- and Inflation- forecasts
- Further clarify their intent to see the balance-sheet runoff complete in October (timing largely related to the Federal debt limit, which will impact the level of reserves in the banking system)
- Keep the aggregate size of the B-S “fixed” for a period thereafter, which will lead to gradual further declines in reserves
- Continue to allow its MBS to run-off (most importantly for my STEEPENER view, we believe that starting-in October, MBS amortizations will be used to purchase the front-end via newly-issued T-Bills as per our “Reverse Operation Twist” thesis, which inherently is a curve steepener—yet still likely with the operational particulars not yet likely to be announced by this week’s meeting)
Yet it’s not all smooth sailing for a market where as McElligott writes today, equities are now a pure “flow show”, with the derivative strategist warning that following last week’s euphoric burst higher, the coming 2-4 week “window” set a stage for a potential supply/demand pivot, as a result of the following six factors.
1. Market Slides After Bearish Capitulations
The first one is that last week’s capitulation equity inflow is actually an adverse signal for markets. As we discussed earlier, last week “sidelined” bears finally threw in the towel, as following large outflows of over $100bn since October, US equity funds this week saw inflows surge with over $31bn in the first 3 days, helping drive the S&P 500 back to the top of its recent range.
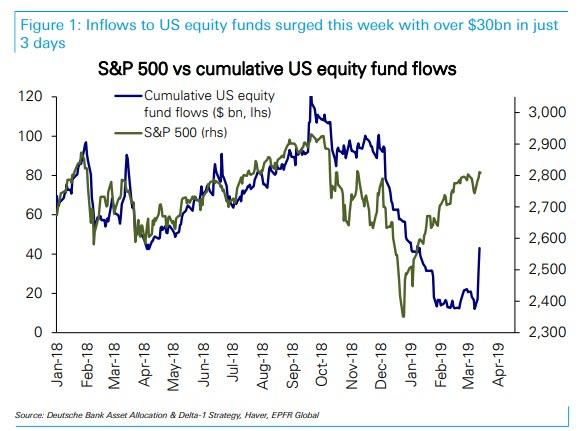
Nomura subsequently defined this massive inflow into stocks as a “QE-type fund flows capitulation” from investors (largest 1w inflow for USEQ Passive-, Institutional -and Overall- of the past 12m), and noted that last week’s inflow represented a “100th percentile” US Equities inflow in the history of EPFR fund flow at $25.5B—the 4th largest weekly US Equities inflow in history (data back to 2002). This type of capitulation, however, is concerning because as Deustche Bank noted over the weekend, in a majority of episodes surging inflows were a contrarian indicator. 6 out of the 9 episodes saw the S&P 500 fall an average of -5.9% over the course of the following one month, accompanied by outflows.
Nomura adds to this observation, and writes that most prior “Equities Inflow Outliers” (the Japanese bank ran a test for “months since 2006 where flows were +$19.9B or more for the month = 95th %ile”) shows strongly negative equities returns over the next 3m, with 2w returns particularly negative (happened 8x’s since 2006), or specifically, the 2 week S&P return is -3.8% with 25% hit rate; 1 month us -3.8% with a 50% hit rate; and the 3 month -2.4% with a 50% hit rate.
2. Fading Dealer Delta-Hedging Demand
While dealer delta-hedging (see top) helped boost risk assets higher into the seasonal pre-Op-Ex ramp up, with quad-witching in the rear-view mirror, going forward dealer delta-hedging demand fades per standard post Op-Ex seasonality (as McElligott explains there is “less Gamma in the market with 25% of SPX options rolling-off, with SPX / SPY Calls OI in particular -31% WoW”)
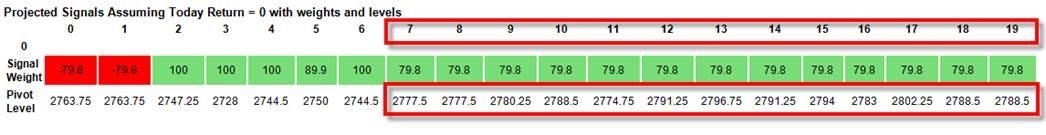
3. CTA “Sell” Triggers Keep Rising
Another note highlighted by McElligott in the past two weeks has been that as stocks rise, so do CTA sell triggers; in fact, the CTA / Trend “sell triggers” across US stocks “jump” closer to spot by the end of the week and hold-higher looking out the next 3w / 4w. In fact, as shown below, all else equal, within 17 days, the S&P “sell” trigger level will rise as high as 2,802, meaning even a modest downdraft in stocks will results in an accelerated move to the downside as CTAs engage sell programs. Incidentally, S&P CTAs are currently “100% long”, and would resume selling under 2745.9 to get to 56%, more selling under 2700.37 to get to -100%, flip to short under 2700.65, max short under 2700.37
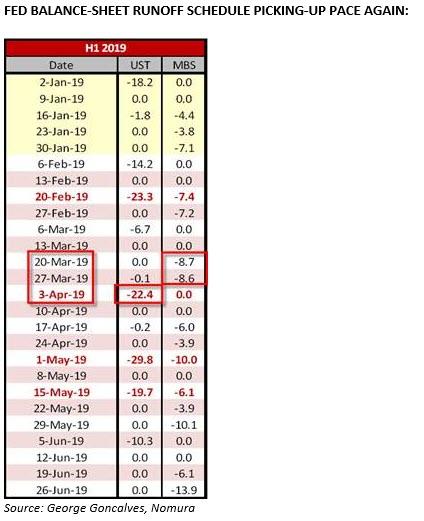
4. Ongoing QT And Heavy End-Of-Month Rolloff
Even though investors have already pivoted “From QT back to QE”, McElligott warns that – at least until the Fed officially ends the rolloff – the ongoing QT/balance-sheet shrinkage is picking-up the pace again, particularly with MBS runoffs to increase meaningfully at the end of the month (-$8.7B March 20th week / -$8.6B March 27th week—and remember, “chunky” MBS roll-offs matter the most for cross-asset volatility), along with a particularly large UST runoff at start April (-$22.4B April 3rd week):
5. Stock Selling From Quarter-End Pension Rebalancing
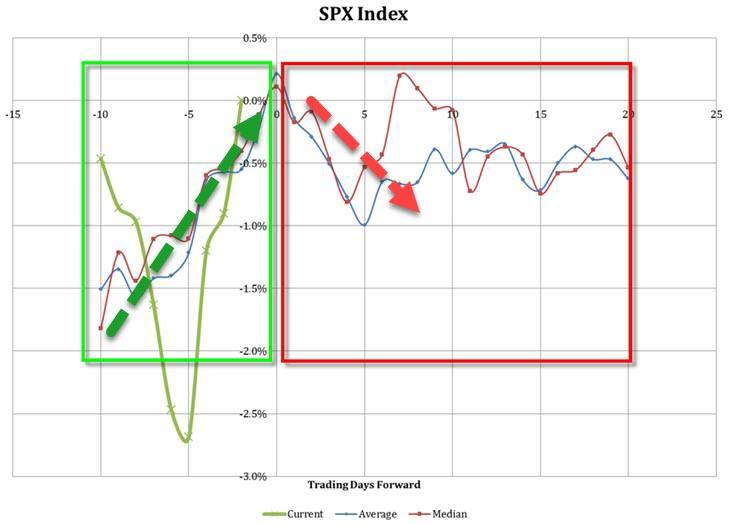
Unlike the end of 2018 which saw a monster buy-order from Pensions helping to lift stocks in the last days of the year, quarter- and month-end pension rebalancing flows should be particularly significant as SPX has outperform Bonds by over 12% QTD — a 91st %ile move since 1973, according to Nomura, which notes that this “sell equities, buy USTs” flow begins to emerge approximately 5 to 10 days prior to Quarter-end.
McElligott’s colleagues tested this patterns of pensions selling equities, buying bonds by running a backtest in which the “SPX outperforms USTs by > 12.2% on QTD, and contingent on the prior quarter seeing an Equities SELL-OFF” analog, and finds that this “sell Equities” pension rebalancing flow “realizes” in the market ahead of the quarter-end (5 instances: 1980, 1998, 1998, 2003 and 2009) as follows:
- 10d “going-into” quarter-end, SPX median return is -0.8%
- 5d “going-into” quarter-end, SPX median return is -2.1%
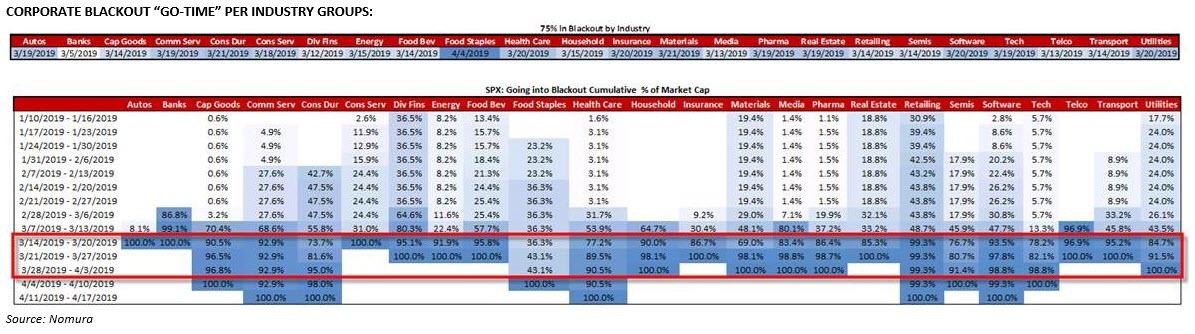
6. Buyback Blackout Window Begins
As we noted earlier, the corporate buyback blackout period begin, with markets “on the margin” seeing the corporate demand significantly reduced over the next 1m into Q1 EPS season.
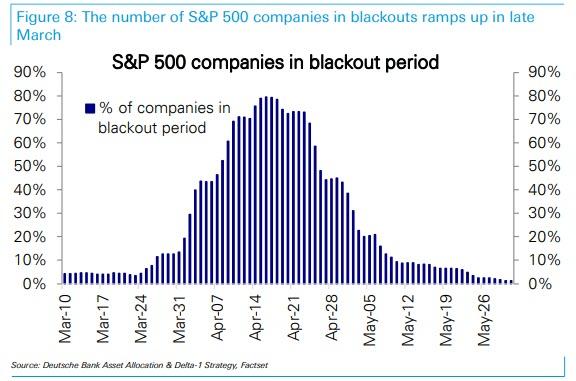
Commenting on the temporary loss of this key upside drive, McElligott calls it the “monster demand flow” of the past 10 year period for US Equities, adding that “we are seeing repurchase desks around the Street reference 1Q19 as “THE” largest notional $buyback ever, with last week particularly heavy ahead of the “blackout” commencing in-earnest this week (75% of S&P 500 in buyback blackout by 3/19/19)”
Needless to say, with this biggest source of demand for stocks on pause for the next month, any sustained bid below the market will have to come from other sources.
Yet despite these 6 concrete reasons for imminent risk weakness, McElligott expects at most a brief pullback as investors flood back in on any more significant drop, mostly due to FOMO. As he explains, his key point regarding this ‘supply/demand shift’ as the markets enter a 1 month pullback window is this: with obvious continued “under-positioning” and thus significantly “under-exposed” to this ongoing Equities re-rack, “I would expect any potential pullback over the next 1m to be shallow and likely ‘get scooped’ on account of performance FOMO”:
- Fundamental L/S (HFR Equities HF Index “20d Beta to SPX” at just 39%);
- Macro HF (Macro Fund “Beta to SPX” at just 9th %ile per internal analysis);
- Risk-Parity investors $exposure to SPX at lows dating-back to Nov16 levels per our internal models;
- Retail with 89 consecutive weeks of OUTFLOWS per EPFR
Of course, since in this market the only thing that matters is what the Fed says, all of the above may either be reversed by 180 or supercharged based simply on whether the algo reaction to Powell on Wednesday is “too dovish” or “not dovish enough.”
via ZeroHedge News https://ift.tt/2HF8r1k Tyler Durden