After a disastrous for capital markets fourth quarter, the Fed once again worked it’s Pavlovian magic, BofA’s Chief Investment Strategist Michael Hartnett writes, as an abrupt end to rate hikes & Quantitative Tightening “caused pessimistic investors to salivate at the prospect of more central bank liquidity.”
The result was a collapse in volatility and spreads (US IG BBB from 206bp to 161bp, in fact as Bloomberg writes “BBB Rated Corporate Bonds Off to Best Start to a Year Since 1995“), equity multiples re-rated sharply higher (MSCI ACWI from 12.7x to 14.9x), and the QT-driven appreciation in the US dollar was interrupted.
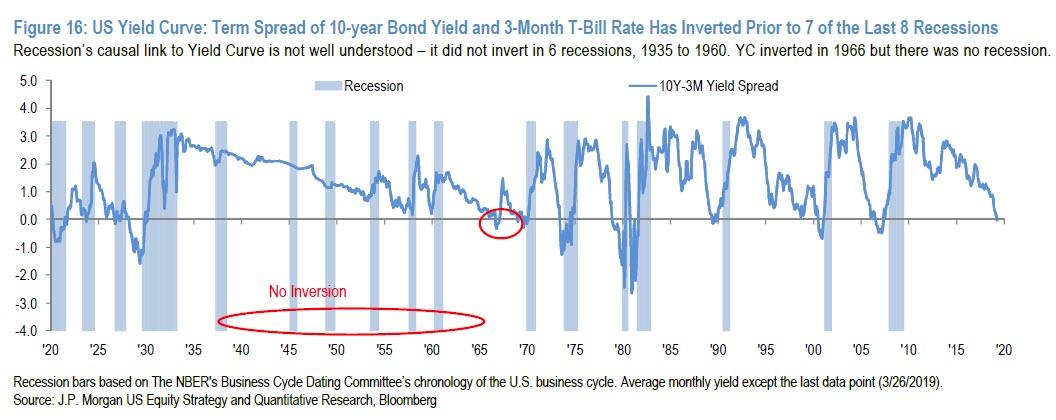
Yet in keeping with all such prior “aggressive easing” episodes which saw buying across all asset classes, “Pavlov’s Dog bit the Fed” as 10-year bond yields tumbled in March as bond market volatility exploded: Australia -47bp, US -37bp, UK -31bp, Germany -26bp, China -15bp, Japan -10bp, and the 3m10y US yield curve inverted for first time since July’07. And since the yield curve has been a strong predictor of recession (in 7 out of the last 7 occasions, although in the immediate post-war period, recessions were not preceded by inversion), markets ended Q1 fearing recession & policy impotence.
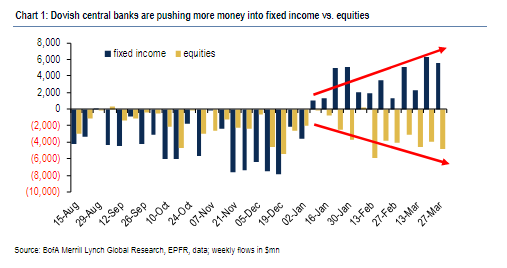
Meanwhile, investors have refused to buy – quite literally – the sharp rebound in the S&P, which is set for its best quarter since 2009, and sold stocks all the way with 13 consecutive weeks of equity fund outflows offsetting inflows into fixed income as the rush for yield overcame the desire for capital appreciation.
Last week was no different, as according to EPFR the rush out of stocks continued apace, with $12.5 billion pulled from equities ($7.7BN out of US stocks, $4.8BN out of EU, $2.0BN out of EM.) while a fresh $8.6 billion went into bonds ($5.2bn into IG, $2.2bn into EM debt, $0.9bn into HY).
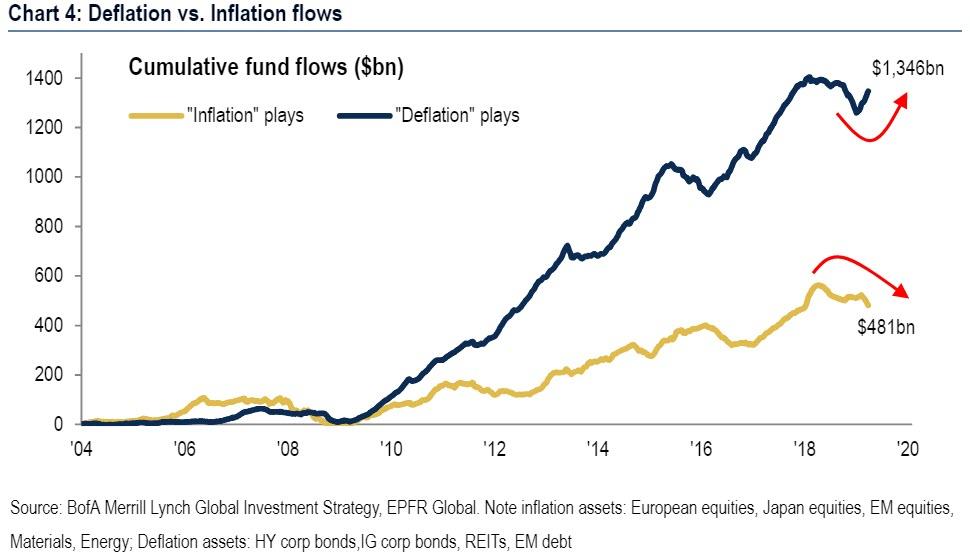
Summarizing these trends, Hartnett writes that as we begin the second quarter, consensus starts Q2 long “secular stagnation” & “deflation” with $87bn of inflows into “deflation assets” YTD (e.g. corp & EM bonds & REITs), and $42bn redemptions from “inflation assets”.
Yet despite these clear “great unrotation” flows, the prevailing sense is one of confusion, as “investors are discounting neither recession (they love corporate bonds) not recovery (they don’t like cyclical equities).“
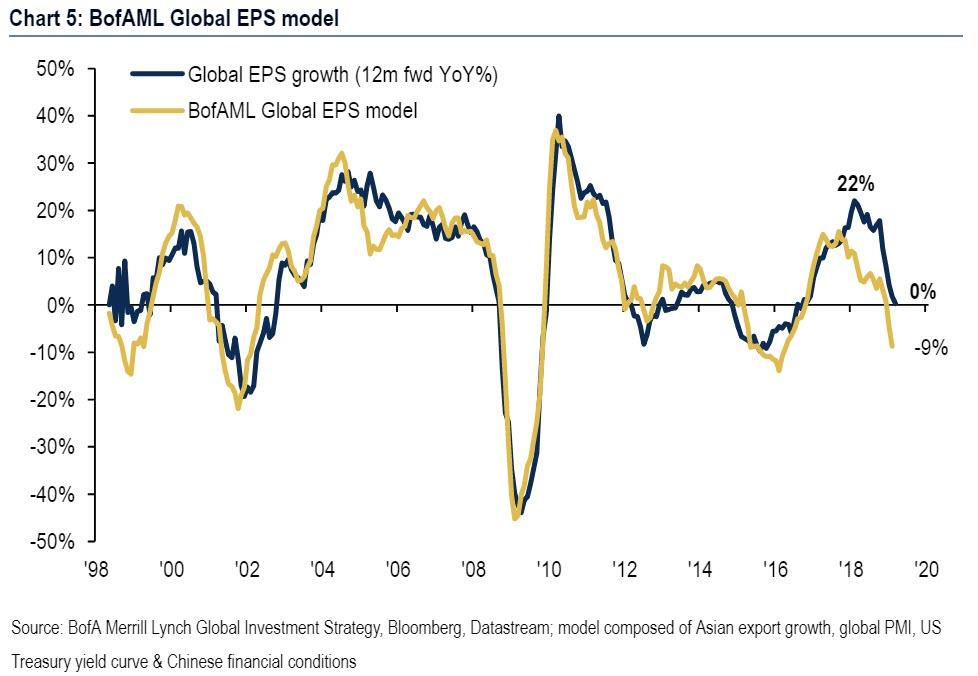
So in an attempt to provide some clarity to confused traders and frame the current prevailing market themes, Hartnett writes that whereas Positioning & Policy were positive catalysts in Q1, Profits will be the catalyst in Q2. Here Hartnett concedes that in his view, consensus global EPS numbers remain too high (BofAML Global EPS model forecasts -9% EPS growth in the next 12 months vs. analyst consensus 0%), suggesting that the next leg in the market is one of disappointment.
To make it even easier, Hartnett lays out its three core Q2 scenarios and predicts that the fate of the second quarter, whether Stagnation, Recession, or Recovery is the dominant Q2 outcome, will depend on the evolution of BofA’s global EPS model, as follows:
- Stagnation: global EPS forecast stagnates @ -5-10% as US growth dips below 2%, global PMIs vacillate around 50, US rates fall toward anchored/negative Japanese & Eurozone rates, secular “Japanification” trade of past 10 years hardens; the big tell…credit bid, volatility offered; the big trades…long 30-year UST, biotech, short resources, volatility.
- Recession: global EPS forecast drops to -15% as surge in US unemployment claims indicates US consumer joining manufacturing recession in China, Japan & Eurozone where PMIs drop to 45; the big tells…oil <$50/b, JNK <$33, INJCJC4 >300k; the big trades…short tech & corporate bonds, long T-bills, US dollar & VIX.
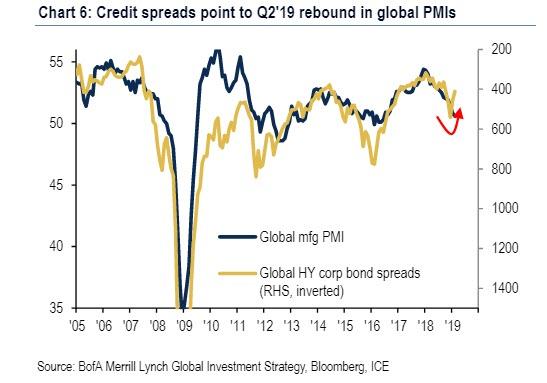
- Recovery: global EPS forecast turns positive as “green shoots” in Asian exports (Chart 1) & Chinese growth blossom, while lower US rates boost US housing data; credit spreads prove once again they are better lead indicator for risk assets than government bond yields (Chart 6); the tells…SOX >1450, XHB >$42, KOSPI >2350, yield curve steepens; the trades…long global banks, short bunds & US dollar.
Ironically, despite warning above that BofA believes global EPS expectations are artificially high, “tactically” it is in the Q2 “Recovery” camp. But that doesn’t mean it’s bullish, because after a brief rebound in risk in the second quarter, in the second half “we expect big top in markets before debt deflation/policy impotence leads risk assets lower.“
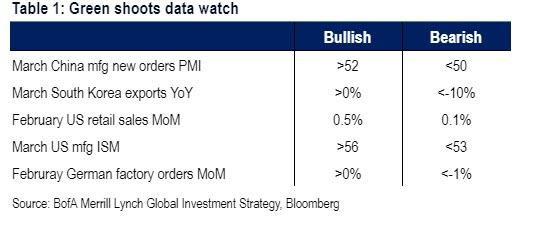
Conveniently, we won’t have long to wait to get a sense of how Q2 plays out as there 5 big datapoints in the coming week that will set the course, and expectations, for the entire quarter.
* * *
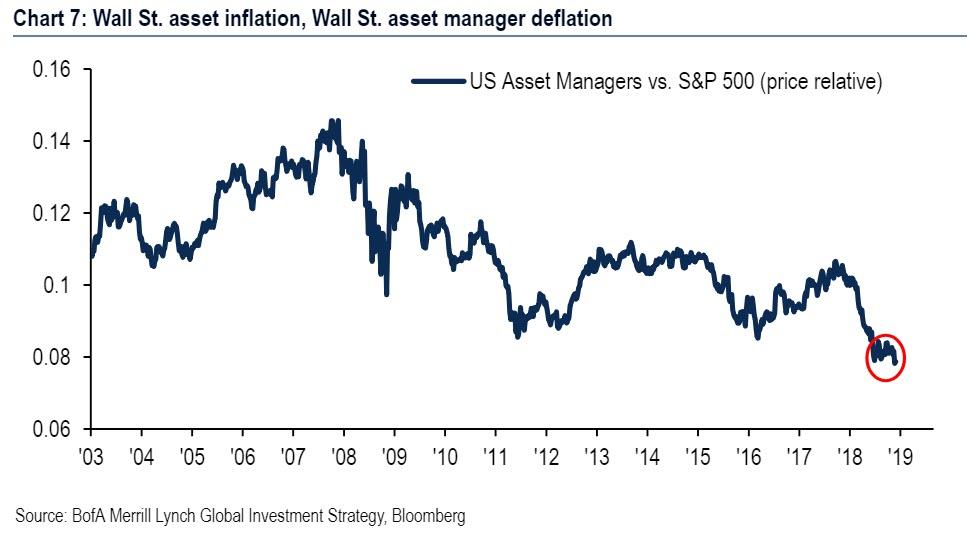
Hartnett concludes with one troubling, for all those employed on Wall Street, observation: deflation is now dominant. Specifically, with over $12trillion in central bank easing and 713 interest cuts since GFC, the result has been the longest and one of strongest bull markets of all time in corporate bonds & equities; yet the reflation of Wall Street assets has been accompanied by deflation of Wall Street fees (note asset manager stocks prices at 25-year relative lows):
This means that structural deflation remains rife even in cyclical “booms”, and remains the best explanation why bond yields continue their secular journey toward zero, something Albert Edwards has been predicting ever since he coined the Ice Age concept back in 1996.
via ZeroHedge News https://ift.tt/2FIbvH8 Tyler Durden
