With every passing day that the US China trade war is not resolved, it appears that Morgan Stanley’s bearish equity strategist, Michael Wilson, will be Wall Street’s most accurate forecaster for the second year in a row, because unlike various quants from JPMorgan who shall remain unnamed, he did not erroneously assume that trade war will be resolved quickly, and instead of slapping a lazy 3,000 S&P year-end price target, Wilson – despite being mocked by the likes of Bloomberg – remained stubborn in the face of the April market melt up, and said that it is only a matter of time before stocks rerate sharply lower.
So just to remind Morgan Stanley clients that unlike most of his peers who are nothing but lagging indicators, their calls flip-flopping every several weeks depending on which way the S&P moves, Wilson has published a report today in which he makes three rather bold calls:
- Trade is not the only risk to growth.
- Adjusting the yield curve for QE and QT shows a persistent inversion for the past ~6 months, suggesting recession risk is higher than normal.
- volatility is about to rise…a lot.
The first of three should be intuitive to anyone who has been following the market in the past month. As Wilson notes, looking at the most recent disappointing macro data including poor durable good, capital spending and Markit PMIs, “recent data points suggest US earnings and economic risk is greater than most investors may think.”
Supporting that claim is the fact that our US Cycle indicator moved into a downturn phase based on the April data which was before the trade talks broke down in early May (Exhibit 1). The OECD leading indicator also fell to its lowest level since the last recession. In addition, we are now hearing from many leading semiconductor (INTC, MCHP) and industrial companies (CAT, DE) that the second half recovery many are counting on is looking less likely. Like the weaker macro data in April, we don’t think these softer outlooks are the result of the uncertainty in the US/China trade negotiations. In the past week, our economists have lowered their 2Q US GDP forecast to 0.6% from 1.0%. We suspect this could deteriorate further if trade negotiations don’t improve soon.
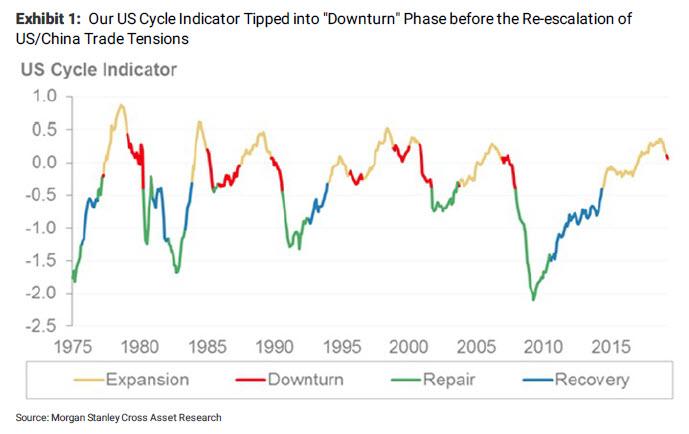
And since all of these reflect April data – which means it weakened before the re-escalation of trade tensions – the latest trade war will only make a dismal economic picture worse. In addition, Wilson claims, “numerous leading companies may be starting to throw in the towel on the second half rebound”, something the Morgan Stanley strategist has repeatedly warned about even though “many investors are not.”
In short, “get ready for more potential growth disappointments even with a trade deal.”
* * *
Wilson’s second, and even more important point is that whereas in the past 6 months the yield curve has been flirting with inversion, “adjusting the yield curve for QE and QT shows an inversion began at the end of last year and persisted ever since.” As the strategist notes, when the 10-year vs. 3-month yield curve inverted in March there was a lot of noise about what it meant for markets. However, it didn’t stay inverted very long and the noise dissipated. That’s only half the story, thought, because Morgan Stanley “adjusted the traditional yield curve for QE and QT and the results are interesting.”
A quick note on how said “adjustment” of the yield curve took place: First, to adjust for QE, MS took the Atlanta Fed’s work on the shadow Fed Funds rate. It then took the Fed’s estimate that every $200B of QT is worth an additional rate hike and added it to the Fed Funds rate. The result is shown below, with the darker line showing the impact of QE and QT on the raw Fed Funds rate.

Some observations on the chart above: As Wilson notes, it’s interesting that the adjusted Fed Funds rate touches the lower end of the well defined channel that has contained the Fed Funds rate going back to the early 1980s. Secondly, when adjusting for QT, the adjusted Fed Funds rate breaks the channel to the upside arguing the Fed may have exceeded r* last fall and helping to provide an explanation for the very difficult 4Q for the financial markets. It also explains why the US economy is now slowing more than perhaps many economists and investors expected. Given that monetary policy typically works with a lag of 12-18 months, it’s unlikely that a pause by the Fed will be enough to reverse the impact of the significant tightening that occurred by the Fed over the past few years.
Another observation: earlier today we noted that the nominal 3M-10Y yield curve has inverted the most since 2007, screaming recession.
Well, it gets worse. According to Wilson, when translating the adjusted Fed Funds rate into the yield curve by making the exact same adjustment to the 3 month T-Bill given the historical nearly 100 percent correlation, the result can be seen below.
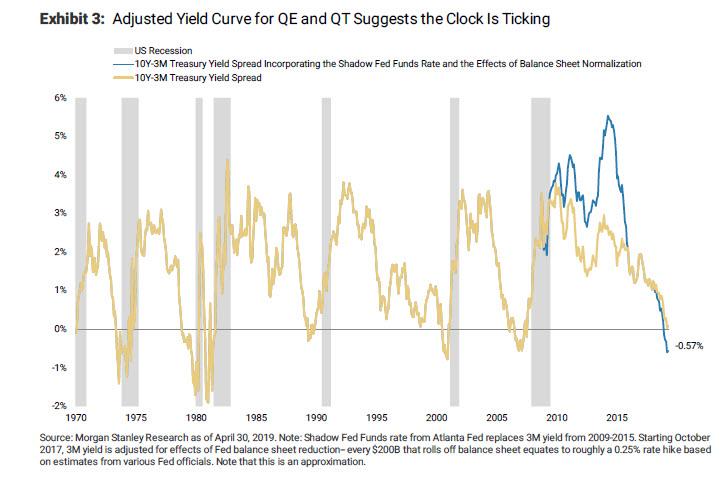
The light blue line is the unadjusted 10 year – 3 month yield curve and the dark blue line shows what it would look like fully adjusted for QE and QT. The adjusted curve shows record steepness in 2013 as the QE program peaked, which makes sense as it took record monetary support to get the economy going again after the great recession. The amount of flattening thereafter is commensurate with a significant amount of monetary tightening that is perhaps underappreciated by the average investor.
More importantly, unlike the unadjusted curve which only flipped negative in March, the adjusted yield curve inverted last November and has remained in negative territory ever since, surpassing the minimum time required for a valid meaningful economic slowdown signal. It also suggests the “shot clock” started 6 months ago, putting us “in the zone” for a recession watch, according to Wilson. As a result, Morgan Stanley thinks the bond market has it right to suggest the next move for the Fed will be a cut. Incidentally, the equity market is also right, given how defensively it has traded since last summer. Furthermore, the curve inverted about the same time the trade truce happened in late November and has stayed inverted despite all the positive rhetoric earlier this year around a trade deal. This means the US economic slowdown and rising recession risk is happening regardless of the trade outcome
Summarizing Wilson’s “adjusted yield curve” observations:
- The adjusted yield curve inverted last December rather than in March, and it’s remained well below 0% even since.
- It looks like it may be bottoming which is typically the beginning of the end for the economic cycle.
* * *
The third, and final point, may be of most significance to traders. Here, Wilson makes the controversial claim that whether or not an economic recession occurs in the US in the near term may not be the most important signal from the yield curve for investors. Why? Because, we are already in what will soon be revealed to be an especially volatile zone.
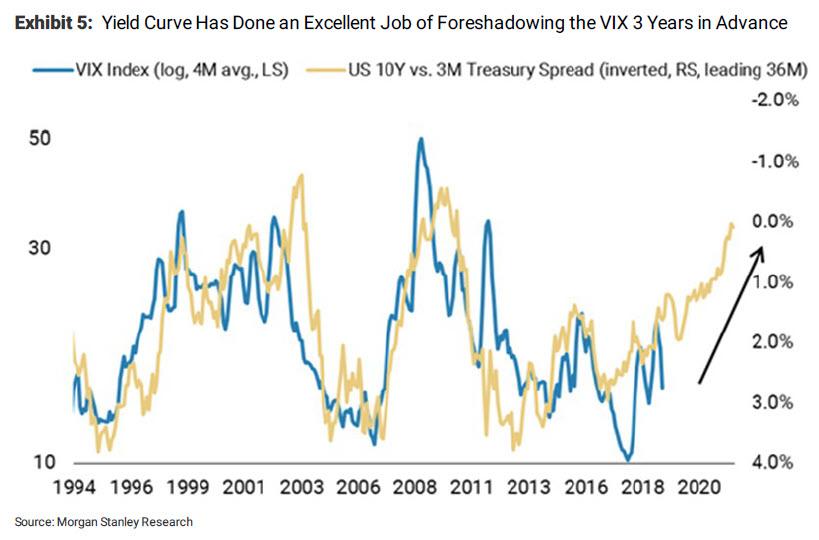
To be sure, we’ve shown the relationship between the yield curve and the lagged spot VIX on many times in the past, first in 2017. And now, according to Morgan Stanley, it’s time to look at it again (SocGen’s complaints about this correlation notwithstanding), because “the yield curve has done a remarkably good job of forecasting the direction of the VIX 3 years in advance until recently when it appears to have not predicted the severe decline in the VIX a few years ago.”
However, if analysts use the adjusted yield curve as revised above, its predictive power remains very much intact.
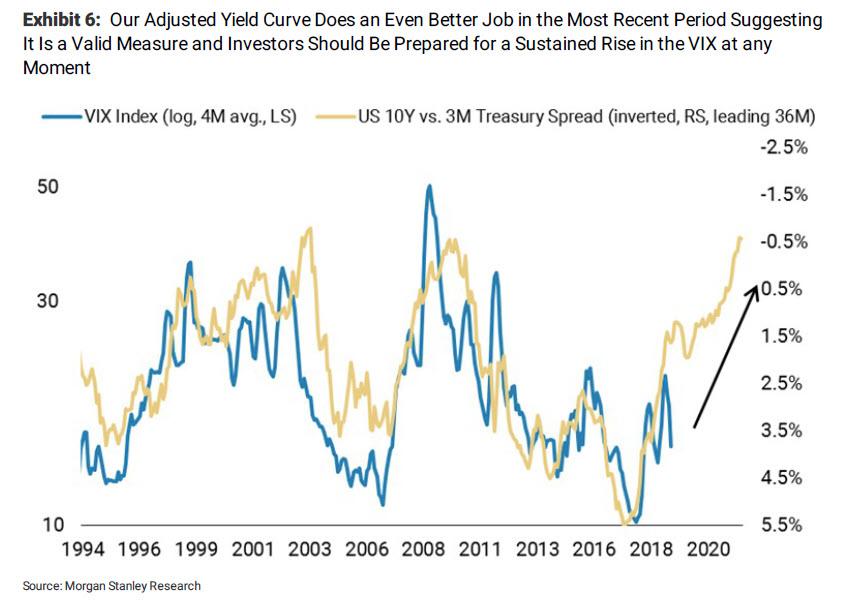
To Wilson this means two things:
- First, Morgan Stanley’s adjusted yield curve is right (over the objections of the peanut gallery), and
- Investors need to get ready for a potentially much higher level of equity volatility in the near term and on a sustained basis.
Incidentally, this is precisely the same conclusion that another Morgan Stanley strategist, Michael Zezas reached over the weekend, when he warned that if the trade war does not end soon, it will cause enough economic erosion to crash markets. Same conclusion, two different ways of getting there.
Wilson’s conclusion also touches on the recently discussed topic of differences and similarities between 2019 and 2018. Specifically, he says that “while last fall’s equity volatility was driven by higher rates, the next bout of equity volatility will be driven by weaker growth and earnings misses from stocks that are not priced for it.“
Finally, speaking of disappointing earnings, Wilson writes that contrary to incorrect reports that an earnings contraction was narrowly avoided in Q1, with 95% of S&P 500 companies done reporting we are on track to see 1Q earnings growth come in at -43 bps. And, as a reminder, a key part of Wilson’s call for 2019 is for an earnings recession which is defined as two or more quarters of flat or negative growth. Wilson’s conclusion:
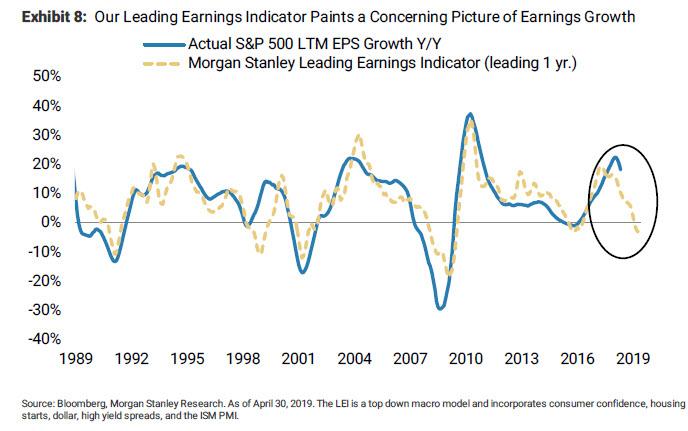
We think 1Q19 will mark the beginning of the earnings recession and think that full year 2019 earnings estimates still need to fall by 5-10 percent. A lot of the growth that is still expected for 2019 is being packed into the fourth quarter and that looks unrealistic to us, with or without a trade deal. We saw companies that did poorly in the first quarter hold on to strong fourth quarter guidance and maintain optimism. We don’t buy this story and our leading earnings indicator (LEI) is still pointing to a significant deceleration in earnings growth over the back half of the year.
In other words, the sequence of events is roughly as follows:
- Companies guide down sharply in the coming several weeks ahead of the second half as trade war escalated further
- (Adjusted) yield curve turns even more inverted.
- VIXplosion
via ZeroHedge News http://bit.ly/2Wxxgnq Tyler Durden