Former fund manager and FX trader Richard Breslow is worried. “Yesterday struck me as a potentially big deal for markets. And traders’ radars should be turned up high,” he warned in his note this morning.
His fear is that a whole host of assets are threatening to reverse their recent courses and are working in tandem to paint a new false picture. It doesn’t feel that way, at least not so far today, but keep an open mind. One cannot look at the price action without wondering which direction has been the move and which a correction.
Via Bloomberg,
The news isn’t getting any prettier. And it is impossible not to react to it. But it is hard to trade when the conflicting emotions of severe discomfort and hope seemingly reside so comfortably together. It isn’t even like we are getting risk-on and risk-off moves as the narratives shift. It’s more like, which side of investors’ brains manage to assert dominance on any given day.
The market seems to think that it will be business as usual prior to the G-20. And then we’ll see where we go from there. You can see that by looking at any number of implied volatility curves. That should be the base case for the world’s central bankers before they say anything that ends up sounding as if it was precipitous.
Citing global headwinds is a good place holder. But the real problem, and this applies all around, is that we have no way of knowing what will end up having been a bargaining chip and what a line in the sand. At the risk of making way too big a leap, which is the answer to that question kept coming to mind watching the utter mayhem in the streets of Hong Kong this morning over the extradition bill. And whether the primary actors will ultimately be able to control exactly which of their actions will end up in the intended category.
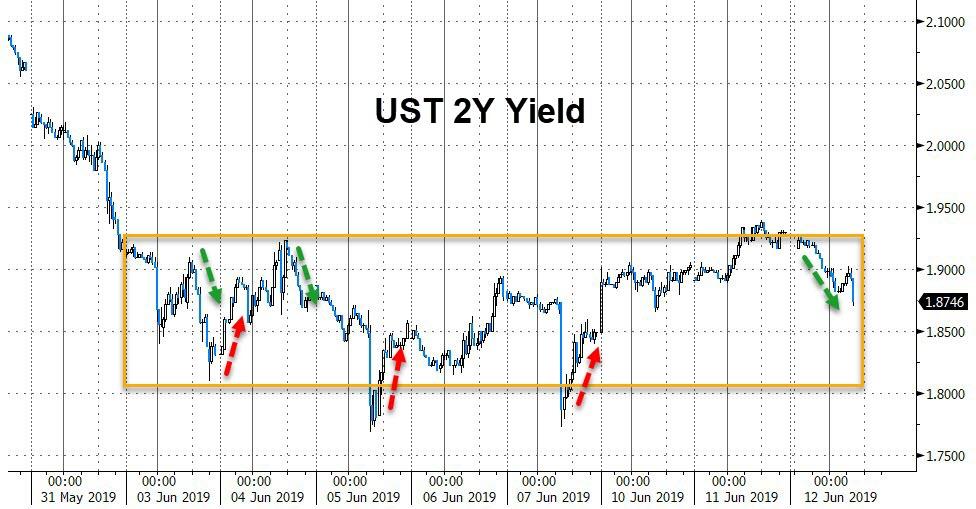
Treasury yields had been ticking up. The 10-year seemed to have convincingly rejected levels below 2.05% and, at yesterday’s high above 2.17%, looked like they wanted to try and keep going to test their breakdown level from the end of May.

That idea failed miserably and way too easily. Now traders are back to talking about what would come about should we make a new low for the cycle. And buying call options on the futures to see. The same is true for the two-year. In any case, did a market ever have more clearly defined support and resistance?
Equities, too, were doing a great imitation of looking like resistance would just be a minor irritant. And it was. Until it wasn’t. Right across the board. They certainly haven’t collapsed by any definition, but definitely have had the wind taken out of their sails. Suddenly, we are forced back to wondering whether the laggard Russell 2000 is the index that needs to be watched.
Or just keep it simple and see what the S&P 500 does with its pivot circa 2,900. It’s that close a touch. But keep in mind, they can fail here, go down a bunch and it will still qualify as a technical correction to the move since Christmas. But it won’t be fun.
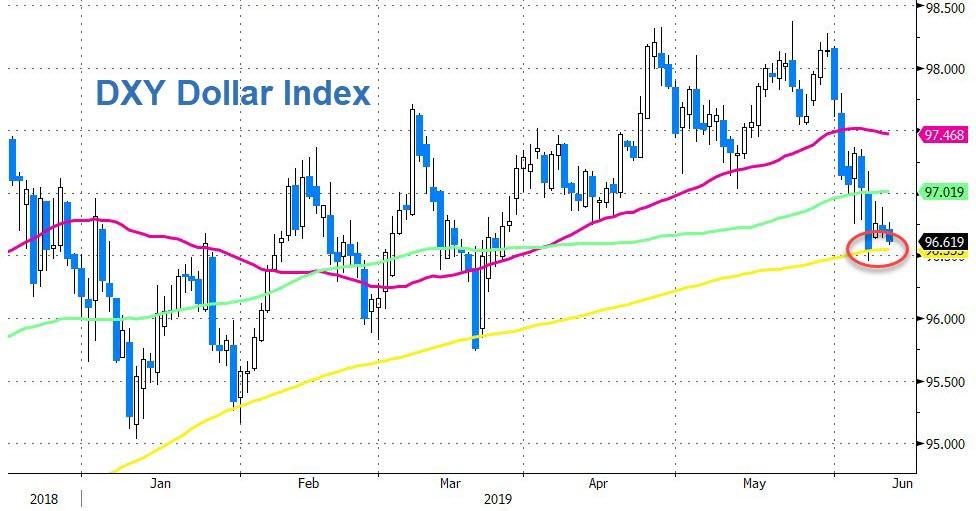
The dollar seems like the odd man out. It’s offered and has no shortage of detractors. But it has been holding support every time it probes lower and its demise is prematurely declared. You would have had to be an awfully motivated seller to be selling when DXY was near its intraday lows and sitting on support. Use the moving averages for a guide. On either side of the market. They’ve been good. Fibonacci is your friend.
Finally, as Northmantrader.com’s Sven Henrich notes, the last two days have seen something very unusual occur in price patterns.
While Monday’s shooting star was at risk of being invalidated with yesterday’s gap up and new highs there were a number of other indicators that suggested this price advance was not sustainable.
$SPX subsequently reversed red and made new lows compared to Monday.
This produced a candle known as a bearish engulfing candle. A classic definition:
“The bearish engulfing pattern consists of two candlesticks: the first is white and the second black. The size of the white candlestick is relatively unimportant, but it should not be a doji, which would be relatively easy to engulf. The second should be a long black candlestick. The bigger it is, the more bearish the reversal. The black body must totally engulf the body of the first white candlestick”
This is kind of your classic bearish engulfing candle pattern:

And this is what we ended up getting yesterday:
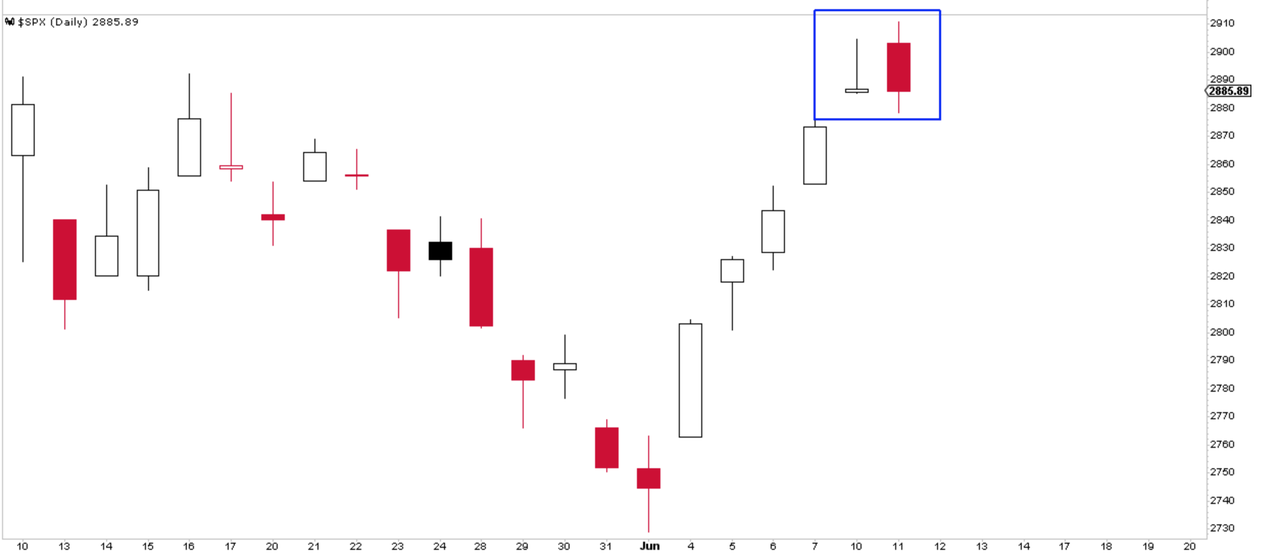
What’s frankly odd here is to see two distinct bearish candles back to back, a shooting star and then a bearish engulfing candle. I don’t recall ever seeing this specific combination. Maybe some other technicians can chime in here.
The technicals are trying to tell us something, BUT these types of candlesticks are not yet a confirmation!
Further weakness is required for bearish confirmation of this reversal pattern, i.e. a down day today, and, if it confirms, then, technically speaking, we can expect a lot more downside in the price action in the days ahead. But keep in mind, this market is very headline driven as we saw again last night. We’ll know more today.
via ZeroHedge News http://bit.ly/2WybX11 Tyler Durden