Authored by Sven Henrich via NorthmanTrader.com,
There are many market charts to track and most headlines are focused on the $DJIA, $SPX and $NDX, but there are other key index charts of interest, especially at this time. I call them the curious charts and both bulls and bears may want to keep a close eye on them.

Consensus is emerging that the Fed will cut rates at least by July although there are voices that suggest a surprise rate cut next week. The rush into stocks began last week as the Fed hinted at being open to rate cuts. Many are pointing out that in markets past initial rate cuts by the Fed, following a rate hike cycle, are bullish. At least initially.
That certainly was true during the two most recent cycles. 2000 and 2007. Both times rallies emerged following the initial rate cut, what then followed were recessions and vicious bear markets.
Here is $NDX highlighting the initial rate cut in January 2001:
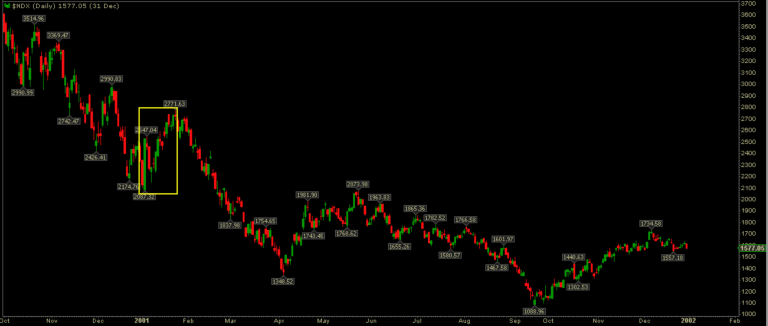
A steep rally that ended up being sold.
The Fed also cut rates in September 2007:
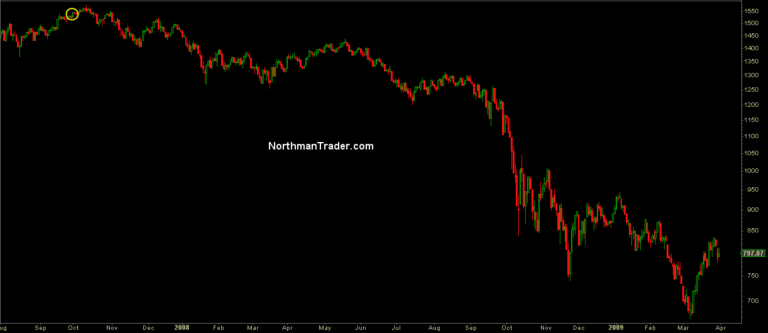
Moderate new highs occurred and then markets started selling off.
In both cases these initial rate cuts (both 50bp) were only the beginning of the journey. The Fed cut rates by more than 500bp in both cases. Why? Because that’s what it took to combat the recessions that ensued.
Currently the Fed only has 225bp to work with and markets are pricing in that the Fed will shower them with renewed rate cut manna from central bank heaven to inspire a new rally to new all time highs.
Since last week we’ve seen an aggressive rally in anticipation of precisely such an event. If not in June, but at least expecting anticipated language by the Fed next week to strongly hint at such a rate cut.
So what’s the problem then? Market volumes are really low at the moment and $SPX is lingering 2.3% from all time highs at the time of this writing. Happy days are here right and more gains are guaranteed no?
Maybe, maybe not.
In context of all this rallying, all this rate cut anticipation, all this jawboning (see also Larry Kudlow again today) four charts raise some curious questions.
Small caps ($RUT) keep lingering below key moving averages, the 50, the 100, the 200:
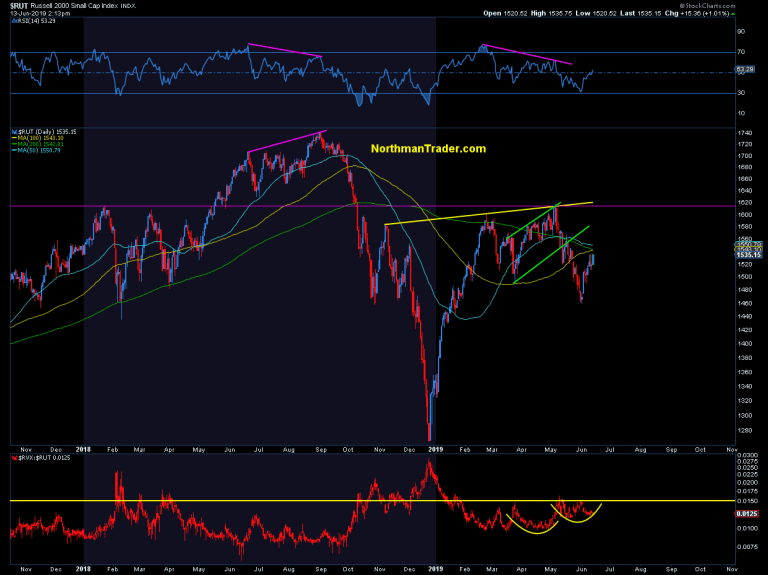
Without a sustained and confirmed break above these moving averages one can’t rally view this as a bullish chart. After all price has gone nowhere since December 2017. Maybe more easy money can change that. That’s at least what buyers here seem to assume. But for now the chart has not confirmed a bullish break above its MA resistance.
In addition its underlying volatility index $RVX) structure keeps showing a potential cup and handle suggesting a volatility outbreak is possible, but this also remains unconfirmed.
The $WLSH, the broadest index keeps struggling with is January 2018 highs, but also has recaptured its 50MA:
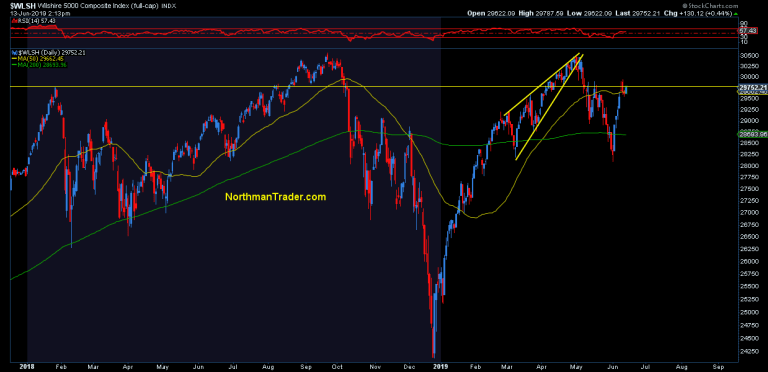
It’s a very tight price range in between these 2 pivots.
It may only take one gap up to move above the January 2018 highs again or one gap down to break below the 50MA.
Also struggling with its 2018 highs: $SOXX:
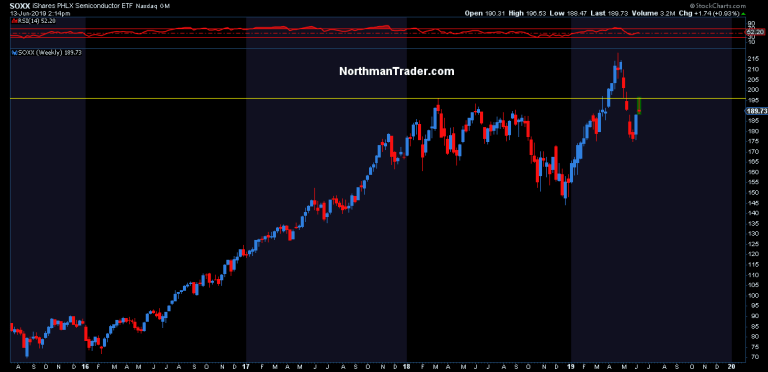
Last week’s rally brought it back to the 2018 highs, but it has since rejected again notably, leaving the earlier 2019 rally to new highs a fake breakout for now.
And finally $NYSE:
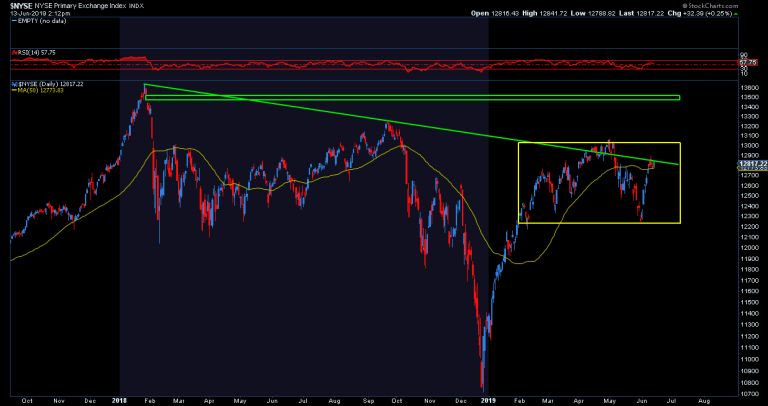
It’s been one of the weakest index charts since the January 2018 highs. Left a big open gap up there (which someday may become a target to fill), but has been making lower highs ever since. First in September 2018, then again in May this year before the latest correction.
In process it looked to break above its trend line, but the May correction brought it back below. Now with rate cuts expected $NYSE is right back at the trend line and just above its 50MA, similar to $WLSH in this regard.
Bottomline: All of these charts have one thing in common: The anticipation of coming rate cuts has brought them all to key technical pivot zones.
If price can confirm a move above these pivots bears may be sent on a quick chase into the wilderness, especially if the Fed gives bulls what they want, more bread and games.
Yet without a confirmed beak above, or a failed break above, one that does not sustain, bulls may find themselves rejected again, perhaps for a long time.
Don’t forget, the Fed cutting rates just 6/7 months after promising rate hikes is not a sign of strength, it’s a sign of a vastly and quickly changing reality.
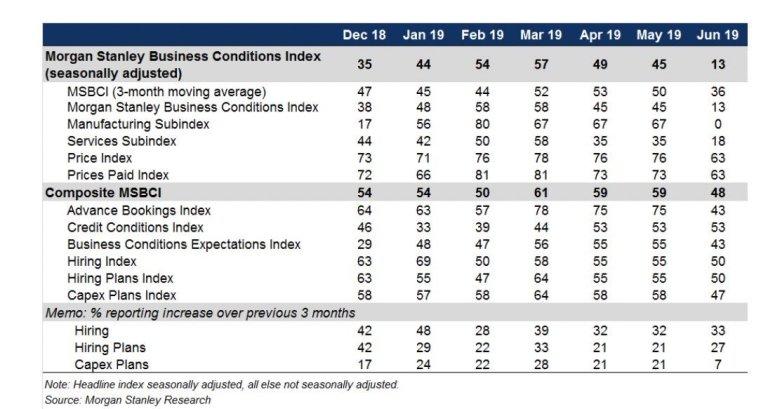
Per Morgan Stanley: “The Morgan Stanley Business Conditions Index collapsed by 32 points in June, the largest one-month decline on record, to a level of 13, a low since Dec 2008.”
If the Fed cuts here and now it’s not because they are confident even though they will want to project confidence because they must, it’s because they have completely misread the state of the larger economy, just like every economist has in 2019:
Hi I’m a professional Wall Street economist with a PhD . Now let me tell you where the 10 year is going. I’m here to help.
h/t @pcordway pic.twitter.com/8H10Bntu83— Sven Henrich (@NorthmanTrader) June 10, 2019
Everybody was wrong, but everybody is now right to chase stocks into rate cuts?
We’ll find out next week when the primary market price discovery mechanism, the Fed, enlightens us with their latest wisdom. In the meantime, watch those curious charts.
* * *
For the latest public analysis please visit NorthmanTrader. To subscribe to our market products please visit Services.
via ZeroHedge News http://bit.ly/2Zssl5l Tyler Durden