“When one buys life insurance, you don’t win when you die” – Harley Bassman
A few weeks ago, in his latest commentary, “Can’t You Hear Me Knocking” which we discussed here on the last day of May, the creator of the MOVE bond volatility index, noted “the strange configuration of the Yield Curve and how it likely presaged a macro-political or -economic disturbance.”
Since then, his view has not changed and while the exact timing and nature of a financial reversal is above his pay-grade, Bassman writes in his latest freebie note (now that he is retired, having quit PIMCO a few years ago), that historically such events occur about eighteen months after the first inversion: “as a rough prediction, I would target a date in mid-2020, serendipitously in the middle of the election cycle.“
With that in mind, Bassman – who for much of the 1990s and 2000s was seen as one of Wall Street’s most ingenious structured products traders – has published a report which details “a terrific strategic trading opportunity.” Alas, this is not for retail: as Bassman writes, “the structure of this investment involves a rather complex derivative product whose supporting concepts require a bit of concentration. Moreover, only professionals (or those with an ISDA) can execute this transaction – I apologize. If you have an interest in high-level finance, please continue; otherwise, save a tree and don’t print this commentary” (incidentally, he also discloses that has a position in this trade).
With that in mind, here is the trade that Bassman himself calls a “convexity monster.”
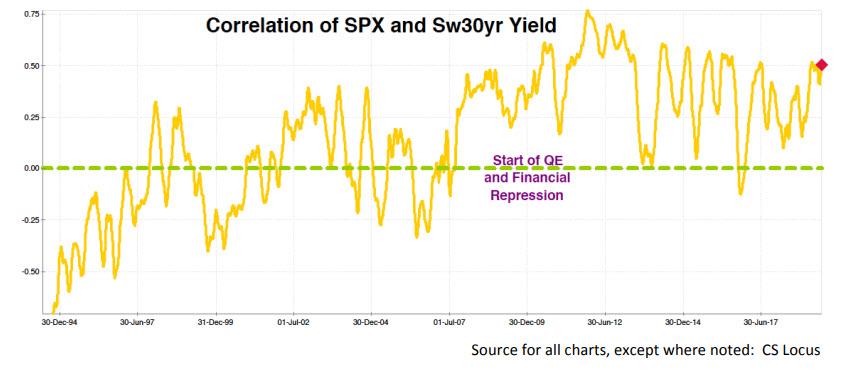
As I first detailed in “How Will I Know” – since the implementation of Quantitative Easing (QE) and Financial Repression as Great Financial Crisis (GFC) unfolded, stocks and bonds have moved in opposite directions. The line below is the three-month moving average of the three-month correlation between the SPX price change and the Sw30yr yield change.
(Note: this would be a negative correlation if we measured the price change of both stocks and bonds.)
What is curious is that despite a decade of moving in opposite directions, the prices of both the violent line- S&P 500 (SPX) and the red line, Thirty year UST bond, are approaching their all-time highs.
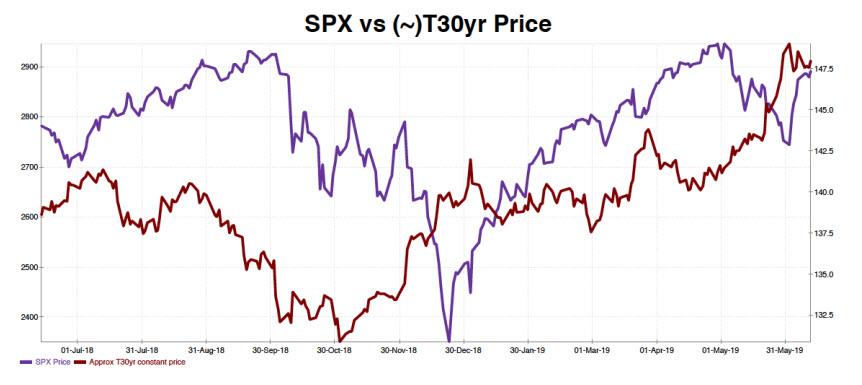
Setting aside the small detail that daily volatility offers sparse information about the final destination of an asset; clearly the Equity market did not receive the email from the Bond market that a storm is brewing. It is an interesting juxtaposition that short-term interest rates (the Reds) declined by 37bps in a week while the SPX closed last Friday a mere 2% below its forever peak.
A quick glance at the table below might offer becalming comfort since the one-year rate of 2.08% is almost equal to the ten-year rate of 2.035%.

Yet a closer look of forward two-year swap rates highlight a deep contortion in the belly of the Yield Curve.

To spare your eyes, while the effective Fed Funds rate is presently 2.375%, the two-year swap rate is 51.7bp lower at 1.858%; and as will be important soon, the two-year rate six months forward is 1.696%, or 16.2bps lower.
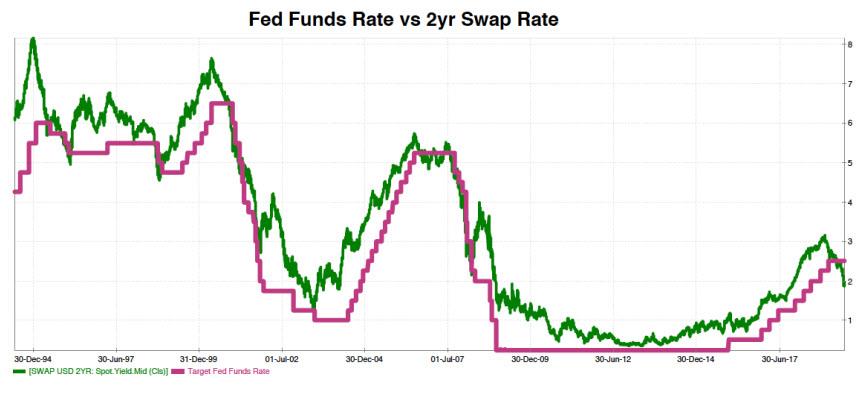
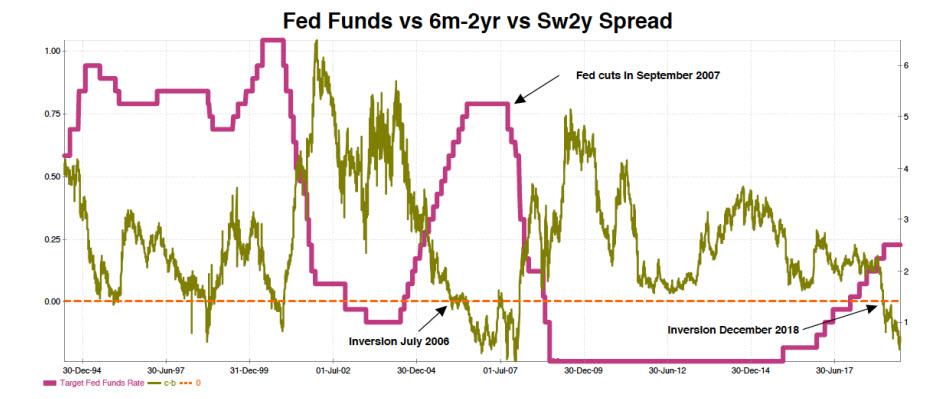
Let’s pause for moment and consider why the relationship between the Fed’s Target rate and the two-year rate is important. Below, the green line is the two-year swap rate while the pink line is the effective Fed Funds rate; this difference is generally a positive spread.
For clarity, the orange line is this spread. Since 1994, it has averaged about 74bps, and since the start of the GFC, the gap has been about 62bp
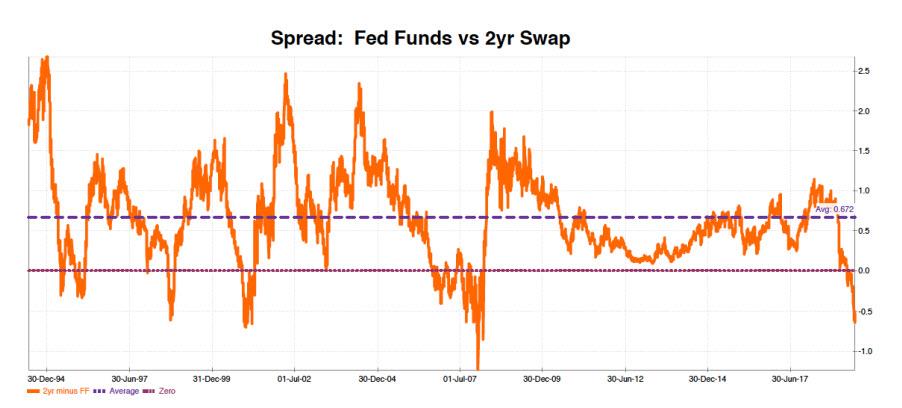
Employing only grade school math, a reversion to the decade average would entail the need for the Federal Reserve to cut its target rate five times in 25bp increments by the end of the year. [1.696% minus 62bp equals 1.076%; and 2.375% minus 1.076% equals ~130bps]
Unless you are a newbie, you know my favorite saying is: “It’s never different this time”. And indeed, the green lin- forward spread does invert prior to green line representing Fed rate cuts. However, one might note it is not an instantaneous event. In the last rate cut cycle, this spread inverted in July 2006 yet Fed rate cuts did not commence until 14 months later in September 2007.
The bottom line is not that the bond market is wrong, rather only a bit too early. It could be fears of a Trade War or an Immigration meltdown, or perhaps twitter has finally become fully weaponized. In any event, except for interest rates, fundamental economics presently do not support an immediate rate cut by a “data dependent Fed”; and certainly not four rate cuts by December.
If you have read this far, it is time for your reward…. (Hat tip to my friends at MS)
As noted, the two-year forward swap rate is 1.696%, 16.2bps below the spot rate. If one believes rate cuts will not be as speedy or as often as implied by market rates, the simple ticket is to short the forward and earn the 31cents of “roll up carry” as the forward grinds up to the spot.
I don’t like this trade because of the potential for unlimited loss. Of course the easy alternative is to buy a six-month expiry payer swaption (similar to a put option on the UST two-year note), but this option would cost about 46 cents upfront, a fee greater than the pure carry of 31cents.
Another way to reduce the price is via an option spread. One could buy an at-the-money (ATM) option struck at 1.696% and sell an option struck 25bps (1.946%) or 50bps (2.196%) OTM for a total net cost of 26cents and 36cents respectively. This is better, but the fee still eats up the carry profits.
Here is the clever idea:
Buy the ATM option struck at 1.696% and sell the 50bp out-of-the-money option struck at 2.196%
But: Make it contingent upon the SPX being 5% lower than today’s price. This reduces the cost by 78% to only 8cents.
If the rates market is unchanged, and the SPX backs up by 5% to 2743, this position would produce a 3.75x pay out. And if the bond market realizes it is over its skis and spot rates increase just a bit, the pay out can be much higher.
The hook is that you need to have some confidence that stocks can decline over the next six months, without rates sinking further. While I am not a super bear, a small pull back is more than just possible. Corporations purchasing their own stock have been largest buyers of equities, and this buying has just passed its seasonal peak. Also, the recent rate move may shake out out a few sellers who want to cash in their chips before election politics begins to heat up.
I absolutely love this trade as it offers a near-the-money option at the price of a tail hedge. Moreover, it is well suited for any portfolio that is constructed to use interest rate risk to partially offset equity risk. (Clever eyes will notice that Closed-end Funds, which I own in abundance, exhibit this sort of exposure.)
The massive discount of this Hybrid option is sourced from the high correlation between rates and stocks, as described above. This trade is effectively a sale of that correlation.
There is no free lunch, but I have a 16.2bps wind at my back via the curve inversion, and the SPX is near its local top. If I am right, this is a convexity monster; and you know I love that.
via ZeroHedge News http://bit.ly/2IH09Gd Tyler Durden