Authored by Lance Roberts via RealInvestmentAdvice.com,
A fascinating graphic was recently produced by Oxford Economics showing compounded economic growth rates over time.

What should immediately jump out at you is that the compounded rate of growth of the U.S. economy was fairly stable between 1950 and the mid-1980s. However, since then, there has been a rather marked decline in economic growth.
The question is, why?
This question has been a point of a contentious debate over the last several years as debt and deficit levels in the U.S. have soared higher.
Causation? Or Correlation?
As I will explain, the case can be made the surge in debt is the culprit of slowing rates of economic growth. However, we must start our discussion with the Keynesian theory, which has been the main driver both of fiscal and monetary policies over the last 30-years.
“Keynes contended that ‘a general glut would occur when aggregate demand for goods was insufficient, leading to an economic downturn resulting in losses of potential output due to unnecessarily high unemployment, which results from the defensive (or reactive) decisions of the producers.’
In such a situation, Keynesian economics states that government policies could be used to increase aggregate demand, thus increasing economic activity and reducing unemployment and deflation. Investment by government injects income, which results in more spending in the general economy, which in turn stimulates more production and investment involving still more income and spending. The initial stimulation starts a cascade of events, whose total increase in economic activity is a multiple of the original investment.”
Keynes’ was correct in his theory. In order for deficit spending to be effective, the “payback” from investments being made must yield a higher rate of return than the debt used to fund it.
The problem has been two-fold.
First, “deficit spending” was only supposed to be used during a recessionary period, and reversed to a surplus during the ensuing expansion. However, beginning in the early ’80s, those in power only adhered to “deficit spending part” after all “if a little deficit spending is good, a lot should be better,” right?
Secondly, deficit spending shifted away from productive investments, which create jobs (infrastructure and development,) to primarily social welfare and debt service. Money used in this manner has a negative rate of return.
According to the Center On Budget & Policy Priorities, roughly 75% of every tax dollar goes to non-productive spending.

Here is the real kicker. In 2018, the Federal Government spent $4.48 Trillion, which was equivalent to 22% of the nation’s entire nominal GDP. Of that total spending, ONLY $3.5 Trillion was financed by Federal revenues and $986 billion was financed through debt.
In other words, if 75% of all expenditures is social welfare and interest on the debt, those payments required $3.36 Trillion of the $3.5 Trillion (or 96%) of revenue coming in.
Do you see the problem here? (In the financial markets, when you borrow from others to pay obligations you can’t afford it is known as a “Ponzi-scheme.”)
Debt Is The Cause, Not The Cure
This is one of the issues with MMT (Modern Monetary Theory) in which it is assumed that “debts and deficits don’t matter” as long as there is no inflation. However, the premise fails to hold up when one begins to pay attention to the trends in debt and economic growth.
I won’t argue that “debt, and specifically deficit spending, can be productive.” As I discussed in American Gridlock:
“The word “deficit” has no real meaning. Dr. Brock used the following example of two different countries.
Country A spends $4 Trillion with receipts of $3 Trillion. This leaves Country A with a $1 Trillion deficit. In order to make up the difference between the spending and the income, the Treasury must issue $1 Trillion in new debt. That new debt is used to cover the excess expenditures, but generates no income leaving a future hole that must be filled.
Country B spends $4 Trillion and receives $3 Trillion income. However, the $1 Trillion of excess, which was financed by debt, was invested into projects, infrastructure, that produced a positive rate of return. There is no deficit as the rate of return on the investment funds the “deficit” over time.
There is no disagreement about the need for government spending. The disagreement is with the abuse, and waste, of it.”
The U.S. is Country B.
Increases in the national debt have long been squandered on increases in social welfare programs, and ultimately higher debt service, which has an effective negative return on investment. Therefore, the larger the balance of debt becomes, the more economically destructive it is by diverting an ever growing amount of dollars away from productive investments to service payments.
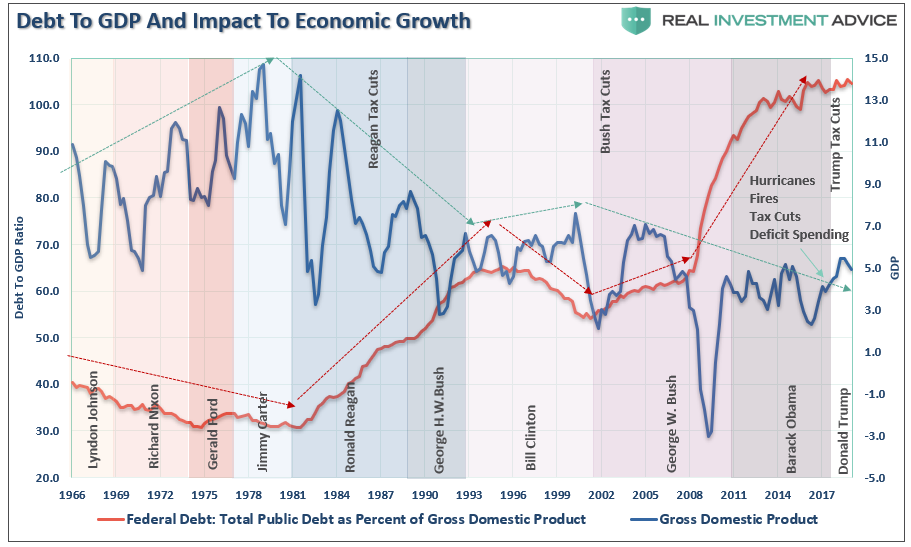
The relevance of debt versus economic growth is all too evident, as shown below. Since 1980, the overall increase in debt has surged to levels that currently usurp the entirety of economic growth. With economic growth rates now at the lowest levels on record, the growth in debt continues to divert more tax dollars away from productive investments into the service of debt and social welfare.
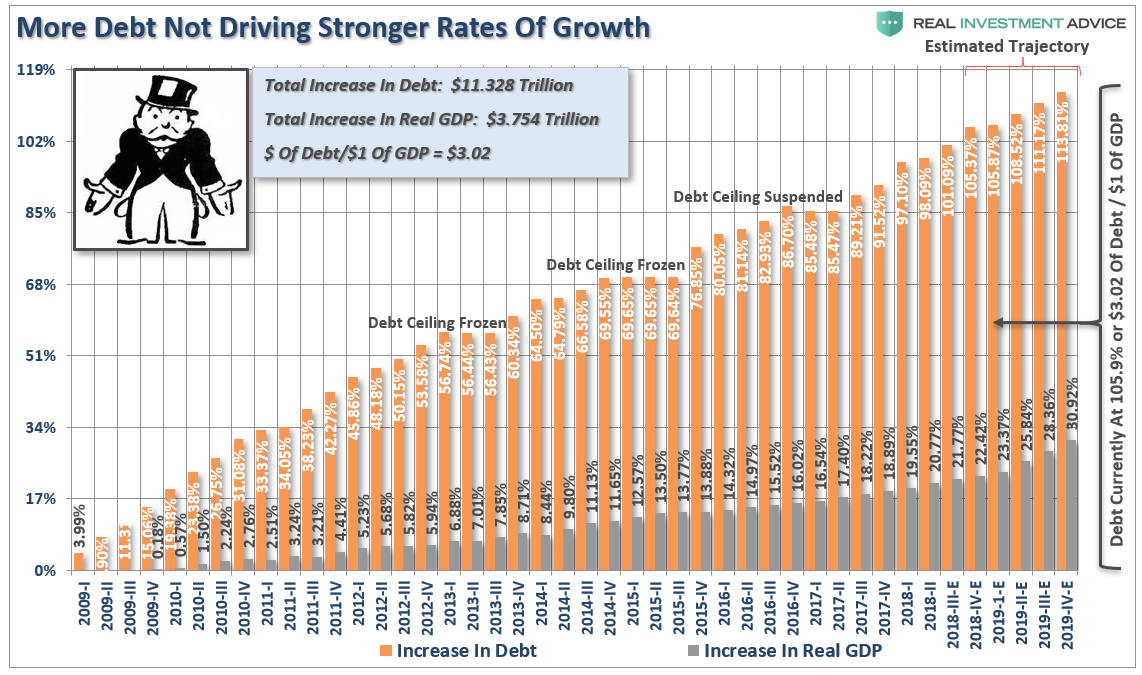
The irony is that debt driven economic growth, consistently requires more debt to fund a diminishing rate of return of future growth. It now requires $3.02 of debt to create $1 of real economic growth.
However, it isn’t just Federal debt that is the problem. It is all debt.
When it comes to households, which are responsible for roughly 2/3rds of economic growth through personal consumption expenditures, debt was used to sustain a standard of living well beyond what income and wage growth could support. This worked out as long as the ability to leverage indebtedness was an option. Eventually, debt reaches levels where the ability to consume at levels great enough to foster stronger economic growth is eroded.
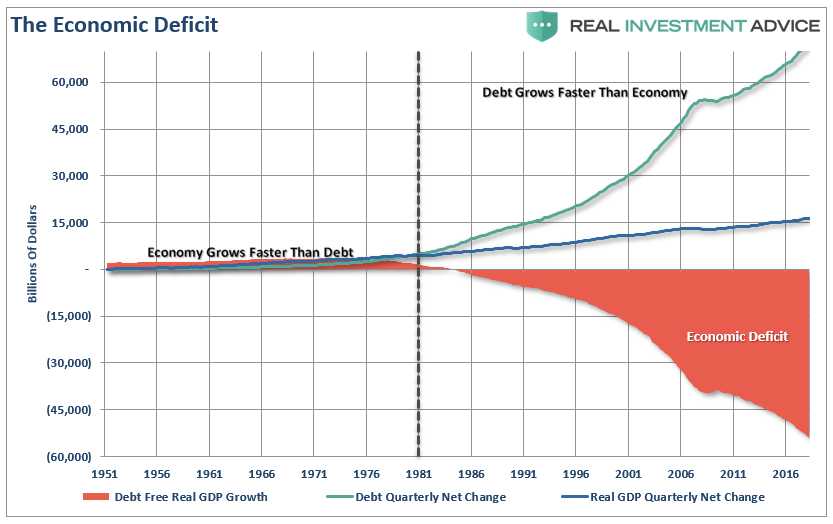
For the 30-year period from 1952 to 1982, debt-free economic growth was running a surplus. However, since the early 80’s, total credit market debt growth has sharply eclipsed economic growth. Without the debt to support economic growth, there is currently an accumulated deficit of more than $50 Trillion.
What was the difference between pre-1980 and post-1980?
From 1950-1980, the economy grew at an annualized rate of 7.70%. This was accomplished with a total credit market debt to GDP ratio of less 150%. The CRITICAL factor to note is that economic growth was trending higher during this span going from roughly 5% to a peak of nearly 15%.
There were a couple of reasons for this.
-
Lower levels of debt allowed for personal savings to remain robust which fueled productive investment in the economy.
-
The economy was focused primarily on production and manufacturing which has a high multiplier effect on the economy.
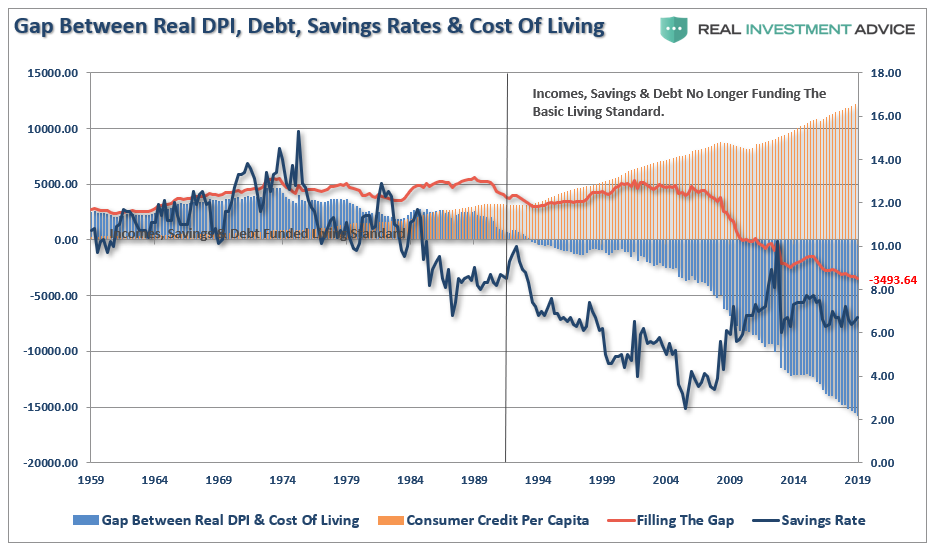
The obvious problem is the ongoing decline in economic growth. Over the past 35 years, slower rates of growth has kept the average American struggling to maintain their standard of living. As wage growth stagnates, or declines, consumers are forced to turn to credit to fill the gap in maintaining their current standard of living. (The chart below is the inflation-adjusted standard of living for a family of four as compared to disposable personal incomes and savings rate. The difference comes from debt which now exceeds $3400 per year.)
It isn’t just personal and corporate debt either. Corporations have also gorged on cheap debt over the last decade as the Fed’s “Zero Interest Rate Policy” fostered a scramble for cash for diminishing investment opportunities, such as share buybacks. These malinvestments ultimately have a steep payback.
We saw this movie play out “real-time” previously in everything from sub-prime mortgages to derivative instruments. Banks and institutions milked the system for profit without regard for the risk. Today, we see it again in non-financial corporate debt. To wit:
“And while the developed world has some more to go before regaining the prior all time leverage high, with borrowing led by the U.S. federal government and by global non-financial business, total debt in emerging markets hit a new all time high, thanks almost entirely to China.”
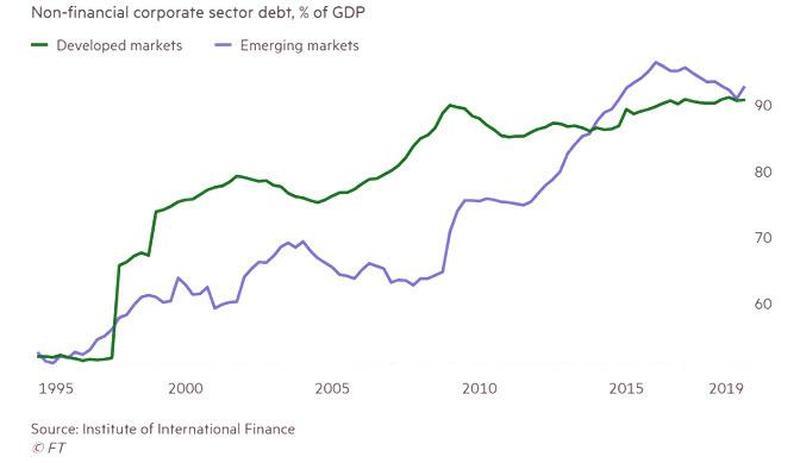
“Chinese corporations owed the equivalent of more than 155% of Global GDP in March, or nearly $21 trillion, up from about 100% of GDP, or $5 trillion, two decades ago.”
The Debt End Game
Unsurprisingly, Keynesian policies have failed to stimulate broad based economic growth. Those fiscal and monetary policies, from TARP, to QE, to tax cuts, only delayed the eventual clearing process. Unfortunately, the delay only created a bigger problem for the future. As noted by Zerohedge:
“The IIF pointed out the obvious, namely that lower borrowing costs thanks to central banks’ monetary easing had encouraged countries to take on new debt. Amusingly, by doing so, this makes rising rates even more impossible as the world’s can barely support 100% debt of GDP, let alone 3x that.”
Ultimately, the clearing process will be very substantial. As noted above, with the economy currently requiring roughly $3 of debt to create $1 of economic growth, a reversion to a structurally manageable level of debt would involve a nearly $40 Trillion reduction of total credit market debt from current levels.

This is the “great reset” that is coming.
The economic drag from such a reduction in debt would be a devastating process. In fact, the last time such a reversion occurred, the period was known as the “Great Depression.”

This is one of the primary reasons why economic growth will continue to run at lower levels going into the future. We will witness an economy plagued by more frequent recessionary spats, lower equity market returns, and a stagflationary environment as wages remain suppressed while cost of living rise.
The problem of debt will continue to be magnified by the changes in structural employment, demographics, and deflationary pressures derived from changes in productivity. As I showed previously,this trend has already been in place for the last decade and will only continue to confound economists in the future.
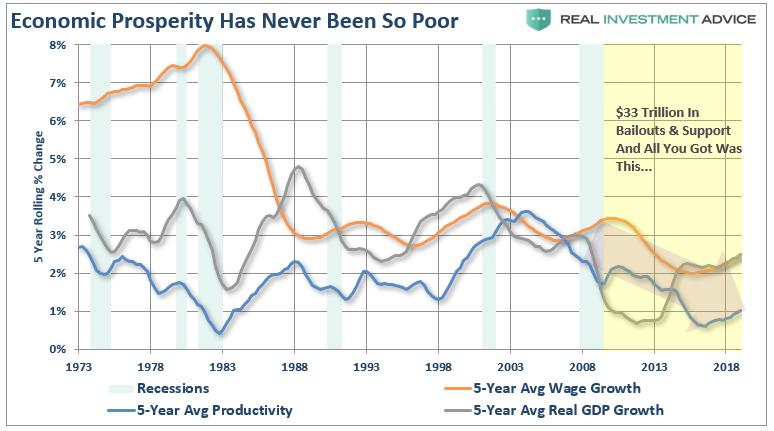
“The U.S. is currently running at lower levels of GDP, productivity, and wage growth than before the last recession. While this certainly doesn’t confirm Shelton’s analysis, it also doesn’t confirm the conventional wisdom that $33 Trillion in bailouts and liquidity, zero interest rates, and surging stock markets, are conducive to stronger economic growth for all.”
Correlation or causation? You decide.
via ZeroHedge News https://ift.tt/30KPQqV Tyler Durden