Now that the Fed is once again extremely sensitive to incoming data – or at least that’s what the market thinks – and especially bad incoming data as today’s disappointing ISM demonstrated, which sent stocks surging on hopes of more rate cuts (at least until Trump’s subsequent tariff shocker), tomorrow’s payrolls report is suddenly extremely important for the Fed’s reaction function: a strong beat has the potential to crush stocks and send yields sharply higher, and of course, vice versa. That said, a beat to the relatively modest consensus expectation of 165K is virtually assured due to the wildcard that is census hiring which will be between 10K and 50K, and which the BLS will surely fully milk following political instructions from “above.”
So with that in mind, here is a summary of what consensus expects tomorrow, courtesy of RanSquawk:
US nonfarm payrolls are seen coming in at 165k in July, a reading which would push the three-month average down to 153k from 171k in June. The jobless rate is seen unchanged at 3.7%, though the Conference Board’s consumer confidence data does signal some potential downside. We have seen only a partial slate of business surveys ahead of the NFP report, and they seem to signal some cooling in labour market momentum.
EXPECTATIONS:
- Non-farm Payrolls: Exp. 165k, Prev. 224k.
- Unemployment Rate: Exp. 3.7%, Prev. 3.7%. (FOMC currently projects 3.6% unemployment by the end of 2019, and 4.2% in the longer-run).
- U6 Unemployment Rate: Prev. 7.2%.
- Labour Force Participation: Prev. 62.9%.
- Avg. Earnings Y/Y: Exp. 3.1%, Prev. 3.1%;
- Avg. Earnings M/M: Exp. +0.2%, Prev. +0.2%.
- Avg. Work Week Hours: Exp. 34.4hrs, Prev. 34.4hrs.
- Private Payrolls: Exp. 160k, Prev. 191k; Manufacturing Payrolls: Exp. 5k, Prev. 17k; Government Payrolls: Prev. 33k
The Street expects 164k nonfarm payrolls will be added to the US economy in July, following 224k in June (12-month trend rate is 192k). Fed Chair Powell looks at a three-month rolling average of headline payrolls, which after the upside in June, is running at a clip of 171k, and has been ticking higher for three straight months — a consensus 164k in July would knock the three-month average back to 153k.
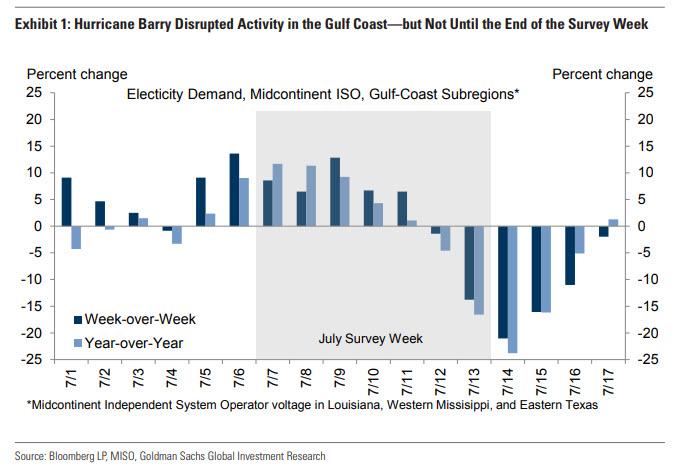
Looking at just one bank’s forecasts, Goldman estimates nonfarm payrolls increased 190k in July, 25k above consensus of +165k. While July employer surveys declined on net, jobless claims and job availability measures remain at very strong levels, and we also expect a boost from Census hiring worth 10-20k. Additionally, Hurricane Barry struck the Gulf Coast too late in the survey week to have a significant impact on the report.
JOBLESS CLAIMS:
Weekly claims data within the survey periods is unchanged on June, suggesting some stability; initial jobless claims were 216k in the 13th July week vs 217k in the 15th June week; for reference the four-week moving average was also stable, falling slightly from 219k to 218.75k.
BUSINESS SURVEYS:
Ahead of this month’s payrolls report, we do not have the release of the non-manufacturing ISM. The manufacturing ISM did not bode well for the labour market data, with the employment sub-index falling more than expected, to 51.7 from 54.5. This theme was also seen in the final Markit manufacturing PMI data for July, where the employment index cooled to 49.8 from 50.8 in June (entering contraction territory) (NOTE: the flash reading showed a print of 49.6, which was the lowest since the GFC, which Capital Economics says was consistent with the manufacturing sector shedding 30k jobs per month). The services equivalent reports have not been released ahead of this month’s payrolls data.
CONSUMER SURVEYS:
The differential between ‘jobs plentiful’ and ‘jobs hard to get’ within the Conference Board’s Consumer Confidence data rose to 35.4 from 27.6, auguring well for downside in the unemployment rate (analysts note the long-term correlations are decent). The metric was also encouraging since, in June, it declined from a cyclical high suggesting some cooling in labour market momentum. The CB also noted that consumers’ outlook for the labour market was more upbeat in the month, with the proportion expecting more jobs in the months ahead rising from 17.5% to 20.5%, while those anticipating fewer jobs decreased from 13.9% to 11.5%. The CB also said that, in terms of short-term income prospects, the percentage of consumers expecting an improvement rose from 20.5% to 24.7%, while the proportion expecting a decrease declined from 7.5% to 6.3%. RBC cautions, however, that that potential job growth (proxied by the growth in the labor force) slowed in the last 12 months to just 71k, and accordingly, the bar to continue seeing lower rates of unemployment is low.
CHALLENGER:
The pace of announced job cuts eased in July; the headline was 38,845 versus the 41,977 in June, Challenger said, marking the second consecutive drop in monthly job cut announcements since May, and the lowest total since August 2018. “The US is enjoying the longest economic expansion in American history and the June jobs report documented a decidedly strong labor market,” Challenger wrote, “however, slowing GDP growth in the second quarter, cuts in business investment, and trade tensions led the Federal Reserve to cut its key interest rate by a quarter-point. This move signals trouble on the horizon for the current economic cycle.” It notes that employment tends to be a lagging indicator, as companies often keep hiring up to the edge of a recession, but right now, the labour market is strong. “Employees can continue to anticipate moderate wage growth and advantageous employment prospects for the time being.” Challenger noted that manufacturers were not faring particularly well, not only by shifting consumer behaviour and automation, but also by the imposed tariffs.
ARGUING FOR A STRONGER REPORT:
- Jobless claims. Initial jobless claims remained unchanged at very low levels during the four weeks between the payroll reference periods (at 219k on average). Continuing claims declined from survey week to survey week for the first time in three months (-17k to 1677k).
- Job availability. The Conference Board labor market differential—the difference between the percent of respondents saying jobs are plentiful and those saying jobs are hard to get—rebounded by 5.2pt to +33.4 in July, just below the cycle-high. Other job availability readings are somewhat backward-looking at this point, but were somewhat softer on a sequential basis: JOLTS job openings declined but remained high (-49k to 7,323k in May) and the Conference Board’s Help Wanted Online index edged lower (-0.2pt to 102.4 in June).
- Census hiring. Temporary employment related to the 2020 Census has significantly lagged that of 1999 and 2009. However, address canvassing scheduled for August will require tens of thousands of temporary workers to be hired and trained. Given this and given that the 200+ regional Census offices were opened in late June, expect a visible boost from Census hiring in tomorrow’s report (Goldman assume 10-20k workers).
- Public Education. We believe some of the 20k decline in public education payrolls over the last two months will reverse in tomorrow’s report. Employment in this industry is highly mean-reverting at the end of the school year, and the May/June declines reflected seasonal adjustment issues as opposed to legitimate labor shedding at state colleges and universities.
ARGUING FOR A WEAKER REPORT:
- Hurricane Barry. While Hurricane Barry caused power outages for more than 120k households in Louisiana and other parts of the Gulf Coast, the storm did not make landfall until Friday and Saturday of the payroll survey week. Workers are counted as employed in the establishment survey unless they miss work for the entire payroll reference period. And as shown in Exhibit 1—which plots electricity usage in the areas affected—disruptions during the workweek itself appear minimal. Accordingly, economists do not expect a meaningful impact of the storm in tomorrow’s report.
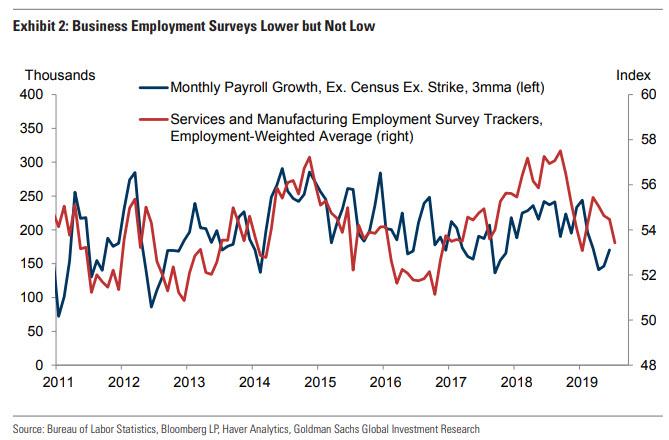
- Employer surveys. Business activity business surveys were sequentially firmer in July (with small net gains in the manufacturing sector and a moderate increase in the services sector), but the employment components of those surveys underperformed (-1.2pt to 52.3 for manufacturing, -0.9pt to 53.5 for services). As shown in Exhibit 2, however, the level of the labor-market components still suggests job growth running at a healthy pace (of around 175k per month). Service-sector job growth rose 154k in June and averaged 134k over the last six months, while manufacturing payroll employment rose 17k in June and has increased by 8k on average over the last six months.
NEUTRAL FACTORS:
ADP. The payroll-processing firm ADP reported a 156k increase in July private employment, slightly above consensus and a sizeable pickup from the 112k pace it reported in June. The ADP report was slightly firmer than our previous assumptions—and in our view suggests that the underlying pace of job growth remains solid.
Job cuts. Announced layoffs reported by Challenger, Gray & Christmas remained unchanged in July at 47k (SA by GS), but are still somewhat above their July 2018 level (+15k yoy). A retracing of announced layoffs in the automotive industry (-6k mom sa) roughly offset a rise in the transportation industry (+4k) and smaller increases in other industries.
WAGES:
Finally, the other critical data point that could have an outsized impact on risk assets is a hotter than expected wage print: Analysts at Bank of America see average wages growing +0.3% M/M, which is firmer than the consensus view; the bank says this will also push the annualised measure to 3.2% Y/Y. The bank sees average weekly hours worked to remain unchanged at 34.4hrs. Goldman estimate average hourly earnings increased 0.2% month-over-month, with the
year-over-year rate a tad below that of BofA and in line with consensus, at 3.1%. The forecast reflects unfavorable calendar effects (survey week ended the 13th of the month) but a boost from a further rebound in supervisory earnings—which are underperforming the production worker subset by two tenths on a year-on-year basis (+3.14% vs. +3.35% in June). A monthly increase of 0.3% or 0.4% or an annual increase of 3.3% or more, and risk assets will find themselves in a world of pain.
via ZeroHedge News https://ift.tt/335rFVT Tyler Durden

