Authored by Sven Henrich via NorthmanTrader.com,
Time for a technical update on Bitcoin. In May in Bitcoin Resurgence, when Bitcoin was trading at just below $8000, I offered a technical analysis that outlined a potential move toward the 11,600 area by the end of August. Bitcoin being bitcoin exceeded that target sooner and hit the 13,300 area in June, subsequently corrected and retraced back to below 10,000 and now is trading, as of this writing at around 11,900, basically in the price range I outlined in May.

Let’s revisit the chart with an updated view.
Firstly: When I see an instrument act very technically I pay attention and that run toward the 13,300 area (and subsequent reversal) was no accident. It hit a very specific technical point: The .618 fib. It was clean, precise and produced a sizable technical reaction, I noted it back then:
If you’re looking for a technical explanation:$BTC hit its .618 fib today and is rejecting from there pic.twitter.com/aBADuzeUN3
— Sven Henrich (@NorthmanTrader) June 26, 2019
I respect technicals greatly and we see them working cleanly in a number of asset classes.
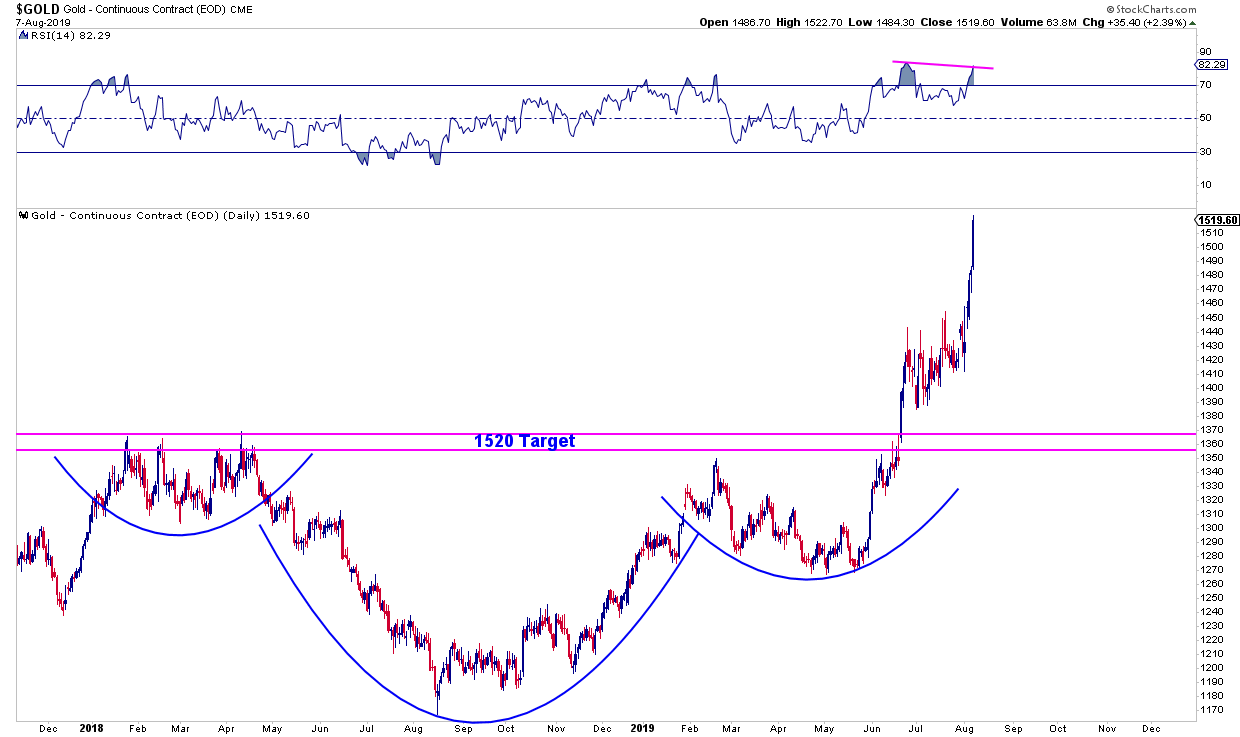
A great example is the recent Gold Going Bull Case we also made in May. Outlined a $1520 target when it was trading at $1277:
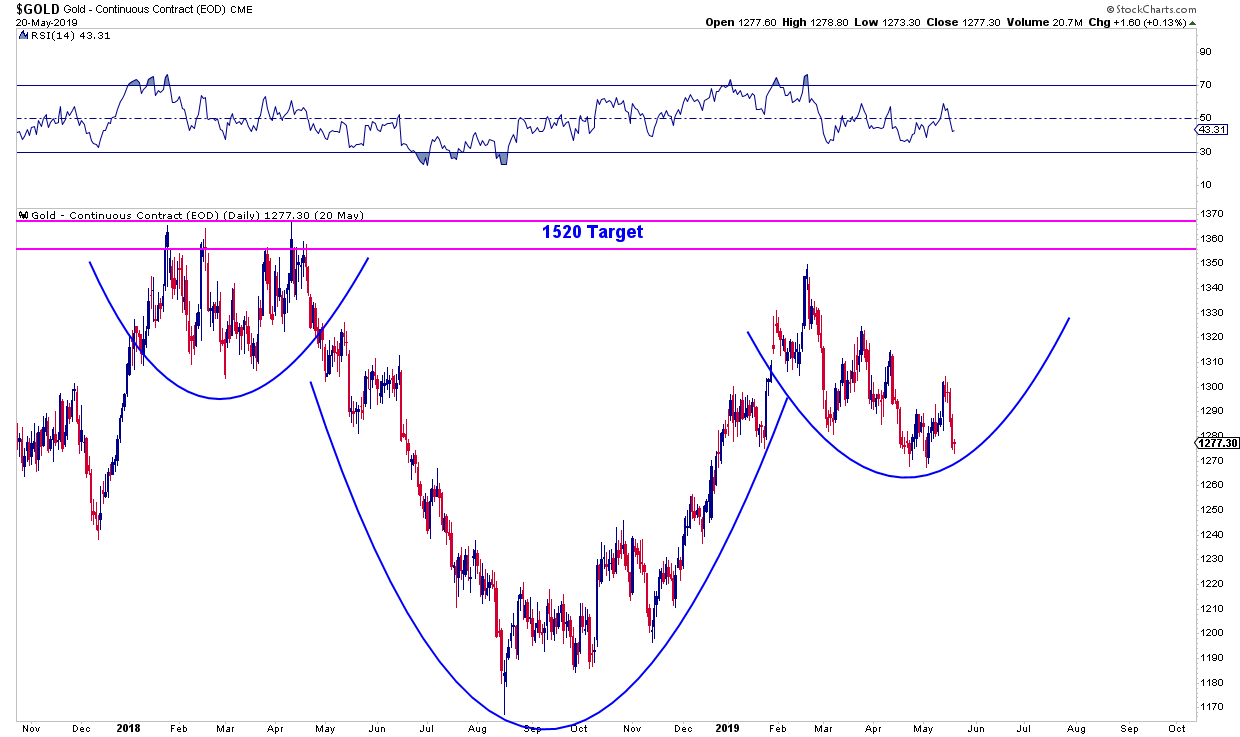
Yesterday Gold hit that target precisely:
So technicals are working greatly in key asset classes. When bitcoin first arrived it was always a question whether this new instrument would respect technicals and from what I’m seeing it does.
Indeed that big bear move in 2018 produced a large falling bullish wedge, it broke above this falling wedge and has been on a run since then. That’s a clean bullish breakout and the wedge is so large it has a lot of potential higher.
But nothing goes up or down in a straight line, even in the Gold chart you see recent consolidation in the 1400 area following the initial break above the inverse neckline.
So what’s bitcoin doing now?
It’s been building a bull flag:
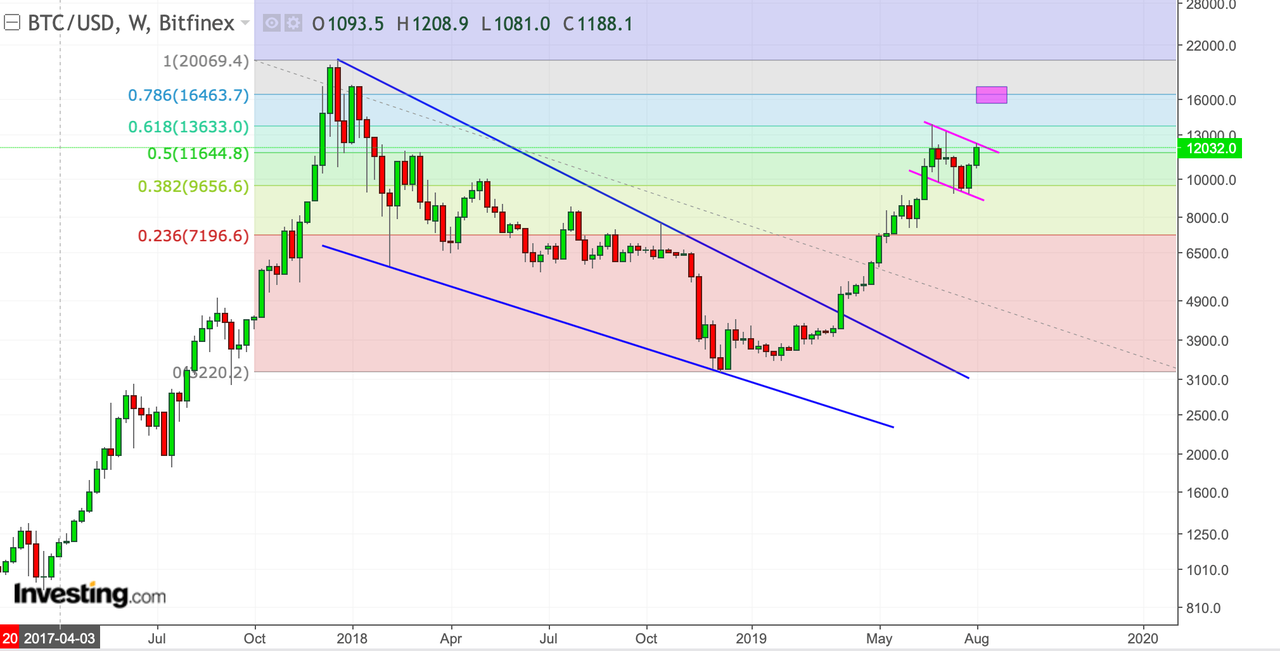
That bull flag has a roughly 4,000 point range implying a break above could target the .786 fib at 16463 which would bring it overtly near the previous highs.
The bull flag has not triggered yet at the time of this writing and the flag could stay in a consolidation range for longer. But it’s there. When would it be invalid? I suppose if price dropped below the lower flag line and breaks the pattern. That’s a wide price range inside the flag and is the risk and bears close watching. But as it stands it’s a pretty clean flag.
Suppose the flag plays and we indeed see a run toward the .786 fib? Expect resistance again and a big battle to take out the all time highs. As I outlined in May, there’s a much more bullish technical target out there if this large wedge structure kicks in in full force: The 1.618 fib above 30,000:
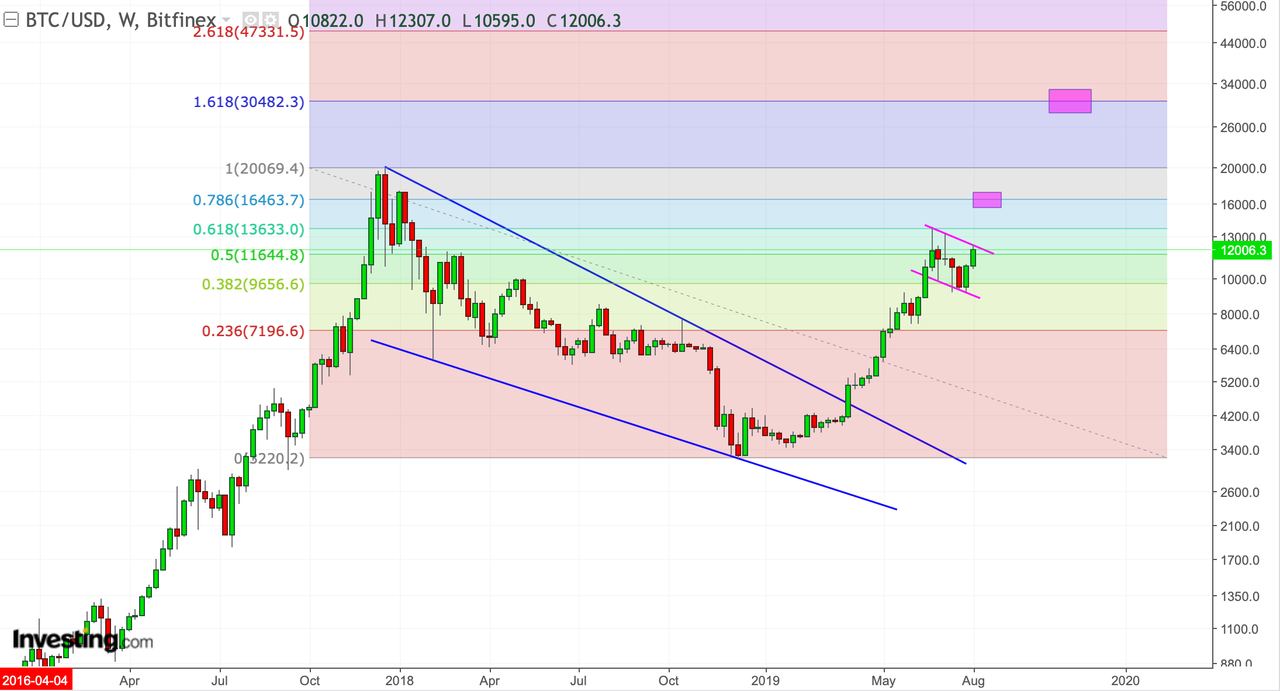
Outlandish? I’ve seen people throw out bigger targets, I can’t comment on other people’s work, I can just focus on what I see here and that’s a technical picture that would support the targets I outlined.
But if it does seem outlandish consider this: We’re in an environment of emerging currency wars with central banks seemingly keen on setting their own currencies aflame embarking on a new rate cutting cycle with no end in sight.
They are desperate to maintain control over the currency system they have created and are administering, and they are at real risk of losing control:
The @ECB is smoking crack.
Look at $DAX vs the German 10 year & you see a central bank in process of losing control.
Negative rates have lost their efficacy and they don’t know what to do.
We’re seeing a colossal policy failure in print. pic.twitter.com/FloGujfEKF— Sven Henrich (@NorthmanTrader) August 8, 2019
The global bond market is screaming from the top of its lungs, it’s screaming a message of stress in the system.
We’re witnessing a historic battle unfold. Big market structures are stretching and bending while global economies have run into a major cyclical and valuation wall as growth is fading, demographics are gnawing at the system, and the system is desperate to defend itself and remain in control. And instruments such as Bitcoin suggest that some of that control is slipping away.
* * *
For the latest public analysis please visit NorthmanTrader. To subscribe to our market products please visit Services.
via ZeroHedge News https://ift.tt/2KADCun Tyler Durden