Earlier this week we wrote that after decades of waiting, for Albert Edwards vindication was finally here – if only outside the US for now – because as per BofA calculations, non-USD sovereign yields on $19 trillion in global debt have now turned negative on average for the first time ever at -3bps.

So now that virtually every rates strategist is now rushing to out-“Ice Age” the SocGen strategist (who called the current move in rates years ago) by forecasting even lower yields (forgetting conveniently that just a year ago consensus called for the 10Y to rise well above 3% by… well, some time now), what does the man who correctly called the unprecedented move in global yields – which has sent $17 trillion in sovereign debt negative – think?
In a word: “There is a lot more to come.“
As the SocGen strategist – who is certainly not at all confused by the move in rates – writes, “investors are perplexed. How can government bond yields have fallen so low in such a short space of time?”
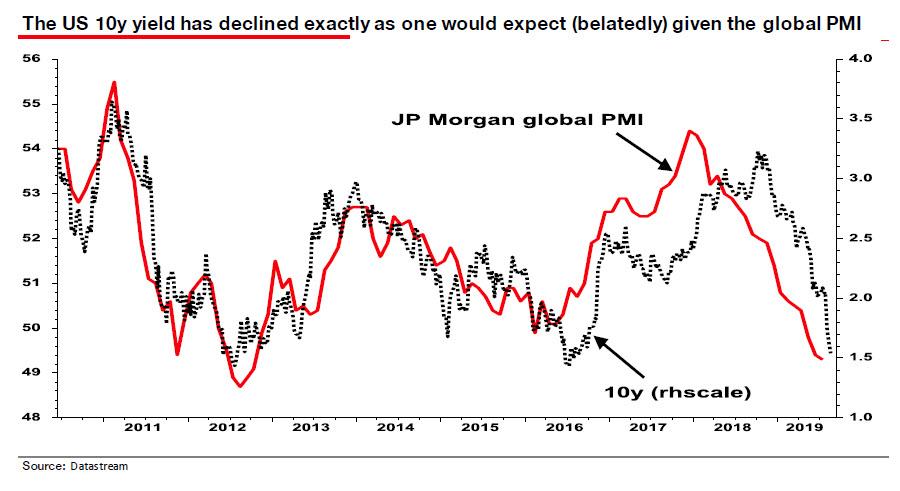
Although the tsunami of negative yields sweeping the eurozone has attracted most attention, yields have also plunged in the US with 30y yields falling to an all-time low just below 2%. For many this represents a bubble of epic proportions, driven by QE and ripe for bursting.
Here Edwards makes it clear that he disagrees , and cautions “that there is a lot more to come.”
What does he mean?
As Albert explains, “when you see the creeping advance of negative bond yields throughout the investment universe, you really start to doubt your sanity. For me it is not so much that 10y+ government bond yields are increasingly negative, but when European junk bonds go negative I really start to scratch my head.” And as we wrote in “Redefining “High” Yield: There Are Now 14 Junk Bonds With Negative Yields“, there certainly is a lot of scratching to do.
One thing Edwards isn’t scratching his head over is whether this is a bond bubble: as he explains, his “own view is that this government bond rally is not a bubble but an appropriate reaction to the market discounting the next recession hitting the global economy from all overleveraged corners of the world (including China), with close to zero core inflation and precious few working tools left at policymakers’ disposal.”
This means that “the bubbles are not in the government bond market in my view. They are in corporate equities and corporate bonds.“
If Edwards is correct about the locus of the next mega-bubble, it is very bad news for risk assets as the “global deflationary bust will wreak havoc with financial markets”, prompting Edwards to ask a rhetorical question:
Does anyone seriously believe that in the next global recession equity markets will not collapse? Do market participants really believe fiscal stimulus and helicopter money will save us from a gutwrenching global bust that will make 2008 look like a picnic? Has the longest US economic cycle in history beguiled investors into soporific complacency? I hope not.
He may hope not, but that’s precisely what has happened in a world where for over a decade, even a modest market correction has lead to central banks immediately jawboning stocks higher and/or cutting rates and launching QE.
So to validate his point that the rates market is not a bubble, Edwards goes on to show that “US and even eurozone government bond yields are not in fact overextended – certainly not on a technical level – but also that fundamentals should carry government bond yields still lower.”
In his note, Edwards launches into an extended analysis of the declining workweek for both manufacturing and total workers, and explains why sharply higher recession odds (which we recently discussed here), are far higher than consensus expected.

But what we found most notable was his technical analysis of the ongoing collapse in 10Y Bund yields. As Edwards writes, “looking at the chart for German 10y yields (monthly plot) their decline to close to minus 0.7% does not seem so extraordinary – merely the continuation of a downtrend within very clearly defined upper and lower bounds (see chart below).”
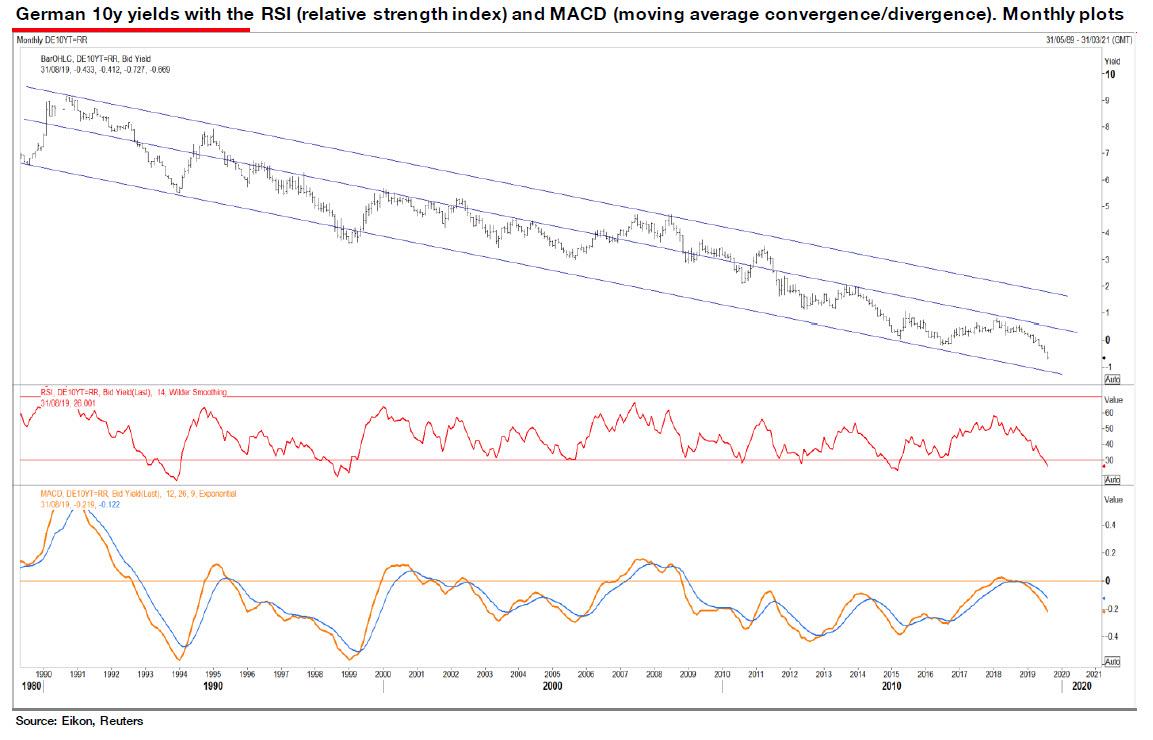
As Edwards explains referring to the chart above, “the bund yield has remained in the lower half of that band since 2011, but there is good reason for that as the ECB has struggled with a moribund eurozone economy and core inflation consistently undershooting its 2% target.”
Still, even Edwards admits that the pace of the recent decline in bund 10y yields is indeed unusually rapid (with a 14-month RSI of 26, middle panel).
And although this suggests a pause in the decline in yields is technically warranted, the MACD (bottom panel) doesn’t look at all stretched. After a pause (data allowing), 10y bunds could easily fall to the bottom of the lower trendline (ie below -1.5%) without any great technical excess being incurred.
His conclusion: “This market certainly doesn’t look like a bubble to me.”
Shifting attention from Germany to the US, Edwards writes that unlike the 10y German bund yield, “the US 10y has mostly occupied the top half of its wide downtrend band since 2013.”
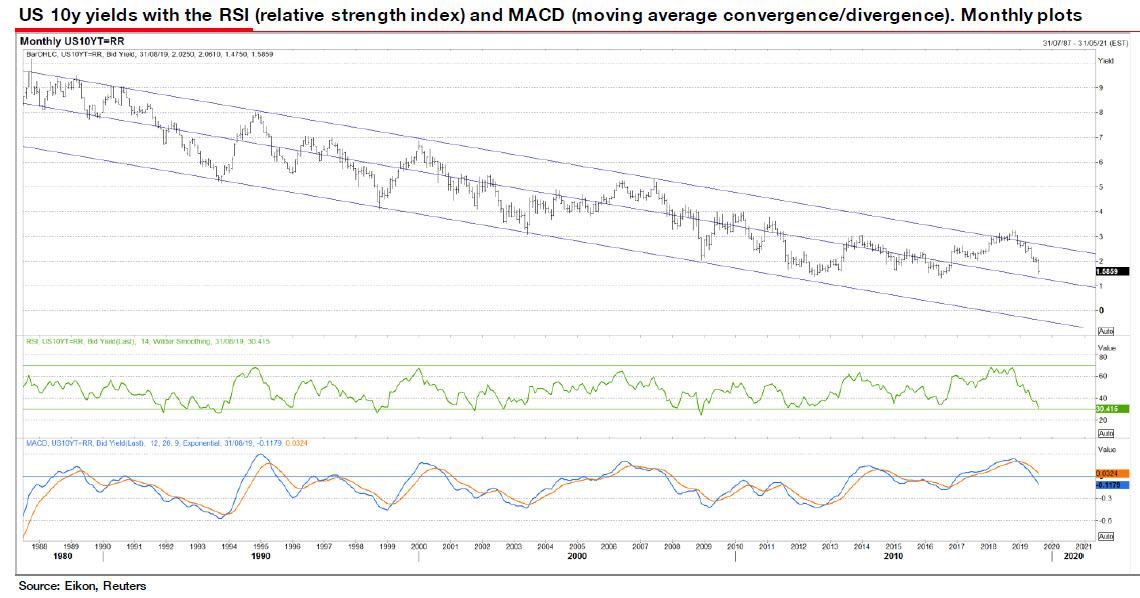
That is fairly unsurprising given the stronger US economy together with Fed rate hikes. Technically the RSI is much less extended to the downside than the bund, but like Germany the MACD could still have a long way to fall. The bottom of the lower downtrend is around minus 0.5% by the end of 2020.
It is Edwards’ opinion that “we are on autopilot until we get” to 0.5%.
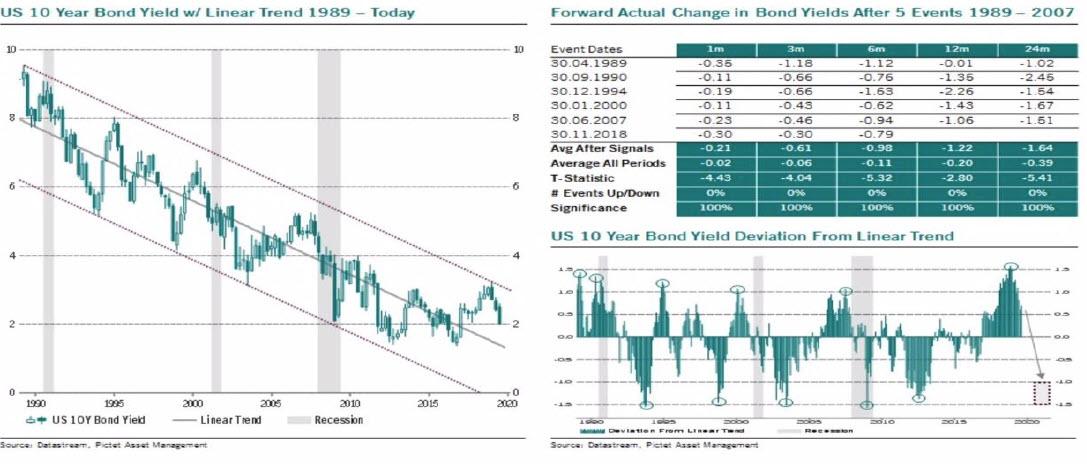
But wait, there’s more, because in referring to the charting of Pictet’s Julien Bittle (shown below), Edwards points out the right-hand panel which demonstrates how far US 10y yields might fall over various time periods after hitting a cyclical peak. “He shows that on average we should expect a decline of 1-1½ pp from the trendline, which takes us pretty much to zero (see slide).” Personally, Edwards says, he is even “more bullish than that!”
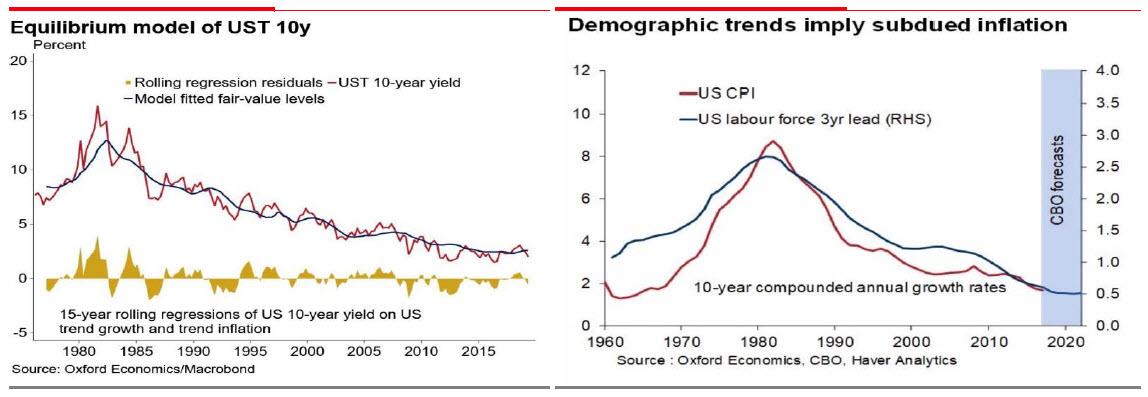
Edwards then points us to the work of Gaurav Saroliya, Director of Macro Strategy at Oxford Economics who “certainly doesn’t think that QE is depressing bond yields.” In this particular case, Saroliya uses a simple model which fits US 10y bond yields with trend growth and inflation reasonably accurately (see left hand chart below). As Edwards notes, “given the demographic situation, inflation is likely to remain subdued.”
In conclusion Edwards presents one final and classic Ice Age chart to finish off.
As the bearish – or is that bullish… for bonds – strategist notes, “the last few cycles have seen a sequence of lower lows and highs for nominal quantities (along with bond yield and Fed Funds). I have used a 4-year moving average and have added where I think we may be heading in the next downturn and rebound – and more importantly where I think the market is now thinking where we are heading.”
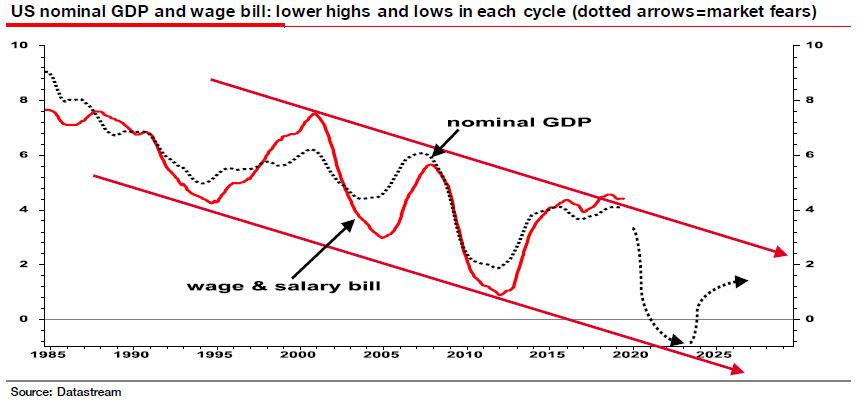
Referring to the implied upcoming plunge in nominal GDP, Edwards explains that “that is why this is not a bond bubble. It is the next phase of The Ice Age. And it is here.”
One last note: is it possible that Edwards’ apocalyptic view is wrong? As he admits, “of course” he could be wrong: “And given my dystopian vision for the global economy, equity and corporate bond investors, I sincerely hope I am.”
via ZeroHedge News https://ift.tt/2P8iEss Tyler Durden