It’s Official: Bank of America Now Calls What Is Coming “QE4”
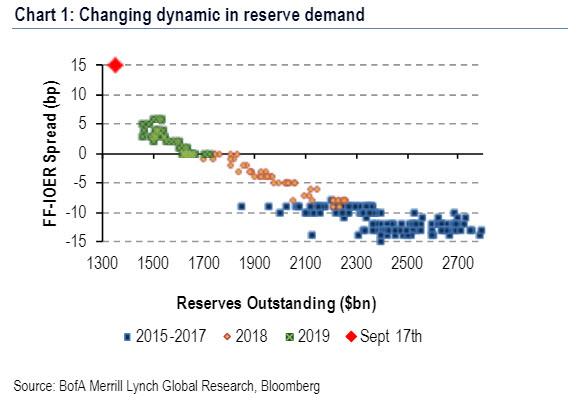
One of the reasons for the sharply hawkish initial response to Wedensday’s FOMC meeting – one which saw both the dollar and yields spike – is that as we pointed out just before Powell’s statement, in the hours ahead of Powell’s press conference, Wall Street consensus quickly shifted with many expecting the Fed to announce some form of permanent repo facility or restart of POMO (or QE for those who call a spade a spade) to push reserves back to a level where the funding market is stable. This, as we showed with the following chart, would require some $400 billion in new reserves for the FF-IOER spread to normalize.
To the disappointment of many, Powell did not do that, and instead, the FOMC realigned both interest on excess reserves (IOER) and the reverse repo (RRP) rate lower by 5bp, resulting in 30bp cuts to both rates. Powell also noted during his press conference that the Fed would use temporary open market operations (OMOs) “for the foreseeable future” to address pressures in funding markets.
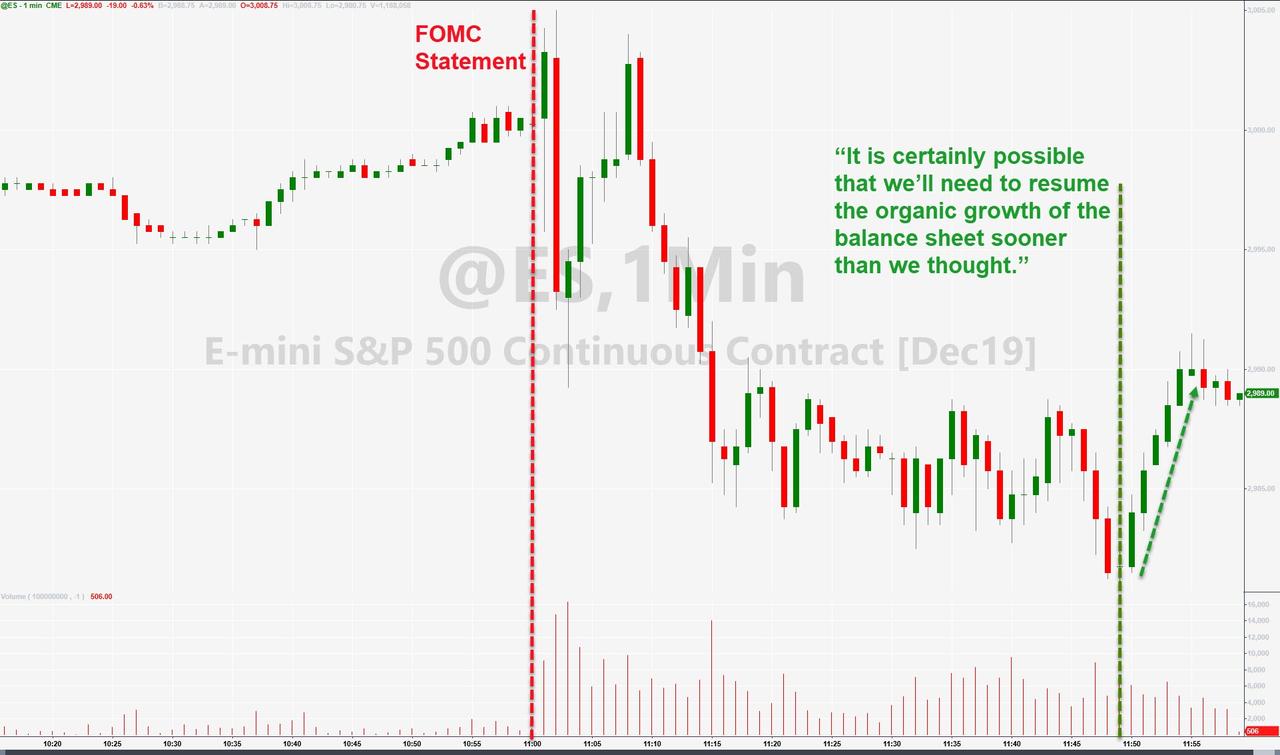
However, and the reason why stocks shot up just before 3pm ET on Wednesday, is that that’s when Powell added that “it’s possible that we’ll need to resume the organic growth of the balance sheet, earlier than we thought. … We’ll be looking at this carefully in coming days and taking it up at the next meeting” in late October. Said otherwise, while the Fed may not have announced QE4 yesterday, but it will likely announce it in the very near future.
And while the Fed also moved to broadly expand its balance sheet late on Friday by preannouncing continued daily open market repo operations, together with at least three, $30 billion term repos to ease funding conditions around quarter end, which confirms that the rebound in the Fed’s balance sheet – the first in almost five years – is anything but temporary…

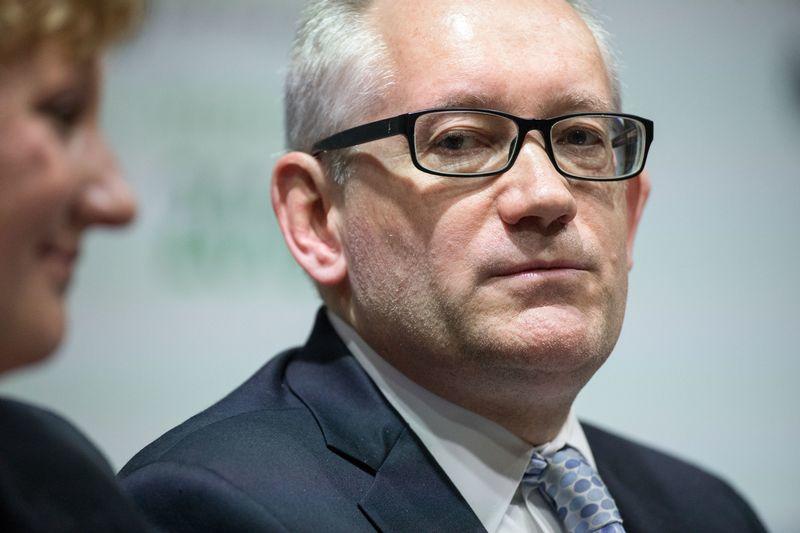
… we got two more hints that bond purchases are coming in the very near term when first Goldman, and then Simon Potter, the former head of the NY Fed’s market desk, signaled that the Fed will have to buy more debt, potentially as early as November.
As a reminder, Goldman now assumes a roughly $15bn/month rate of permanent OMOs, enough to support trend growth of the balance sheet plus some additional padding over the first two years to increase the size of the balance sheet by $150bn, restoring the reserve buffer and eliminating the current need for temporary OMOs.

And while Simon Potter did not lay out a timeframe for his prediction, he agreed that the Fed “may have to expand the central bank’s balance sheet through outright purchases of U.S. Treasury securities, to ensure stable liquidity conditions at the end of the quarter as well as at year-end.”
The bottom line from the flurry of events which took place in the last week is that after just under two years of Quantitative Tightening, which shrank the Fed’s balance sheet from $4.5 trillion to $3.8 trillion, the current level of liquidity in the financial system is once again insufficient.
Which addresses the question that everyone has been quietly asking: if the current level of reserves, at roughly $1.4 trillion as broken out by bank cash levels which we discussed last night, is too low…

… then what is a sufficient level of reserves?
That’s the question addressed by JPMorgan’s “other” quant, Nick Panagirtzoglou in his latest weekly Flows and Liquidity letter, in which he writes that “the liquidity effects from the Fed’s balance sheet shrinkage have been manifesting themselves over the past year via a reduction in both broad or non-bank liquidity and narrow or banking sector liquidity” and reminds readers that recently he also warned that that “liquidity will likely continue to tighten in the US banking system even after the Fed stops its balance sheet shrinkage, and, as a result, in order to stop this liquidity tightening from advancing further, the Fed may need to start open market operations sooner rather than later to inject reserves into the US banking system.“
As we said last week (and above): QE, which until recently nobody thought was possible again, is now a foregone conclusion.
So how does the JPM quant justify his view that more POMOs are just around the corner? Largely the same way as BofA, by depicting the sensitivity of the Fed Funds rate to the level of reserves. The chart below plots the effective Fed Funds rate over the Fed’s policy rate i.e. the IOER or Interest On Excess Reserves, with Panagirtzoglou noting that “the steepening of this relationship over the past year is consistent with the idea that the level of reserves has been shifting towards tighter territory. When reserves are abundant, the line in Figure 3 should be relatively flat, i.e. any change in reserves should have little impact on interest rates, which was the case when reserves were above $2tr. But when liquidity conditions become tighter and reserve drainage starts “biting”, the sensitivity of interest rates to changes in reserves increases.” In other words, and as the chart at the top showed, “the steeper this sensitivity, the more the tightening in liquidity conditions.“
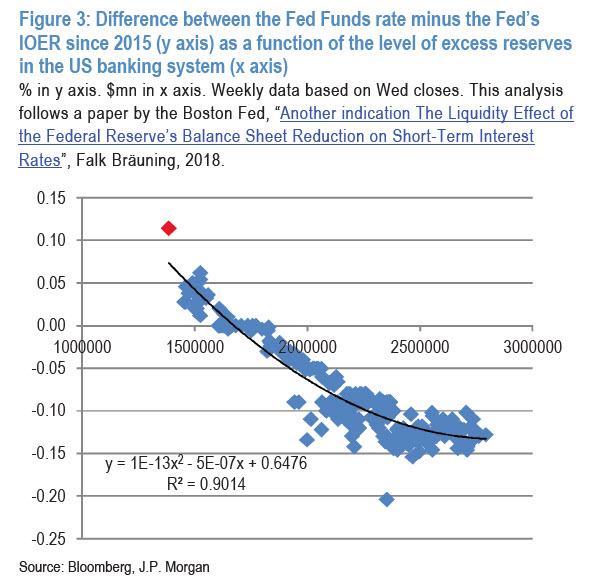
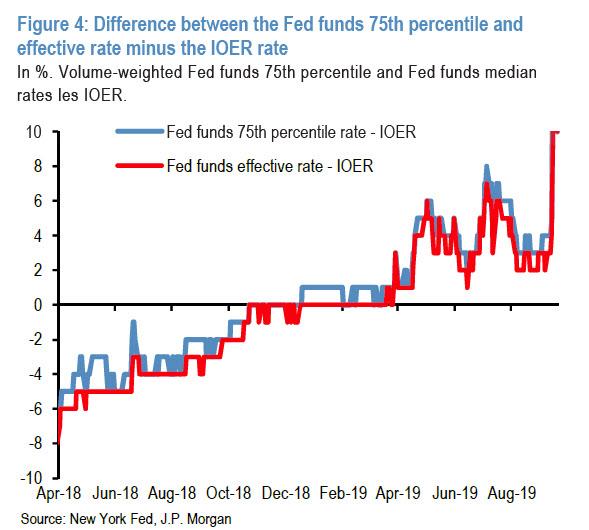
The chart above suggests that the steepening (i.e., tightening) began when the level of reserves started falling below the $2tr mark in the middle of 2018 and intensified since last December as reserves fell below the $1.75tr mark. This steepening of the sensitivity of interest rates to reserve changes became more acute more recently, when reserves fell below $1.6tr in April and below $1.4tr this past week. The response of interbank rates, both secured and unsecured has been forcefully as shown in the chart below demonstrating the relationship between Fed Funds and IOER…
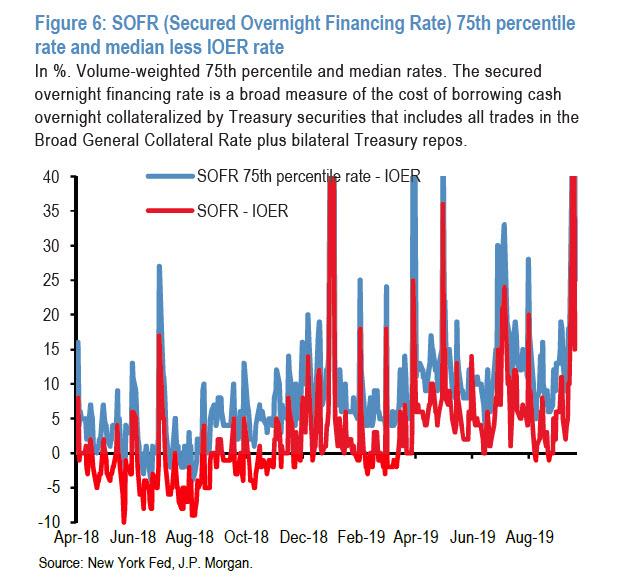
… and also the chart showing the spread between SOFR and IOER.
The first chart above, depicting the gap between the IOER and the Fed Funds rate, shows that the increases over the past week’s reserve drainage episode were more pronounced than last April’s episode, consistent with the idea that we are currently at a steeper part of the reserve demand curve than last April, according to JPM.
The second chart shows a similar tightening trend in the secured interbank market, in this case measured by the SOFR (Secured Overnight Financing Rate), a broad measure of the cost of borrowing cash overnight collateralized by Treasury securities that include all trades in the Broad General Collateral Rate plus bilateral Treasury repos. The secured overnight interbank market is much bigger than the unsecured one. But what is troubling is that secured overnight interbank market rates are more volatile, as the experience of this past week reminded us. Here too the increases in SOFR over the past week’s reserve drainage episode were more pronounced that last April’s episode, consistent with the idea that we are currently at a steeper part of the reserve demand curve than last April (it also begs the question just how valid of a replacement to LIBOR will SOFR be, if its volatility is so high as to rattle the hundreds of trillions in floating-rate debt linked currently to Libor and, started in 2020, to SOFR).
One final observation: the ratio of reserves to banking system assets has collapsed over the past five years to its lowest level since the end of 2009 i.e. a ten year low… although of course, prior to that it was 0% so this is only a financial crisis artifact, in large part sprung by changes to the regulatory regime demanding banks hold on to much more reserves.

The bottom line here is clear: despite $1.4 trillion in “excess” reserves, despite a $3.8 trillion Fed balance sheet, the liquidity in the system is not enough.
So what is the proper level of liquidity measured by bank reserves?
To answer that question, Panigirtzoglou asks rhetorically, what if the current ratio of 7.9% is too low and a ratio of around 10% seen at the beginning of the year is more appropriate? His answer: a 10% ratio would imply a level of reserves of $1.75tr, $360bn above current levels, which is in line with our calculation of $400 billion more reserves needed. This, to the JPM analyst, “is an important decision the Fed would have to make in its October meeting”, as well as the following question: “Is there currently a need for an upfront and permanent injection of reserves, before dealing with the longer term issue of $160bn per annum balance sheet expansion perhaps needed over time due to banknotes in circulation and the organic expansion of the banking system?“
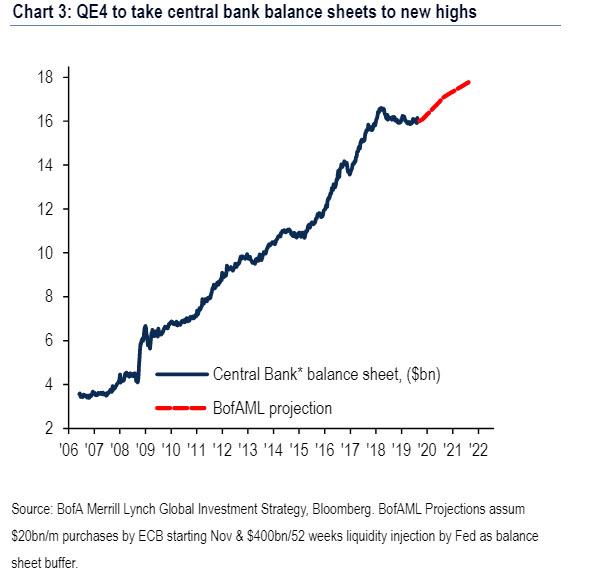
As of this moment, Bank of America, Nomura, JPMorgan, Goldman and, last but not least, Simon Potter are all convinced that there is now a need for an “upfront and permanent injection of reserves.” Which means it is just a matter of time before QE4 – as Bank of America’s CIO Michael Hartnett now openly calls it – arrives, and pushes central bank balance sheets to new all time highs, to wit:.
QE4: Fed makes it 43 rate cuts YTD (751 since Lehman); ECB QE (€20bn/m from Nov’19) + Fed liquidity operations (est. $400bn next 12-months) = new high in G5 central bank balance sheet by Apr’20 (prior peak was $16.6bn in Mar’18); G5 central banks have bought $13tn of financial assets since 2008 (Chart 3).
Tyler Durden
Sun, 09/22/2019 – 19:35
via ZeroHedge News https://ift.tt/2VgypwU Tyler Durden