Break-Out Or Fake-Out?
Authored by Sven Henrich via NorthmanTrader.com,
The Fed cut rates, the ECB officially launched QE, and a parade of administration officials touted progress on the ever elusive China trade deal for the 100th time and voila: Markets breaking out to new highs. But is the breakout a fake out?
Let’s explore some uncomfortable facts, charts and perspectives.
Firstly, and don’t laugh too much, let’s at least mention fundamentals.
GDP growth keeps slowing:
Earlier this week, the Commerce Department released Q3 GDP figures, which showed a marked slowdown year over year compared to Q3 2018. Real GDP growth has slowed this year from 2.9% to 1.9%. Personal consumption has slowed from 3.5% to 2.9%. Services have slowed from 3.4% to 1.7%. And gross private investment slowed from 13.7% to negative 1.5%.
On Friday, the same day markets broke to new highs the Atlanta Fed pegged Q4 GDP at 1.1% while the New York Fed Nowcast dropped their Q4 GDP growth projection to 0.8%.
Now show me some history where markets sustained new all time highs with 1% GDP growth in Q4. Best of luck.
On Thursday the Chicago PMI missed expectations hard coming in at 43.2 versus 47 expected:
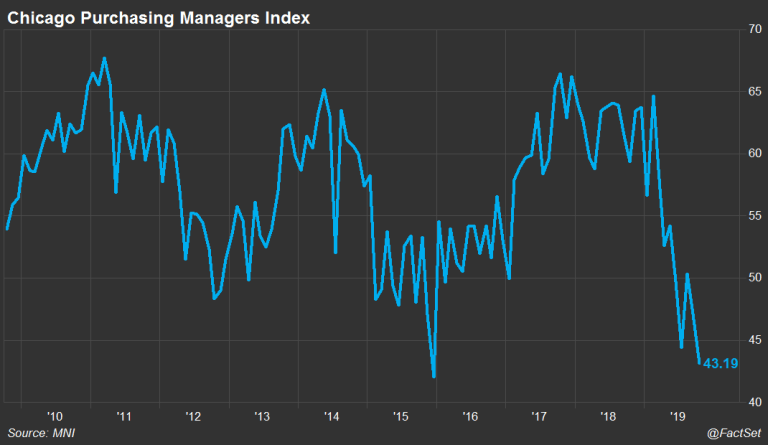
And on Friday ISM manufacturing also shows continued contraction at 48.3% albeit a slight improvement over September which came in at 47.8%.
The cheers on Friday? Supposedly the employment report as it beat lowered expectations, but nevertheless jobs growth remains in a steady trend of slowing growth.
Most notable private employment growth has been sinking all year:
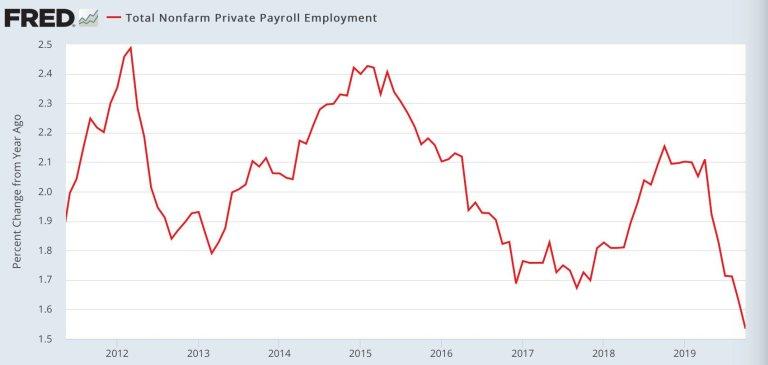
But none of this matters to this stock market at this stage, never mind that the jobs market is a lagging indicator.
Why doesn’t anything fundamental matter? The US Federal Reserve. As S&P companies are now reporting their 3rd quarterly decline in earnings the multiple expansion machine of 2019 continues unabated and is the primary rationale for the bull case: Synchronized global monetary easing will continue to float markets to new highs according to JP Morgan strategists.
This may well be the case or it may not.
Let there be no mistake: The Fed under Jay Powell, is the prime price discovery mechanism of this market. Who are you going to believe? Me or your own lying eyes?
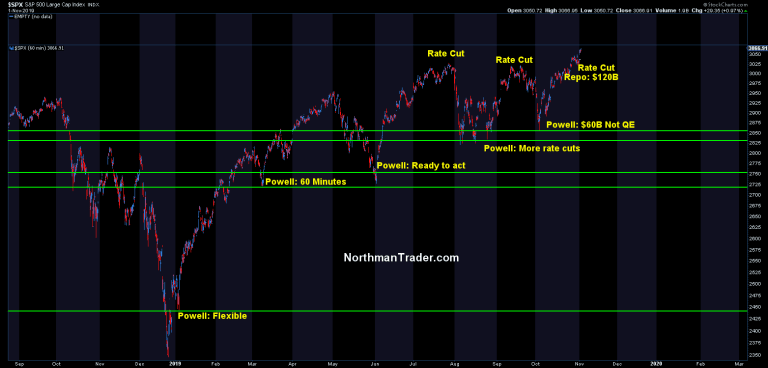
In January Powell propelled markets higher to the tune of over 3.5% in one day on his “flexible” speech. And every single corrective activity this year has found a sudden end in the warm arms of uncle Fed. The March pullback ended on the heels of Jay Powell’s 60 Minute interview. The May correction ended when Jay Powell signaled readiness to act at the beginning of June. And act he did. He cut in July, but it didn’t quite work as planned. Markets sold off. But fear not. On August 23rd, amid great market uncertainty, Jay Powell signaled more rate cuts to come and markets rallied. And in September he delivered with a second rate cut, but again markets sold off. What a disappointment.
More firepower was needed as suddenly overnight rates spiked and repo activities were launched in the middle of September. But it wasn’t enough. Markets sold off into the beginning of October.
What did Powell do? He launched $60B per month in “not QE” at the beginning of October. Markets haven’t had a single down week since. And this week they cut cut rates again.
The cumulative picture: This is the most interventionist Fed since Ben Bernanke. Don’t believe me? Look at the balance sheet since September. Fed gone wild:
Fed balance sheet now north of $4 trillion again increasing by over $261 billion in just 2 months.
That’s $1.566 trillion on an annualized basis.
But remember it’s not QE because the Fed said so. pic.twitter.com/WK0EwbKB0v— Sven Henrich (@NorthmanTrader) November 1, 2019
Let’s summarize the facts:
Since July the Fed has cut rates 3 times, since September they have increased their balance sheet by $261B, they have added repo, expanded it to $120B per day in October, they’ve launched a $60B treasury bill buy program all desperately designed to inject artificial liquidity into the system and to suppress rates. I repeat: This is the most interventionist Fed since Ben Bernanke.
And this is what it took to break markets to new highs.
But what exactly is better since last year? Growth? Earnings? None of the above. It remains a game of multiple expansion. And what do we have now? $23 trillion in US debt, trillion dollar deficits, 0.8%-1.1% Q4 GDP growth and a stock market valuation at 145% GDP.
The Fed it’s claiming it’s not QE, but markets keep acting like it.
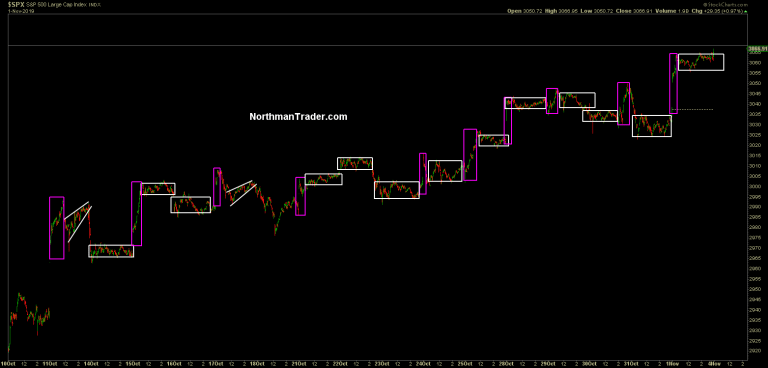
Now let’s look at the price structure that is unfolding:
All price gains come with open gaps and ramps with virtually no intra-day price movements:
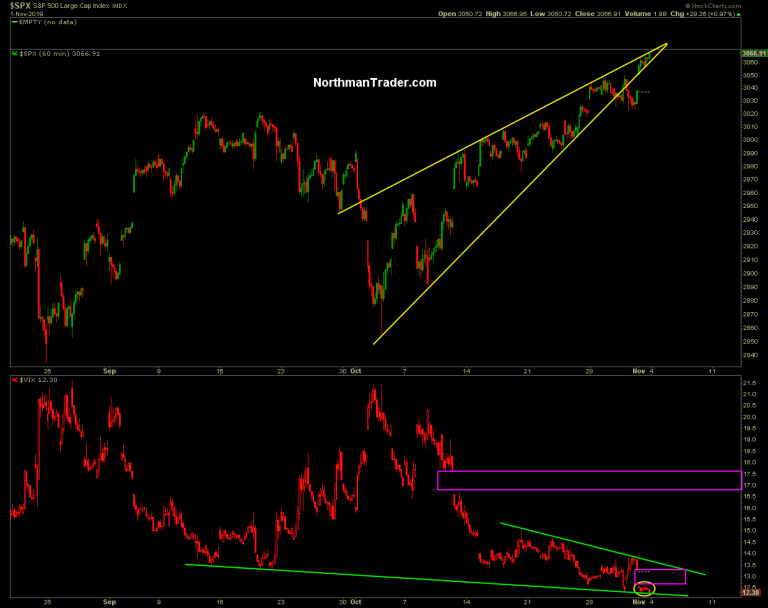
The result? Just like in the QE days of old volatility is getting crushed. On Friday the $VIX practically died:
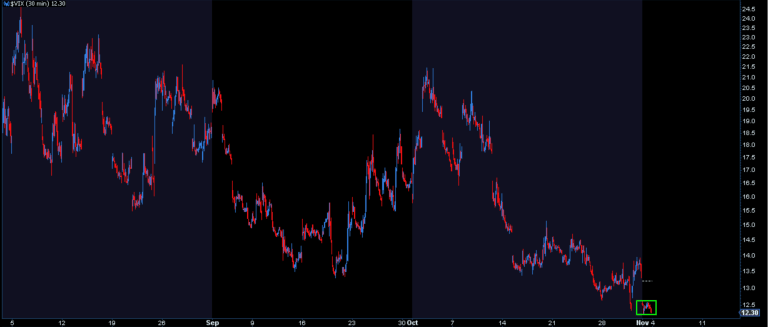
Think this is normal? Hardly. Is it sustainable? Doubtful.
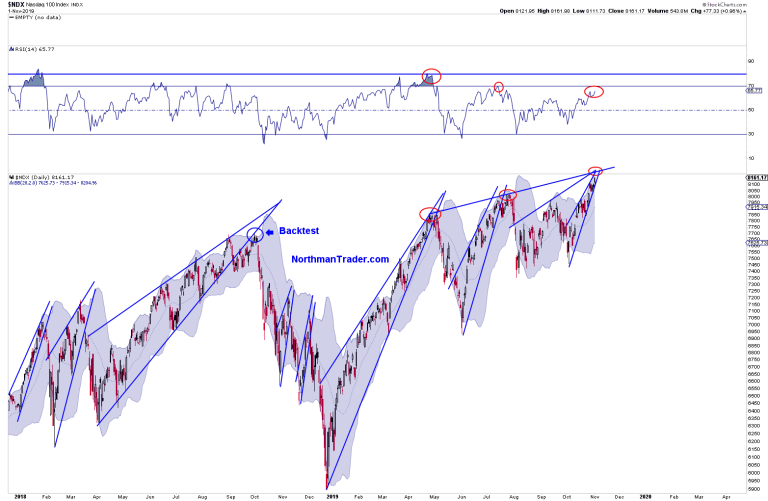
Indeed we can once again observe prices levitating in very tight wedge patterns amid extreme volatility compression:
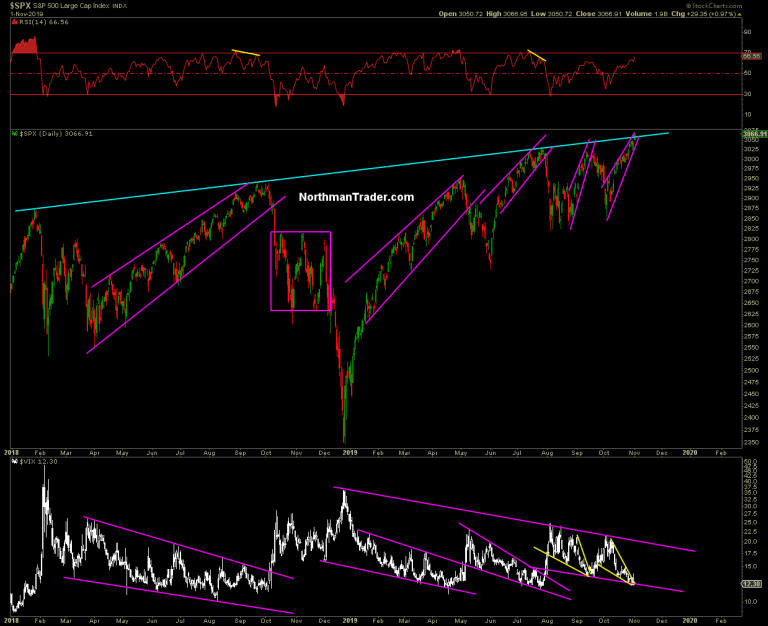
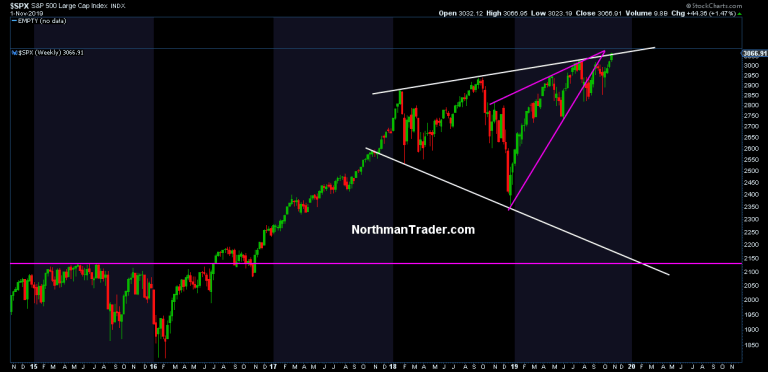
You will note that price closed slightly above the upper trend line on Friday and we can see this poke above on the larger Megaphone chart as well:
I’ve been on the record saying that a confirmed breakout out would be a breakout followed by a confirmed retest. This has yet to occur.
On a longer term chart we haven’t crossed above trend yet:

The key question of course: Is this a genuine breakout or a fake out?
Some considerations:
Firstly this current $VIX compression phase is entirely untested:
New highs have once again come on a lower read of the value line geometric index:
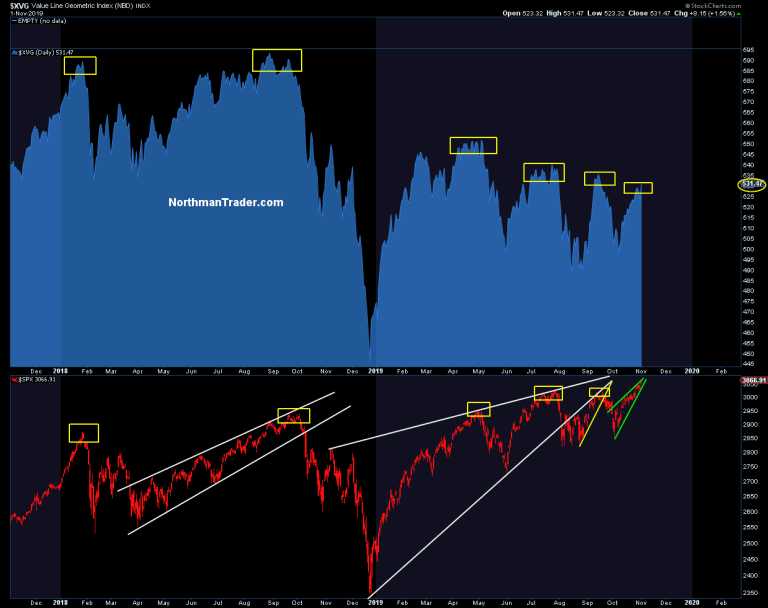
So it remains unconfirmed.
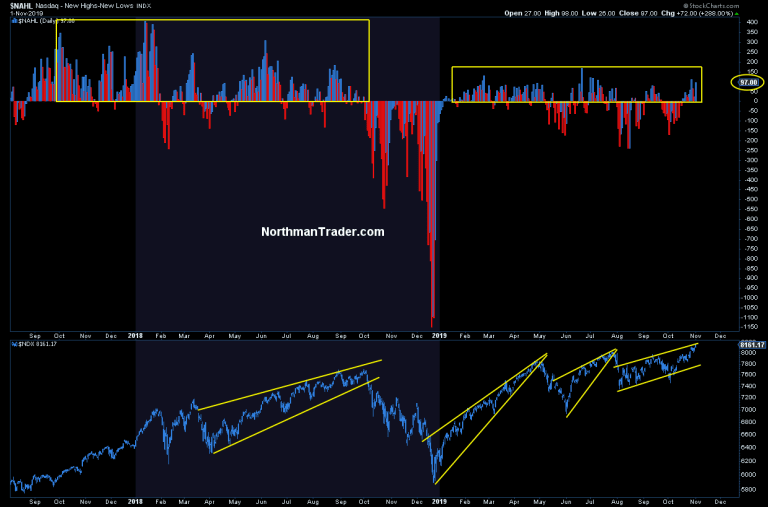
Negative divergences persist on all of these new highs:
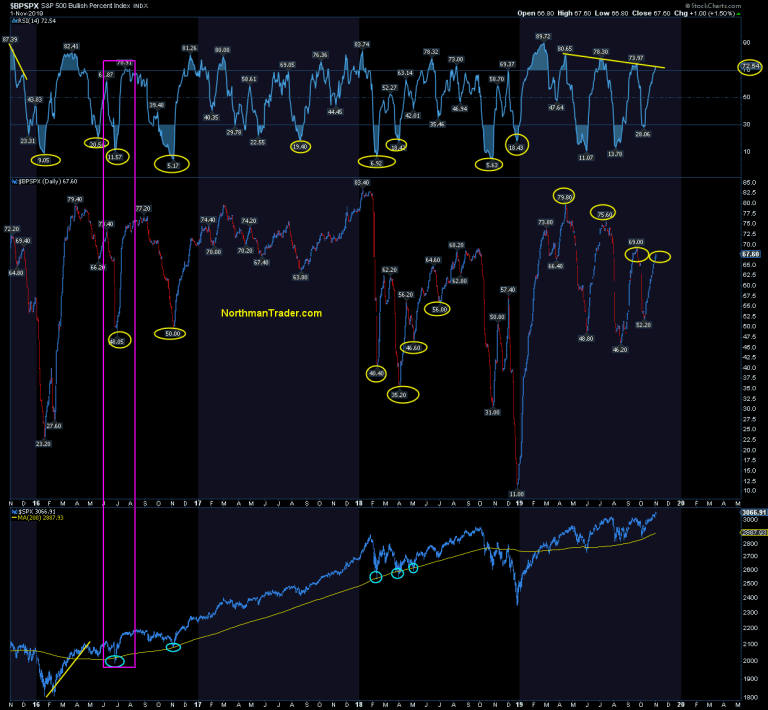
And if there was strength it is not to be found in $NYMO which closed at a lower high on Friday:
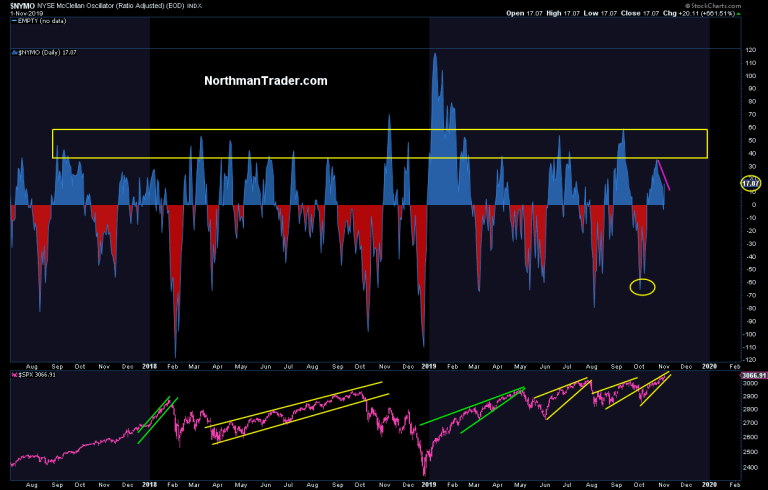
I could point to more, but you get my drift: This rally remains thin, thin on volume, thin on signal conformation and entirely dependent on volatility compression.
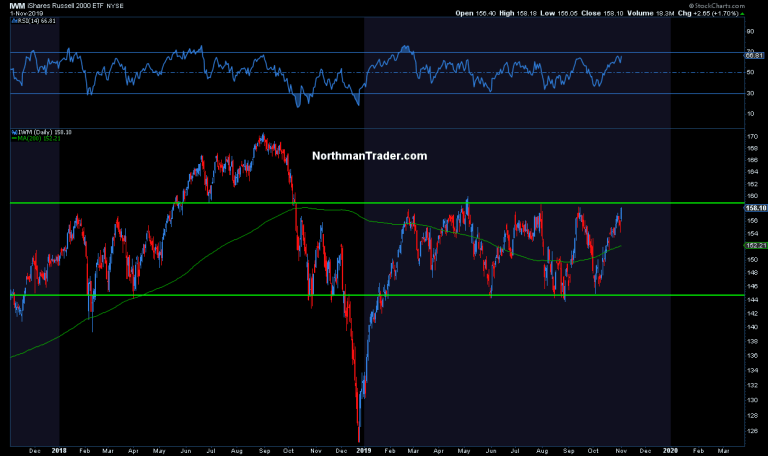
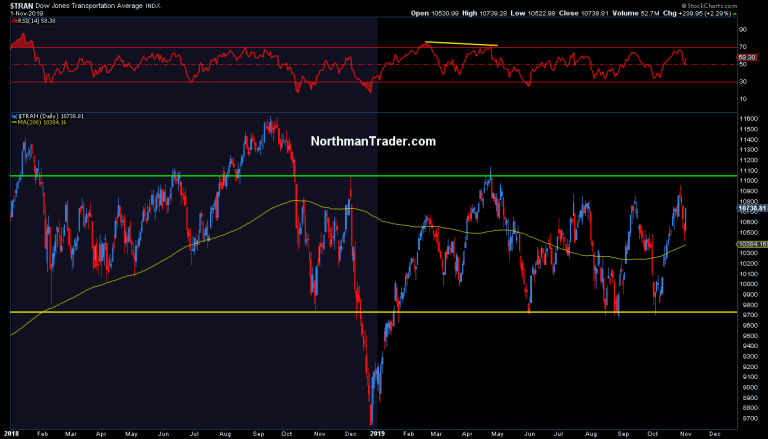
Small caps and transports still haven’t made new highs:
But we see a move higher in banks:
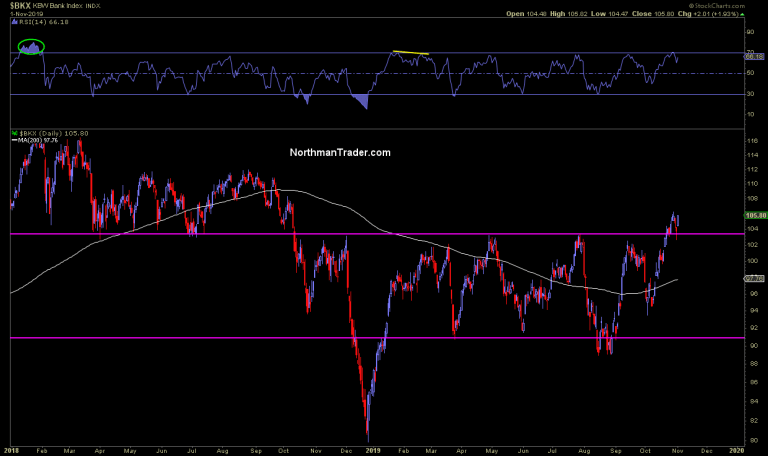
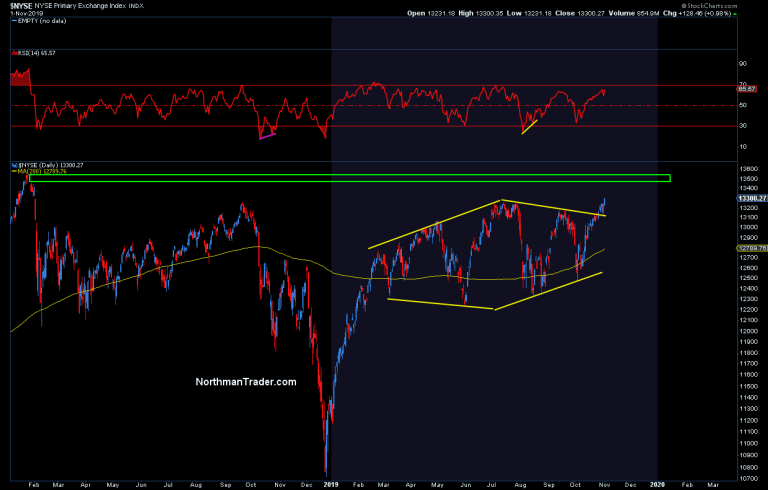
and breakouts in some indices, but ALL face major resistance just ahead:

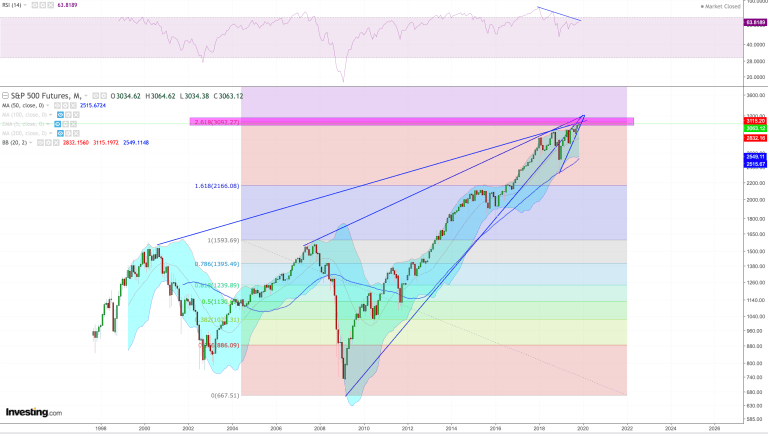
In terms of risk higher. Per my combustion case from April, $ES is within a stone’s throw of its 2.618 fib:
And, for giggles, I’ll throw a historic oddity your way.
In 2007 $SPX made a new all time high in July and then, following the Fed cutting rates and other high in that October. A marginal new high by 1.297% to be precise:
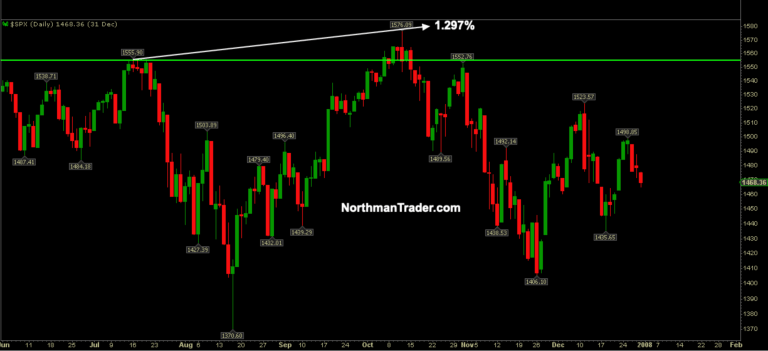
That was the all-time high then. Nobody knew it then. Growth was slowing, valuations were high, Wall Street was bullish, subprime was contained and no recession was coming. But it did. In December is started.
Why is that 1.297% so giggle worthy?
Well, you may appreciate the irony. This July $SPX hit a high of 3028. 1.297% higher from there? Friday’s close precisely:
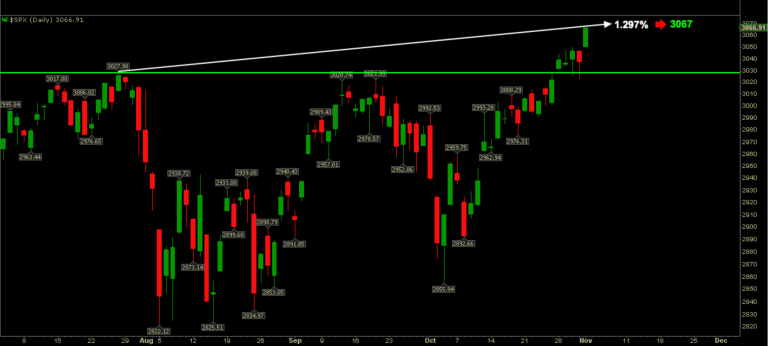
Now I fully acknowledge that this may mean absolutely nothing, but it is an interesting fluke of history at the very least.
We’ll know more next week.
Bottomline: From my perch this breakout remain unconfirmed, but upside risk remains. The structure of the rally is poor, driven by non stop levitation gaps, ramps and camps virtually void of any intra-day price discovery. Fundamentals have yet to show any notable improvement, multiples keep expanding ever so reliant on ever more aggressive central bank intervention.
My question for 2019 has been one of efficacy and it must be acknowledged that, while the Fed has missed its inflation target for over 10 years, it continues to succeed in bringing about asset price inflation:
On Friday total stock market capitalization to GDP hit 145.6%
At the beginning of the year it was 122%.
The long term average is 83%. pic.twitter.com/NsdPVn9jB9— Sven Henrich (@NorthmanTrader) November 2, 2019
I know of no market history where these type of valuations are sustainable concurrent a quarter with 1% or so GDP growth and in context of the chart picture outlined above I remain skeptical of the veracity of any breakout. Volatility is too low, open gaps are too many, negative divergences too plentiful. But for now, price has exceeded our summer sell zone of 3000-3050 by 0.5% and has transitioned into our Combustion sell zone.
Without a confirmed reversal markets can continue to drift higher as they have been. For now the added liquidity machine introduced by the Fed remains in full control. On an eventual reversal bears have to prove their case and reverse $SPX back below 3,000 as this area will now act as support.
For now the forces of intervention remain in full control in spite of a significant lower growth picture in 2019 versus 2018 proving again: Global synchronized central bank intervention appears to be working again, for now. But the core issue: Markets can no longer move higher without central banks always coming to the rescue and haven’t been for over 10 years now. It’s a central committee subsidy program and the antithesis to free market capital flows and as a result of a liking fundamental unpinning to the multiple expansion markets are at building risk of a sizable risk off event
* * *
For the latest public analysis please visit NorthmanTrader. To subscribe to our market products please visit Services.
Tyler Durden
Sun, 11/03/2019 – 10:30
via ZeroHedge News https://ift.tt/36rmCkq Tyler Durden