We are starting to get personal accounts from people who are experiencing the illness caused by the novel coronavirus. While there is certainly cause to be skeptical, considering all the rhetorical hyperbole versus the real effect of the outbreak on world markets and events, pieces like what follows do seem to give consistent information. So, without further ado…
This is reprinted from the original piece from the Washington Post, as presented by the Stamford Advocate, dated 28 February 2020: (Carl Goldman, to the Washington Post, writes:)
I have the coronavirus. And it hasn’t been that bad.
I am in my late 60s, and the sickest I’ve ever been was when I had bronchitis several years ago. That laid me out on my back for a few days. This has been much easier: no chills, no body aches. I breathe easily, and I don’t have a stuffy nose. My chest feels tight, and I have coughing spells. If I were at home with similar symptoms, I probably would have gone to work as usual.
I caught the virus on the Diamond Princess, the cruise ship that was quarantined outside Yokohama for 14 days, at the end of a 16-day cruise I took with my wife, Jeri. When I left the ship a couple of weeks ago, I felt fine. We checked our temperatures throughout our quarantine. Jeri and I got a swab test for the virus. Our temperatures were normal; they’d get the swab results back in 48 hours. Our test results had not arrived before we boarded buses for the airport, where two U.S. government planes waited for us.
As we took off from Tokyo, I had a bit of a cough, but I chalked it up to the dry air in the cabin. I felt pretty tired – but who wouldn’t, in our situation? I dozed off.
When I woke up, I had a fever. I made my way to the back of the cargo plane, where the Air Force had set up a quarantine area cordoned off with sheets of plastic. They took my temperature. It was over 103 degrees. So I took a seat in the quarantine area and fell back asleep until we touched down in California, at Travis Air Force Base.
Officials from the Centers for Disease Control and Prevention came onto the plane and said that three of us who had been cordoned off would fly to Omaha (with our spouses, if they wanted to come along). The CDC had a quarantine location at the University of Nebraska’s hospital. We arrived on Feb. 17, greeted by a fleet of ambulances and police cars. Officials put me on a stretcher and wheeled me into a van, which made for a very dramatic scene. I easily could have walked despite my exhaustion.
On the hospital campus, they put me in a biocontainment unit. The space was sealed off, with two double-paned windows that looked out on the hallway, and a large, heavy, insulated door. Two cameras watched me at all times; a set of computer monitors were equipped with microphones, so that the medical staff and I could communicate with CDC officials at central command down the hall. The room had last been used for the Ebola outbreak in 2013.
A doctor and nurses reviewed my case with me and took a bunch of lab tests. They wore heavy-duty hazmat suits sealed with duct tape and equipped with motors that helped with air circulation. It looked like something out of “The Andromeda Strain.” When the test came back a few hours later, I wasn’t surprised to learn that I had the coronavirus. Later, the Tokyo swab confirmed the result – I had caught the virus even before I left the ship.
It didn’t scare me too badly. I knew my number was up. The way I saw it, I was going to get stuck in at least 14 more days of quarantine, even if I didn’t get the virus. So many fellow passengers had come down with the illness, including one of my friends, that I’d gotten somewhat used to the idea that I might catch it, too. My wife, however, tested negative and headed to quarantine at a separate facility a few blocks away. After those days being cooped up on the ship together, I think we both relished the alone time; we still could communicate through our phones.
3D Rendering of Coronavirus
During the first few days, the hospital staff hooked me up to an IV, mostly as a precaution, and used it to administer magnesium and potassium, just to make sure I had plenty of vitamins. Other than that, my treatment has consisted of what felt like gallons and gallons of Gatorade – and, when my fever rose just above 100 degrees, some ibuprofen. The nurses came to the room every four hours or so, to check my vitals, ask if I needed anything and to draw my blood. I got very good at unhooking all the monitors checking my oxygen level, blood pressure and heart rate so I could go to the bathroom or just pace around the room a little, to get my blood flowing. I never quite got the hang of hooking them back up without making a tangled mess. After 10 days, I moved out of biocontainment and into the same facility as Jeri. Now we can videochat from our separate quarantines, in neighboring rooms.
As of my most recent test, on Thursday, I am still testing positive for the virus. But by now, I don’t require much medical care. The nurses check my temperature twice a day and draw my blood, because I’ve agreed to participate in a clinical study to try to find a treatment for coronavirus. If I test negative three days in a row, then I get to leave.
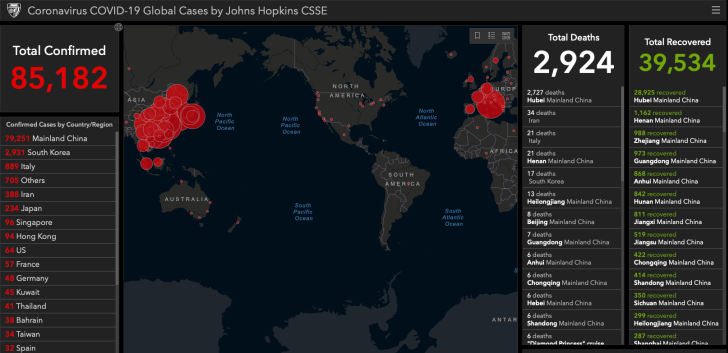
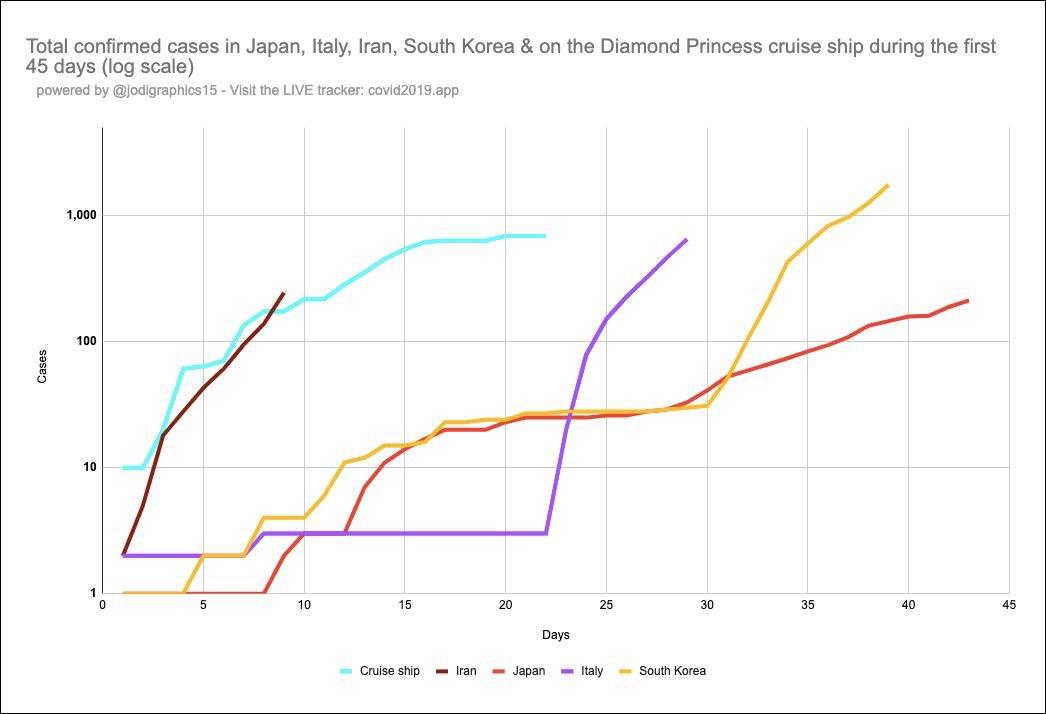
The time has passed more quickly than I would’ve expected. With my laptop, I get as much work done as I can, remotely. I catch up with friends. I take walks around my room, trying to take a thousand more steps each day. I also watch the news. It’s surreal to see everyone panic – news conferences, the stock market falling, school closures – about a disease I have. It does seem likely that coronavirus will spread in the U.S., but it won’t help anybody if we all panic. Based on my experience, I’d recommend that everyone get a good digital thermometer, just as a comfort tool, so they can reassure themselves if their noses start running. I have been relatively fortunate: At least six Diamond Princess passengers have died from the virus, of the around 705 passengers who caught it. But coronavirus doesn’t have to be a horrible calamity.
If you told me when I left home in January that I wouldn’t be back until March – that, instead, I would be confined for more than 24 days because I’d catch a novel virus at the center of what could become a pandemic – that would have completely freaked me out. But now that it’s happening, I’m just taking it one day at a time.
Earning a six-figure income is a goal for many Americans, but few actually achieve it. According to data from the U.S. Bureau of Labor Statistics (BLS), less than 7 percent of American workers are employed in occupations paying a median salary of $100,000 or more. However, in some parts of the country, earning six figures is practically a requirement to live comfortably.
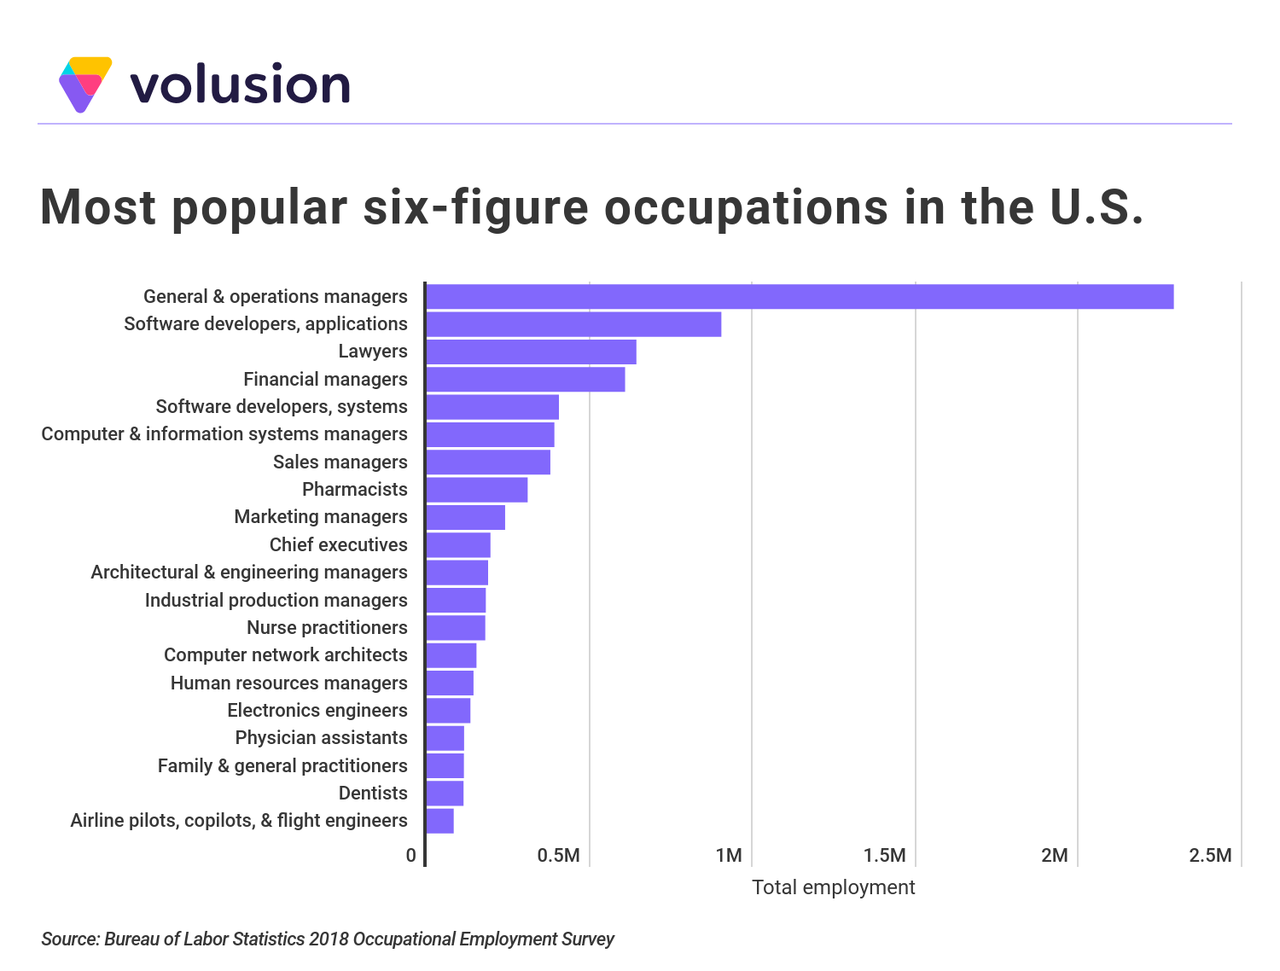
While the median earnings across all occupations in the U.S. is $38,640, some occupations pay far more. Nationally, general and operations managers are among the most popular occupations with median annual earnings over $100,000. Nearly 2.3 million American employees work as general and operations managers. Other six-figure jobs employing large numbers of Americans include tech jobs (software developers and computer and information systems managers) and jobs in the healthcare industry (pharmacists, nurse practitioners, and physician assistants).
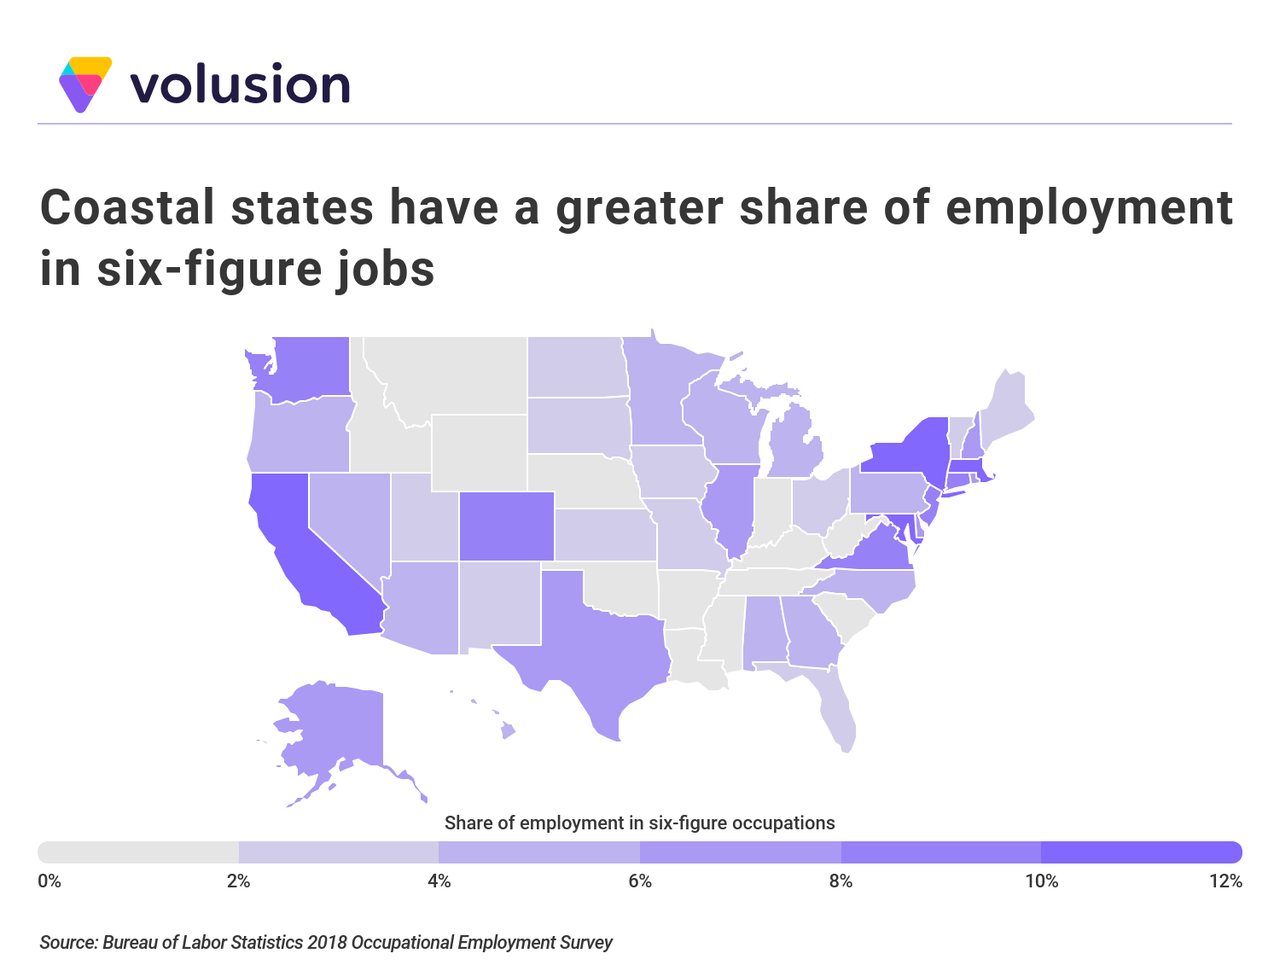
At the regional level, coastal states with higher costs of living tend to have more six-figure earners. Of all 50 states, California boasts the highest proportion of employees working in occupations with median earnings over $100,000, at 12.7 percent. Massachusetts and Maryland are close behind, with 12.2 percent and 11.9 percent, respectively. By contrast, Mississippi and Louisiana have the lowest share of six-figure earners in the country, with both states coming in at just over 1 percent.
To determine the U.S. metropolitan areas with the most six-figure occupations, researchers at Volusion analyzed data from the U.S. Bureau of Labor Statistics. Metros were ranked according to the share of employment in six-figure occupations—occupations with median annual earnings of $100,000 or greater. The researchers also calculated the percentage change in six-figure employment from 2015 to 2018, the total employment in six-figure occupations, the median annual wage across all occupations, the most over-indexed six-figure occupation, and the highest-paying six-figure occupation(s). The most over-indexed six-figure occupation for each metro was determined as the occupation that has the greatest difference in employment share when compared to that occupation at the national-level.
Only metropolitan areas with at least 100,000 people were included in the analysis. Additionally, metro areas were grouped into the following cohorts based on population size:
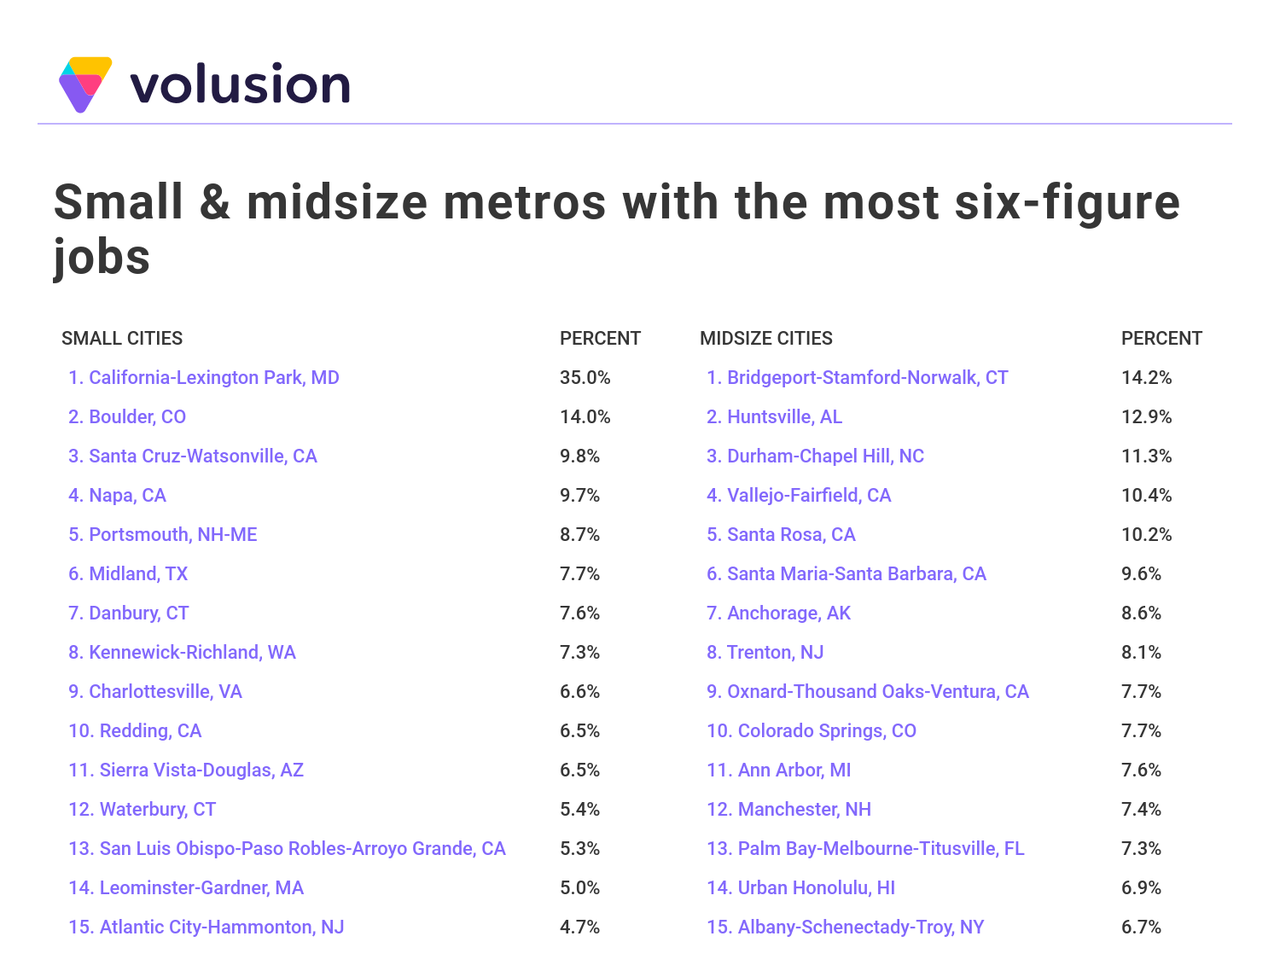
Small metros: 100,000-350,000
Midsize metros: 350,000-1,000,000
Large metros: more than 1,000,000
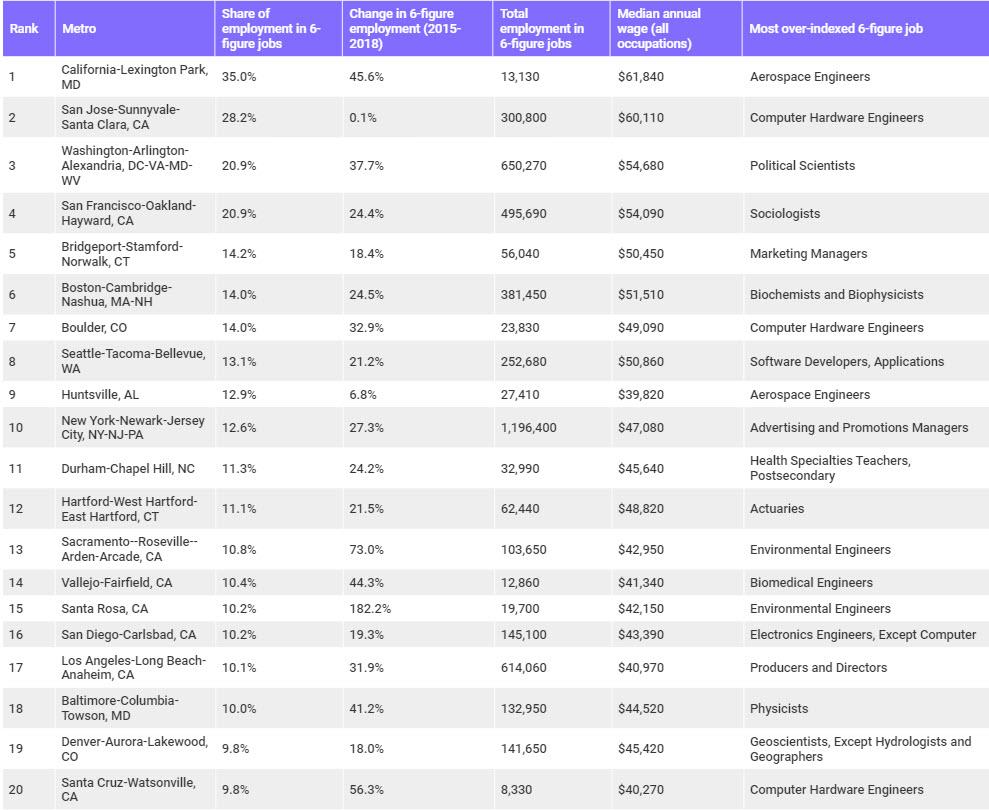
The Top 10 Large Metros With the Most Six-Figure Jobs
10. Los Angeles-Long Beach-Anaheim, CA
Share of employment in six-figure occupations: 10.1%
Percent change in six-figure employment (2015-2018): 31.9%
Total employment in six-figure occupations: 614,060
Median annual wage across all occupations: $40,970
Most over-indexed six-figure occupation: Producers and Directors
While the LA metro’s overall median annual wage is the lowest on this list, more than 10 percent of the LA metro area’s employees work in occupations with six-figure median wages. Los Angeles had a notable increase in six-figure employment from 2015 to 2018, at 31.9 percent. Producer and director is the most over-indexed six-figure occupation, which is not surprising given the prominence of the metro’s entertainment industry.
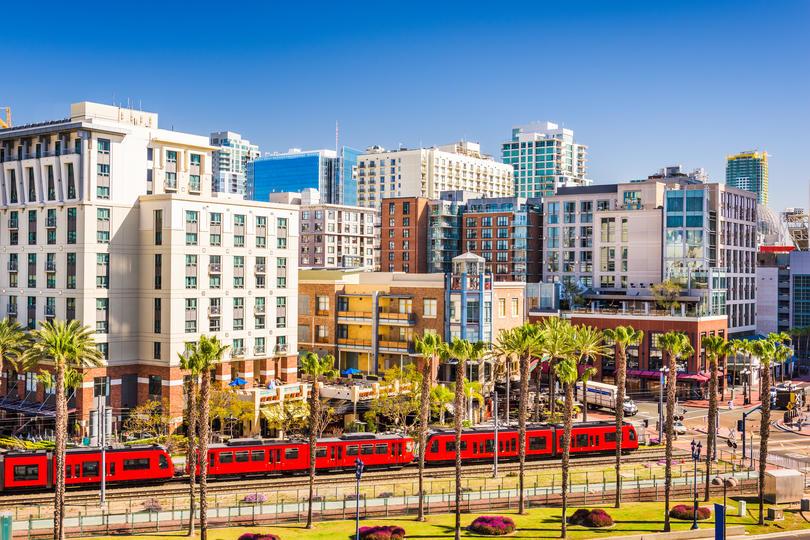
9. San Diego-Carlsbad, CA
Share of employment in six-figure occupations: 10.2%
Percent change in six-figure employment (2015-2018): 19.3%
Total employment in six-figure occupations: 145,100
Median annual wage across all occupations: $43,390
Most over-indexed six-figure occupation: Electronics Engineers, Except Computer
More than 145,000 residents work in six-figure jobs in San Diego, helping to offset the metro’s notoriously high cost of living. The tech industry is prominent in San Diego, and electronics engineers are over-represented when compared to the country as a whole. While the number of workers employed in six-figure jobs is increasing in San Diego (19.3 percent from 2015 to 2018), the increase is below the national average.
8. Sacramento–Roseville–Arden-Arcade, CA
Share of employment in six-figure occupations: 10.8%
Percent change in six-figure employment (2015-2018): 73.0%
Total employment in six-figure occupations: 103,650
Median annual wage across all occupations: $42,950
Most over-indexed six-figure occupation: Environmental Engineers
Highest-paying six-figure occupation: Orthodontists; Family and General Practitioners; Obstetricians and Gynecologists; Pediatricians; Psychiatrists; Surgeons; Nurse Anesthetists
The Sacramento metro area experienced a 73 percent increase in six-figure employment from 2015 to 2018. As the capital of California, the public administration sector plays a major role in the Sacramento economy. The area is also targeting clean technology and energy for economic development, which is reflected in the metro’s most over-indexed six-figure occupation—environmental engineers.
7. Hartford-West Hartford-East Hartford, CT
Share of employment in six-figure occupations: 11.1%
Percent change in six-figure employment (2015-2018): 21.5%
Total employment in six-figure occupations: 62,440
Median annual wage across all occupations: $48,820
Most over-indexed six-figure occupation: Actuaries
Highest-paying six-figure occupation: Family and General Practitioners; Internists; Obstetricians and Gynecologists; Psychiatrists; Surgeons
Over 11 percent of employees in the Hartford metro area work in six-figure jobs. Known as the “Insurance Capital of the World,” Hartford is home to seven major insurance firms, including Aetna, Travelers, and CIGNA. The insurance industry makes Hartford a good place to find work as an actuary, the area’s most over-indexed six-figure occupation.
6. New York-Newark-Jersey City, NY-NJ-PA
Share of employment in six-figure occupations: 12.6%
Percent change in six-figure employment (2015-2018): 27.3%
Total employment in six-figure occupations: 1,196,400
Median annual wage across all occupations: $47,080
Most over-indexed six-figure occupation: Advertising and Promotions Managers
Highest-paying six-figure occupation: Chief Executives; Oral and Maxillofacial Surgeons; Orthodontists; Anesthesiologists; Obstetricians and Gynecologists; Surgeons
The most populous metro area in the U.S., New York is known for being an expensive place to live. Therefore, it’s not surprising that the median annual wage across all occupations is higher than the national median, and the share of employees in six-figure jobs is almost twice the national average of 6.7 percent.
5. Seattle-Tacoma-Bellevue, WA
Share of employment in six-figure occupations: 13.1%
Percent change in six-figure employment (2015-2018): 21.2%
Total employment in six-figure occupations: 252,680
Median annual wage across all occupations: $50,860
Most over-indexed six-figure occupation: Software Developers, Applications
Highest-paying six-figure occupation: Chief Executives; Oral and Maxillofacial Surgeons; Anesthesiologists; Family and General Practitioners; Internists; Obstetricians and Gynecologists; Psychiatrists; Surgeons; Airline Pilots, Copilots, and Flight Engineers
The Seattle metro area is known for more than coffee and rainy weather. This tech hub also boasts a high proportion of employees working in six-figure occupations, at 13.1 percent. With major tech headquarters such as Amazon and Microsoft located in the Seattle area, it is not surprising that software developers are prominent.
4. Boston-Cambridge-Nashua, MA-NH
Share of employment in six-figure occupations: 14.0%
Percent change in six-figure employment (2015-2018): 24.5%
Total employment in six-figure occupations: 381,450
Median annual wage across all occupations: $51,510
Most over-indexed six-figure occupation: Biochemists and Biophysicists
Highest-paying six-figure occupation: Chief Executives; Oral and Maxillofacial Surgeons; Orthodontists; Anesthesiologists; Internists; Obstetricians and Gynecologists; Surgeons
Several of the top universities in the world (including Harvard and MIT) are located in the Boston metro area. Buoyed by these top research institutions and world-class research hospitals, Boston’s biotech industry is booming. The share of workers in six-figure jobs is also growing, with a 24.5 percent increase from 2015 to 2018.
3. San Francisco-Oakland-Hayward, CA
Share of employment in six-figure occupations: 20.9%
Percent change in six-figure employment (2015-2018): 24.4%
Total employment in six-figure occupations: 495,690
Median annual wage across all occupations: $54,090
Most over-indexed six-figure occupation: Sociologists
Highest-paying six-figure occupation: Chief Executives; Anesthesiologists; Family and General Practitioners; Internists; Psychiatrists; Surgeons; Nurse Anesthetists; Airline Pilots, Copilots, and Flight Engineers
With an increase of 24.4 percent from 2015 to 2018, the San Francisco metro has seen significant growth in the number of people working in six-figure occupations. Although San Francisco is known for its tech industry, the most over-indexed six-figure occupation is not in a tech field at all. In fact, sociologists are the most over-indexed occupation. Notably, the San Francisco metro area is home to several universities that attract workers in this field.
2. Washington-Arlington-Alexandria, DC-VA-MD-WV
Share of employment in six-figure occupations: 20.9%
Percent change in six-figure employment (2015-2018): 37.7%
Total employment in six-figure occupations: 650,270
Median annual wage across all occupations: $54,680
Most over-indexed six-figure occupation: Political Scientists
Over one-fifth of the metro area’s employees work in six-figure occupations, a figure that increased by 37.7 percent from 2015. Many of these workers—including an above-average number of political scientists—are either employed by or do business with the federal government.
1. San Jose-Sunnyvale-Santa Clara, CA
Share of employment in six-figure occupations: 28.2%
Percent change in six-figure employment (2015-2018): 0.1%
Total employment in six-figure occupations: 300,800
Median annual wage across all occupations: $60,110
Most over-indexed six-figure occupation: Computer Hardware Engineers
Highest-paying six-figure occupation: Chief Executives; Obstetricians and Gynecologists; Psychiatrists; Surgeons
Situated in the heart of Silicon Valley, the San Jose metro area has a large share of well-paying jobs. Over 28 percent of the area’s employees work in six-figure occupations, and the median wage across all occupations is the highest of all large metros at $60,110. Silicon Valley is one of the biggest technology hubs in the world, and indeed, computer hardware engineers are over-represented in the workforce.
Watch Live: President Trump Holds Another Coronavirus Press Conference
Three days after President Trump held his first White House press briefing on the coronavirus threat – where he appointed Vice President Mike Pence to be the administration’s “not-Coronavirus Czar”, before quickly clarifying that it wasn’t a demotion for HHS Secretary Alex Azar (rumored to be near the top of the president’s shit list) – Trump will hold another presser at 1:30 ET to discuss the coronavirus threat.
The presser is being held to discuss “the latest CoronaVirus developments”…
I will be having a 1:30 P.M. Press Conference at the White House to discuss the latest CoronaVirus developments. Thank you!
Earlier this morning, the FDA announced a new plan to speed up testing and loosen restrictions on local labs, a decision that will likely lead to a surge in newly confirmed coronavirus cases as the true scope of the outbreak in the US becomes apparent.
And don’t forget: State public health officials in Oregon, California and Washington State announced new coronavirus cases “of unknown origin” as others complained about restrictive CDC guidelines that slowed states’ ability to test new patients for the virus.
Falling equity markets this week are likely to signal the onset of a bear market, responding to a combination of the coronavirus spreading beyond China and persistent indications of a developing recession.
This has provoked a flight into US Treasuries, with the ten-year yield falling to an all-time low of 1.1141%. This will prove to be a mistake, given US price inflation which on independent estimates is running close to ten per cent, exposing US Treasuries as badly overpriced.
After this short-term response, much higher US Treasury yields are inevitable. Foreigners, who possess more dollars and dollar investments than the entire US GDP will almost certainly sell, driving bond yields up and the dollar down, leaving the Fed the only real buyer of US Treasuries.
This article goes through the sequence of events likely to destroy value in US financial assets and the dollar as well. And what goes for the US goes for all other fiat-currencies and their financial markets.
Introduction
In my last article I pointed out that the cumulative effect of central bank intervention has led to bond prices that have come badly adrift from reality. Taking a more realistic estimate of the dollar’s purchasing power than that implied in goal-sought CPI numbers, plus an estimated amount for the time preference involved, ten-year US Treasuries should yield closer to 10% to maturity, not the 1.31% implied today. If a ten-year bond has a coupon such that it is currently priced at par, the price should halve.
Those who put our monetary misfortunes down to the coronavirus have missed the point. Yes, it will be fatal, both economically and unfortunately for some of us as individuals as well. It is early days in what is definitely becoming a pandemic, that is to say an epidemic that is not restricted to national boundaries. Not only China, but other nations as well are going into a state of lock-down. Hopes that things will return to normal in the second half of this year are obviously based on a belief that there is nothing else wrong in the global economy.
This is where those who actually understand money and the credit cycle part from the economic establishment, which continuously demonstrates its cluelessness. Note these indisputable facts:
1. Economic destabilisation arises from a cycle of bank credit expansion always followed by a credit crisis. It does not arise from business, but from time to time the willingness of banks to expand credit out of thin air, creating a temporary period of economic optimism which does not last.
2. The expansion of the global money quantity since 2008 has been unprecedented, not only numerically, but in proportion to the size of underlying economies. If nothing else, logic suggests the bust that follows will be proportionately destructive.
3. While their relative magnitudes to each other were different ninety years ago, a combination of trade tariffs and the top of the credit cycle mirrors the conditions that led to the Wall Street crash between 1929 and 1932. That should be warning enough that even without a coronavirus pandemic the world is on the edge of not just a recession, but a vicious slump.
The most important difference between the Wall Street crash and the depression that followed is found in the money. In those days, both the US and UK currencies were on a gold standard, which meant that collapsing commodity prices through the dollar and sterling were effectively being measured against gold. Other factors, such as the rapid mechanisation of farming and the productivity that followed exacerbated the situation for farmers worldwide, until the UK abandoned gold in 1932 and the dollar was devalued the in 1934. In short, the link with gold meant that leading currencies were not undermined by the depression.
Nevertheless, economists in the 1930s blamed the depression on gold, and governments have sought to remove it from the monetary system. Since 1971 there has been no residual link between gold and the dollar and therefore all other state-issued currencies. The quantity of money in circulation has been free to be expanded by central banks, the only limit being the consequential limitation of price inflation. That has now been conquered by statistical method.
From their actions following the Lehman crisis it is clear central banks now feel no constraint on the expansion of the money quantity as a policy tool. The Fed, the ECB and the Bank of Japan are already expanding base money before the crisis stage of the credit cycle has materialised, which should alert us to the catastrophic failure of monetary policy. Keynes’s concept of reviving animal spirits with a kick-start of inflation has morphed into a continual and accelerating monetary inflation over the whole cycle.
Collectively, in the post-war years we all bought into monetary inflation by shifting investment allocation progressively from bonds into equities to protect long term savings. But since the interest rate spike in the early 1980s, bond yields have generally declined to the point where in dollars, euros and yen they yield less than their values of time preference. In the two latter cases investors are now even paying for the privilege of lending money to their governments.
The abolition of meaningful yields has been achieved through a combination of statistical suppression of price inflation and monetary expansion. But this is just the start of it. Imagine for a moment a collapse today akin to the 1929-32 Wall Street crash, followed by an economic slump on a 1930s scale. Freed from apparent restrictions on the expansion of money and having a mandate to do whatever it takes, combined with demands for the financing of soaring government budget deficits the expansion of money will go into hyperdrive – everywhere at the same time.
Not only do we have that problem, but we now have a viral pandemic that has all but shut down the largest manufacturing economy in the world, disrupting the overwhelming majority of supply chains elsewhere. And that assumes the coronavirus is contained to China and that early signs of it turning into a global pandemic turn out to be false. But the signs are that it is becoming a pandemic on the eve of Wall Street crash Mark II, bringing forward and amplifying the economic destruction that always follows a period of credit expansion. The effect of the virus threatens to turn an economic slump, perhaps a once in a century event, into an outright production and consumption collapse.
What lies before us will be radically different from the past. Understanding money and the effects of changes in it as a circulating medium have rarely been more important. This article outlines the effects of what lies ahead, likely to commence in a collapse of financial asset values and the purchasing power of currencies.
The Fed will lose control
The Fed’s monetary policy has been all about exercising control over markets, ostensibly targeting a rate of price inflation at 2% and maximum employment consistent with it. This power is continually abused in the name of neo-Keynesian economics, and monetary debasement has become a permanent feature of US Government financing since 2001. Consequently, US Government debt is now larger than GDP and financing it at heavily suppressed rates absorbs almost 40% of a trillion-dollar deficit.
The policy controllers at the Fed can least afford an out of control financial system to reflect realistic bond prices. With the Bureau of Labour Statistics having successfully tamed the inflation numbers, the Fed has managed to keep the lie alive about monetary inflation not being reflected in a declining purchasing power for the dollar and therefore higher bond yields. The Fed is not alone in this, but in a dollar reserve monetary system other central banks and their currencies are just bit players and a critique of US monetary and economic policies is sufficient for an understanding of what lies ahead.
The crucial question is over the likelihood that having distorted markets to the point where government debt is now substantially overpriced, can the authorities maintain the illusion?
So far, there have been two classes of economic actors which have supported this overvaluation.
The first is foreign investors, in the main building an accumulation of dollars and dollar investments through the US trade deficit. As the US economy grew along with the government’s unfunded spending, foreign owned securities, short term paper (less than one year) and correspondent bank balances amassed to the tune of about $24.8 trillion, which is more than the US’s nominal GDP. Furthermore, since the date of the last annual TIC survey, the value of foreign-owned securities will have increased even more due to higher portfolio valuations.
We can see two reasons for these flows to reverse.
The first is the global economic slowdown, particularly in international trade. A deteriorating trade outlook reduces the required cushion of holding dollar liquidity, encouraging traders to stop accumulating them, or even to see them winding them down to support ailing cash flows in their businesses back home. Foreign governments are also increasingly questioning the dollar’s reserve role in a world that has radically changed over the last forty years, encouraging Asian central banks to reduce the dollar component in their reserves.
The absence of foreign investors, who in the past have absorbed almost all of the increase of new US Treasury debt as a counterpart of the trade deficit, will be a considerable headache for the Fed at a time of rising US Government funding requirements.
The second class of economic actor is hedge funds, which through the fx swap market profit from the yield differential between US Treasury bills, or coupon-bearing bonds, and negative interest rates in euros and yen. Since the dollar’s trade-weighted index began to strengthen shortly after President Trump took office, these positions have increased as hedge fund managers saw this as a slam-dunk trade. But its profitability depends on a stable or rising dollar, and any sign of that being reversed will to lead to a substantial unwinding of positions to the detriment of the dollar.
Demand for liquidity to provide fx swaps for the hedge funds is one of the two reasons the Fed has been forced to aggressively enter the repo market, the other being the increasing amounts of Treasury bills and bonds accumulating as inventory at the prime brokers. While foreign demand for dollars has cooled, which was formally supplied directly or indirectly by bank credit expansion, the liquidity pressures in the New York money markets have increased in the absence of this source of liquidity, threatening the Fed’s control over interest rates, as the spike in the repo rate to 10% last September illustrated.
Clearly, without the Fed injecting tens of billions of dollars into the repo market interest rates would be far higher than the Fed Funds Rate, currently pegged at 1.5-1.75%. But this can only be a temporary fix, lasting so long as the dollar maintains its value in the foreign exchanges. And if the dollar begins to slide, whether foreigners or the hedge funds are responsible is immaterial. It will mark the start of a reassessment of US monetary policies by the markets becoming acutely aware that they have failed, and the Fed is boxed in.
For a time, the Fed can pretend that the economic slump and/or the coronavirus justifies an acceleration of money-printing, most likely through quantitative easing. They will cite the demand-driven outlook for core inflation and unemployment. But when the vote from the foreign exchanges is a no-no, that will only wear for so long. Markets will eventually realise that the only buyer for increasing quantities of Treasury debt at these yields is the Fed itself through the mechanism of QE. It will be foreigners who will likely be first to abandon the Fed’s managed market environment, and a dollar crisis will ensue. And with a dollar crisis there will also be a crisis in the US bond market.
Portfolio effects
So far, markets have just begun to wake up to the likelihood of a slump induced by the coronavirus. A thousand-point decline in the Dow last Monday was probably the break point in the concept of low bond yields being good for equities on a relative return basis. Suddenly, equities are being associated with risk, raising the ghost of October 1929 when markets began the first phase of the Wall Street crash.
Today’s children of inflationism that pass for investment managers have responded in the only way they know by reallocating portfolio exposure in favour of perceived safety by buying US Treasuries, driving the 10-year bond yield down to 1.31%, significantly less than the 13-week T-bill rate of 1.48%. Initially, this appeared to be partly at the expense of investment allocations in favour of foreign investments, strengthening the dollar in recent days.
Given that an economic slump with or without a spreading coronavirus will lead to a rapidly increasing government budget deficit that can only be funded by inflationary means, the collapse in bond yields will likely be short-lived. If the dollar begins to be sold in the foreign exchanges a reassessment will take place. Then the pace of liquidation of dollar-denominated securities by foreign owned portfolios is bound to increase, bearing in mind that they totalled $19.4 trillion, plus $5.3 trillion in liquid short-term securities and correspondent banking deposits at the last count. Hedge funds will also be reducing their fx swaps, adding further pressure on both the dollar and US Treasury bond prices.
Selling pressure on the dollar is likely to be measured in several trillions. Having suppressed the evidence of the fall in the dollar’s purchasing power in the internal economy, domestic investors imagine the Fed can continue to hold the Fed Funds Rate at close to the zero bound while they more or less singlehandedly fund the government’s deficit. What will make this impossible is a fall in the dollar’s exchange rate driven by foreign selling, even measured against fiat currencies with interest rates below zero. Commodity prices will begin to rise reflecting dollar weakness, despite falling real demand. And dollar hedges, such as gold, silver and even bitcoin will rise even more strongly. The risk hedge for US citizens will not be US Treasury stock, but precious metals and imported commodities.
When the Fed loses control there will be substantial losses for those currently seeking the safety of US Treasury bonds. It will be a double hit, not only through rising bond yields, but through a falling dollar making it vital for any foreign entity to liquidate portfolio and dollar positions while it can.
Beware of the bear
It is common practice to regard portfolio investment as entirely separate from day-to-day spending. The distinction is false in the sense that financial investments only exist because the attraction of prospective returns make it worthwhile for consumers to divert some of their income from current consumption. This is important, because rising prices for financial assets requires sustained money inflows. If people on balance stop investing prices fall.
This fact undermines the assumption that in a bear market a portfolio with a valuation of a million can simply rearrange that million into different investments to preserve value. In a bear market, a significant portion of it simply disappears without any transactions taking place. Bond and stock prices fall across the board, leaving an investor wondering what to do with the balance.
Having been occasionally brutal, recent equity bear markets have been little more than indigestion in a continual inflation-fuelled bull market. The bear now due promises to be different. Hanging on in hope of better days has worked favourably for investors in the past eventually, but maybe not this time, because the scale of bond mispricing is without precedent. The Fed and other central banks believe they can handle a mild to moderate recession but have no leeway to handle anything worse. If the dynamics behind the 1929 market crash and the depression that followed are a template for today’s markets, what will evolve in the coming months will break the Fed’s control over financial markets.
In that case, fortunes will be lost. Ordinary investors who have handed investment responsibility to investment managers and financial advisors have thereby proved themselves incapable of taking an investment decision. They will lose their nest-eggs because their appointees are either perpetual bulls or simply brainless when it comes to investing. They all talk of diversifying, which means buying a synthetic index, or investing in funds that cover so many companies as to be similar. None of them have experienced a proper bear market, where nearly every bond and equity investment collapses. The Wall Street crash wiped out 89% of the value of the Dow. That should be our guidance.
Driving it will be a bear market in US Treasuries. As fleeing foreigners sell their holdings and their dollars, the single buyer of them (the Fed) will be forced to raise interest rates. But if the Fed persists in funding the government deficit at suppressed rates, foreigners will merely accelerate their liquidation of dollars and dollar-based securities. Britain faced similar conditions in the 1970s, when the UK Treasury was always behind in its funding until it was forced to jack up gilt coupons, as far as 15¼ per cent. Sterling fell from $2.62 in March 1972 when equities peaked to $1.59 in 1976, and then fell further close to parity in 1985. And that was against a dollar that was also losing purchasing power. In the 1972-75 bear market, UK equities fell by 72% measured by the FT-30 Share Index.
In an economic slump, the ability of investors to hang on to their rapidly falling investments is compromised by rising unemployment. The flows from portfolio liquidation into the underlying economy are required to maintain body and soul. Furthermore, with the dollar’s loss of purchasing power being accelerated due to selling by foreigners, domestic living costs becomes more expensive.
Stage two for the collapsing dollar
With foreigners owning a combination of cash and securities valued at about $24.8 trillion and hedge funds short of euros and yen perhaps to the equivalent of a further four or five trillion dollars equivalent, a change in financial market conditions seems almost certain to trigger an avalanche of dollar selling. US ownership of foreign securities is less that half that at $11.3 trillion (Dec 2018), with foreign currency deposits and CDs the equivalent of $618bn. While Americans are bound to liquidate some of these foreign holdings in a slump, it will not be sufficient to offset foreign selling of the dollar.
By driving the dollar down, pressure will be put on domestic prices to rise. This will make the Fed’s position of funding government debt through QE at rates linked to a suppressed Fed Funds Rate untenable. Markets will be making their own assessment, instead of the Fed’s, when it comes to securities pricing. Given there will be a growing realisation that prices will then be rising at a faster rate than the annual 10% rate currently estimated by independent analysts, government finances and their funding will demonstrably be spiralling out of control.
It will be a systemic collapse centred not on an element of the private sector as was the case with Lehman, but of the entire government apparatus. With it will be a public realisation that the full faith and credit of government is the only thing that stands between the dollar’s value of the day and its value on the morrow. Increasingly, members of the population will be likely to regard the residual values of their financial assets as a source of funding for necessities, the dollar being little more than a collapsing bridge between the two.
Those prescient enough to anticipate these events will be hedging not into US Treasuries, which in truth offer no security with government funding almost certain to spin out of control, but into gold, silver, perhaps bitcoin and related investments. They will realise it is time to give up on the Fed’s put, or any other government guarantees because they have become worthless.
To President Trump’s chagrin, public health officials on the west coast warned that the cases are evidence that community outbreaks have already begun in Northern Cali, Oregon and Washington State. So if you were planning on traveling to the Pacific Northwest any time soon…you might want to reconsider.
In Europe, the Middle East and the Far East, we saw a rash of new cases overnight (including the first case in Qatar) nearly doubled on Friday to along with news of more cancellations of sports games, concerts and public events. France has temporarily banned all public events involving more than 5,000 people. Health Minister Olivier Véran announced the decision after an emergency government meeting on Saturday.
Veran also confirmed 16 new cases of coronavirus on Saturday, bringing the country’s total taking to 73 since the outbreak began. Two patients have died, a 60-year-old French teacher and an 80-year-old Chinese tourist. On Friday alone, the number of confirmed cases nearly doubled.
Across France, all gatherings of more than 5,000 people in confined spaces will be cancelled.” The same applies to events “in an open environment where people can mix with others from areas where the virus is possibly circulating,” according to France24.
South Korea reported more than 800 new coronavirus cases on Saturday, the biggest jump of any country, and twice the number reported yesterday by Chinese authorities in Hubei. Unsurprisingly, the increase was mostly concentrated in Daegu, the epicenter of the outbreak in South Korea.
But the biggest news Saturday morning was in the US, where the FDA released sweeping new guidelines speeding up hospitals’ ability to test for the virus, appearing to resolve an issue about which public health officials, epidemiologists and labs from NYC to Cali had loudly complained. According to WaPo, some experts are worried that these new measures will still fall short. We suspect we will soon know for certain if the changes were effective, or not.
Elsewhere in the US, while much of the focus so far has been on the west coast, local media outlets reported on Saturday that a suspected coronavirus patient has been isolated at Bayshore Medical Center in Holmdel, New Jersey, as the hospital awaits the results of a test, which could take a few days.
The patient has yet to test positive, but is showing suspicious symptoms, the hospital said. It continues to screen all patients who have recently visited hot zones, or who are showing suspicious symptoms.
Iran’s Official Covid-19 Infected Rises To Nearly 600 As US Slightly Eases Sanctions
A nationwide lock-down in Iran continues, or we could say at this point merely that the Iranian Health Ministry is urging people to stay home, after Friday prayers were canceled in 23 cities across the nation, and as the official death toll acknowledged by Tehran has risen to 43, with total number of infected jumping to 593.
This after on Friday a team of journalists working for BBC Persia said they had confirmed at least 210 virus-linked deaths in Iran after canvassing workers at dozens of hospitals around the country, further suggesting a cover-up on a massive scale in the works.
Other reports poking holes in Iran’s downplayed official coronavirus narrative suggest the number of total infected could be as high as 18,000, such as this bombshell Daily Beast report. Iran has firmly denied that it’s withholding information, and it also may be due to lack of widespread testing, among other reports the elite IRGC is cracking down on doctors, saying to keep their mouths shut.
Image source: AFP
Tellingly, at least seven high government officials were reported infected this week, including the vice president, as well as a well-known former ambassador to the Vatican and Egypt, who died of the disease.
Reports on Saturday suggested that number has grown to at least 8, after it was reported overnight that an Iranian member of parliament, Mohammad Ali Ramazani, had also died of Covid-19.
However, the Iranians are now vehemently denying his death or that he was ever confirmed with the infection, according to The Independent.
Regardless, The Independent reports further that the situation remains dire, also as governments in the gulf region struggle to prevent Iranians or anyone who’s been traveling in Iran from entering their borders:
It came as a health ministry spokesman said the new coronavirus had killed 43 people in the Islamic Republic, with 593 confirmed cases.
“Unfortunately nine people died of the virus in the last 24 hours,” Kianush Jahanpur told state TV. “The death toll is 43 now.
“The new confirmed infected cases since yesterday is 205 that makes the total number of confirmed infected people 593.”
Currently, schools remain closed nationwide until at least Tuesday, with a further ban on mass gatherings such as concerts and sporting events for the next week.
Meanwhile, a number of reports have analyzed the impact of US sanctions on Iran’s coronavirus crisis – the hardest hit country outside of China. The National Interest reported that the White House has responded to this criticism.
“The Trump administration is partially reversing course on economic sanctions that have slowed down Iran from importing coronavirus test kits as the country faces down the most deadly COVID-19 outbreak outside of East Asia,” according to the report.
Iranian leaders have blamed Washington for the worsening crisis, given the limited ability to import virus testing kits and equipment and medicines.
“The U.S. Treasury announced on Thursday morning that it was lifting some terrorism-related sanctions on the Central Bank of Iran, which re-opens a channel for humanitarian trade that had been closed since September 2019,” The National Interest said further.
The annual growth of the working-age population is the organic baseline for growth in national, regional, and global consumption.
However, since World War II, interest rate policy has moved inversely of annual working-age population growth, to incent ever more debt as working-age population growth has decelerated to nothing.
Interestingly, total annual change in energy consumption has mirrored annual working-age population growth.except where synthetic growth has been temporarily substituted to maintain the appearance of growth (aka, China).
Eventually, the inorganically rising consumption and asset prices will return to their organic baseline.and that will be a very rude new dawn for those who believed in infinite growth.
The 1st world economy lives within a fractional reserve banking system. In a fractional reserve system, one persons debt is the systems new money, as money is lent into existence. At a progressive rate since 1980, it has been the combination of decelerating working-age population growth, declining interest rates, and ramping utilization of privately loaned debt that has simultaneously been the basis for increasing consumption and the creation of new money. As borrowers undertook new loans prior to 2008, this borrowing was the primary means of monetary growth. However, the changing demography since 2008 has changed everything as population growth has shifted from young to old…and federal governments and central banks have taken over money creation via monetization resulting in asset inflation.
New debt is primarily undertaken in the 1st world nations where income and savings are higher but also credit is readily available and standards for this credit vary widely, by asset type (zero for student loans, low for vehicles, moderate to high for homes…since ’07).
It is primarily the working-age population that undertakes new debt while those in the post working age population tend to deleverage and pay down existing loans (this has the opposite monetary effect of destroying money).
From 1950 to 2008, it was the significantly larger developed world growth of the working-age population over that of the post working-age population that supported new debt, money creation, and rising asset prices…the current and future reversal of these proportions is the likely rationale for federal governments and central banks to engage in ZIRP, NIRP, QE, and other activist / experimental policies to offset the demographic driven collapse in the money supply.
The lending amid the declining working age population among the developed world and the decelerating growth among Asia cannot be made up by accelerating demographic growth in Africa. Global inequality and lack of broadly shared wealth means Africa hasn’t the income, savings, and/or access to credit to provide significant global demand.
So, it’s the growth of the working-age population in the developed world that is critical for the growth of money within a fractional reserve system. And that working-age growth need be significantly greater than the growth of the credit averse post working-age population. Growth among the working-age population in Asia (excluding East Asia + Singapore) and/or Africa has relatively little impact as the vast majority there have relatively little income, savings, and/or access to credit. I divide the world into three mega-regions: developed world, Asia, Africa.
They consist of the following and as of 2020, with following proportions…
Developed World = Western Hemisphere, Oceania, West/East Europe Including Russia), East Asia (China, Japan, Taiwan, S/N Korea)
47% of global working age population but -4% of annual growth in global working age population
By 2030, developed world will represent -31% of annual growth in global working-age population
By 2040, developed world will represent -19% of annual growth in global working-age population
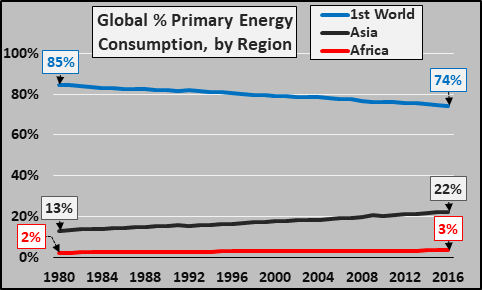
1st world is 74% of global energy consumption
Asia = (South Asia, Middle East, Central Asia)
39% of global working-age population but 61% of annual growth in global working-age population
By 2030, Asia will represent 59% of annual growth in global working-age population
By 2040, Asia will represent 34% of annual growth in global working-age population
Asia is 22.5% of global energy consumption
Africa
14% of global working-age population but 42% of annual growth in global working age population
By 2030, Africa will represent 72% of annual growth in global working-age population
By 2040, Africa will represent 85% of annual growth in global working-age population
Africa is 3.5% of global energy consumption
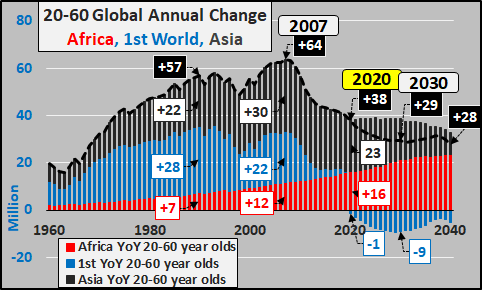
Global Working-Age Demography:
The chart below shows total annual growth (in millions) among the 20 to 60-year-old global population.
Global annual growth of working age adults peaked in 2007. Since then, annual working age population growth has been decelerating, and by 2030 will be less than half the peak annual growth. What growth remains has shifted to the poorest and turned to outright declines among the relatively wealthier nations.
Annual working-age growth in the 1st world has ceased as of 2020, and now outright progressively larger declines will be a secular feature indefinitely.
Annual growth among Asia is decelerating and will continue to decelerate indefinitely.
Annual growth in Africa is accelerating and will do so through mid-century.
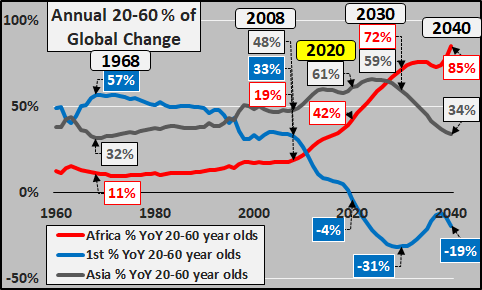
The second chart breaks out the geographical location of the annual 20 to 60 year-old total population growth. This is so critical, because again, it is the far higher incomes, savings, and access to credit among the 1st world working-age population that drives consumption, debt, and resultant money creation (via fractional reserve banking).
Note that the majority of working age population growth was in the 1st world through 1995 and 1st world growth remained a strong feature until 2008. From 2008, the inevitable decline of the 1st world working age population (given the previous decades of declining births and fertility rates…see charts at article end), has meant a collapsing portion of working age growth in the 1st world. And as the chart below details, this 1st world decline is about to get far more severe. Note the portion of growth in Asia will soon peak and begin decelerating rapidly. This leaves a ramping portion of the working age population growth in Africa. This is so important as the population growth of the working-age in Africa is among those with the lowest global incomes (less than 1/10th those of the first world), minimal savings, and little to no access to credit. This African working age population growth is like multiplying a large number against a tiny fraction. There is little monetary capability for consumption or credit driven demand…there is also no money multiplier.
Impact of Working-Age Demography on Energy Consumption:
Next, I use total energy consumption as the best proxy for real economic capacity and demand. The chart below again splits the world energy consumption among the 1st world, Asia, and Africa (primary energy consumption equals all oil, natural gas, coal, nuclear, and renewable energy consumed in each region). What should be abundantly clear is the 1st world is consuming energy far beyond their share as a population, Asia rising but still far below that of the 1st. Also noteworthy is the sustained minimal energy consumption of Africa.
Next, looking at energy consumption as a percentage of total consumption by region. Note the percentage growth of consumption in Asia, inverse deceleration of the 1st world energy consumption, and the near non-existence of Africa as a global energy consumer. Africa has consistently consumed only 2% to 4% and shows no signs of imminent increase.
It is clear the 1st world plus Asia do nearly all the consuming (96.5% of the global consuming…true for energy, true for exports, etc.) and these trends show no imminent signs of change and actually it appears with the deceleration taking place in the 1st world, Africa is decelerating with them (details at end of article). The impacts of the current potential pandemic will only exaggerate the already baked-in decelerations/declines.
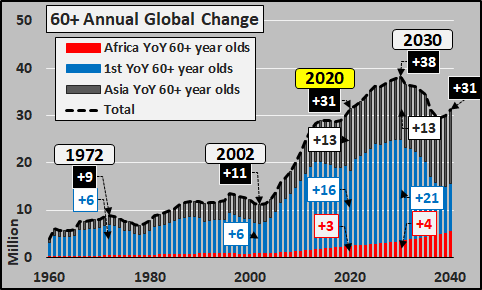
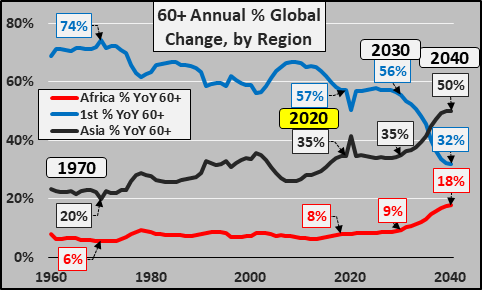
Elderly Global Demographics:
But what of the deleveraging elderly?
The next chart focuses on the break-down of the annual 60+ year-old global population growth. As of 2020, the share of elderly (60+ year-olds) around the world is highly skewed to the 1st-world with the following proportions:
1st-world; 65% of 60+ year-olds, 57% of annual growth in elderly
Asia; 28% of 60+ year-olds, 35% of annual growth
Africa; 7% of 60+ year-olds, 8% of annual growth
60+ year-old annual growth will peak in 2030 and begin decelerating thereafter with annual growth shifting away from first world to Asia and Africa.
Below, the breakdown by region of the still surging growth in 60+ year-olds. At present, the growth is trending toward Asia and away from the 1st world…however, sometime after 2030, the portion of growth in Africa is projected to begin rising and 1st world growth decelerate significantly.
So, by 2030…
Global working age population growth will slow by 45%
Global working age population growth will shift almost entirely to Africa, decelerate in Asia, and continue declining in the 1st world
Global growth in elderly will continue surging, particularly in the 1st world and Asia The impacts on credit/debt utilization and consumption among the declining 1st world working age population should be severely negative with little to no chance for the growth in Africa to overcome the collapsing 1st world demand. With this situation, a negative feedback loop is established for real assets such as homes, commercial real estate, consumer goods (cars, phones, appliances, etc.) and the factories and supply chains that support these. A global decline in real consumption is highly likely as these demographic trends play out and secular economic depression will be the primary feature for decades.
This is the siren song to the central banks to artificially create inflation through monetization rather than rising demand. The current rising asset prices via monetization and interest rate policy misuse is only worsening the eventual workout and rebalancing of the system.
Erdogan: Expect 30,000 Refugees At Europe’s Borders Saturday After Turkey ‘Opened Gates’
Despite a 2016 agreement with the EU to stop refugee flows out of Turkey, President Recep Tayyip Erdogan said on Saturday that 18,000 refugees stood ready along Turkish borders with Europe to pour into the continent.
In his first public comments since Thursday’s deaths of 33 Turkish troops in Idlib, likely by a Russian airstrike (though Ankara has preferred to blame Syrian forces), Erdogan said this number willlikely climb to as many as 30,000 on Saturday.
Migrants arriving in Greek islands, via EuroNews.
“We are not in a situation to handle a new wave of refugees” from Syria, he said, after previously threatening repeatedly to “open the gates” on the over 3 million Syrian refugees Turkey is hosting.
It looks like he’s now making good on this threat, though questions remain over if this is truly the beginning of a 2015 level flood, or a foretaste of what could come:
“We will not close these doors in the coming period and this will continue. Why? The European Union needs to keep its promises. We don’t have to take care of this many refugees, to feed them,” Erdogan said.
He also reiterated and underscored that some 1.5 million refugees were ready to exit war-torn Idlib amid the Syrian-Russian offensive intensifying in the south of the province. Turkey is now in an open war situation with the Syrian Army, claiming to have killed scores of Syrian national troops and paramilitary forces over the last days.
VIDEO: 🇬🇷🇹🇷 Migrants arrive on the Greek island of #Lesbos from Turkey, after Turkish officials said Ankara would no longer prevent refugees from going to Europe pic.twitter.com/BmYRzUyP5n
Turkish officials initially announced after Thursday’s attack devastated Turkish troops that they would unseal the Turkish-Idlib border for up to 72 hours, allowing refugees transit through Turkish territory and into Europe.
They also had announced that police, coast guard and border security personnel had been ordered to “stand down” starting overnight on Thursday.
Buses were even seen staged in Istanbul to facilitate this. Evidence emerged throughout Friday that Turkish authorities were indeed actively pushing groups of refugees toward Greece, while Greece announced emergency security measures and a military response to block illegal entry, also sealing its main land cross with Turkey at Kastanies to all inbound.
Another video shows refugees bussed from Istanbul to the border area with Greece.
This has, not for the first time in recent years, left hundreds reportedly stranded at the border crossing between the Turkish and Greek sides, neither side allowing entry.
Refugees have reached the Turkish Greek border close to #Edirne & now they are stuck there.
They cant go back to Turkey becaue Turkish soldiers are not allowing them.
And they cant move forward because Greece isnt allowing them.
The Turkish side is said to be actively pushing refugees and migrants into the ‘no man’s land’ border crossing area in order to provoke a crisis for the cameras, in a message to the EU, NATO and Washington.
#Evros now : more than 3.000 migrants and refugees hoping to break through Greek block at Kastanies crossing: for those of us who lived it, the nightmare of #Idomeni has revived. Is it too much to ask from @EU_Commission and @Frontex to give Greece a helping hand ? pic.twitter.com/rrb3iGGnZ3
Despite Erdogan touting in his speech that 18,000 to up to 30,000 are now en route toward the EU, Greek government officials have confirmed no where near that amount, but is witnessing an initial wave of thousands attempting to enter.
In Athens, government spokesman Stelios Petsas said that more than 4,000 migrants have been prevented from crossing into Greece from Turkey and there have been 66 arrests.
“Greece was the target of an organized. mass, illegal attempt to violate its borders and has withstood it,” Petsas told reprters Saturday after an emergency meeting of ministers at the Prime Minister’s office.
Refugee transport bus reportedly organized by Turkey’s government out of Aydin in the western part of Turkey.
Ekathimerini newspaper also reported that military commandos and significantly beefed up land and sea patrols had been authorized by Athens.
Greek Prime Minister Kyriakos Mitsotakis vowed that“no illegal entries into Greece will be tolerated” – noting greatly tightened security along the EU’s external borders.
Meanwhile, NATO and the EU have called on Erdogan to honor Turkish commitments to halt flows of refugees into Europe, obviously to no avail.
New coronavirus cases confirmed in the Pacific Northwest suggest the new virus may be spreading in the community in the United States, officials said.
Washington state, Oregon, and California officials confirmed in total four new cases on Friday. Officials do not know where or how three of the patients became infected, making them “possible” instances of community spread, according to the Centers for Disease Control and Prevention (CDC).
Community spread means that people acquire COVID-19, the disease caused by the new virus, through an unknown exposure in the community.
The first case of unknown origin was confirmed on Feb. 26 in northern California. Three more were reported on Feb. 28.
“There was no known travel exposure for this individual. So, this is a case of community spread of the disease, much like the case from California earlier this week,” Pat Allen, director of the Oregon Health Authority, told reporters on Friday.
“This new case indicates that there is evidence of community transmission but the extent is still not clear,” Dr. Sara Cody, health officer for Santa Clara County, California, said in a statement.
Health officials in the county reported that an older woman with chronic health conditions was tested after going to the hospital with a respiratory illness. The patient “does not have a travel history nor any known contact with a traveler or infected person,” according to county officials.
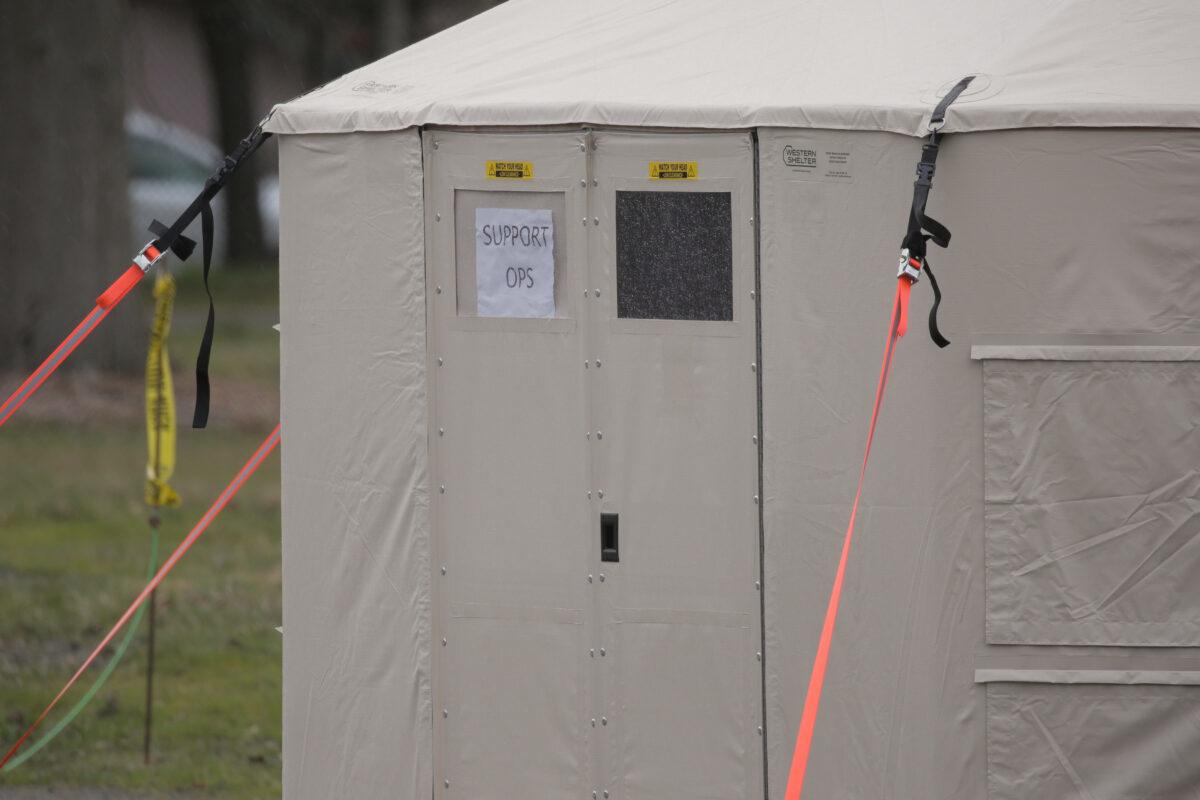
A support operations tent is seen at a earmarked quarantine site for healthy people potentially exposed to novel coronavirus, behind Washington State Public Health Laboratories in Shoreline, north of Seattle, Washington, on Feb. 28, 2020. (David Ryder/Reuters)
“I understand this may be concerning to hear, but this is what we have been preparing for. Now we need to start taking additional actions to slow down the spread of the disease,” Cody said.
Authorities in Oregon reported the state’s first case of COVID-19. The adult patient has no travel history to a country where the virus was circulating nor did they come into close contact with another confirmed case, state officials said.
“As such, public health officials are considering it a likely community-transmitted case, meaning that the origin of the infection is unknown,” the Oregon Health Authority said in a statement.
The patient spent time in the Lake Oswego school district and patients and staff members there may have been exposed to the virus, according to the authority. Officials will try to locate the people the patient came into contact with.
Washington state health authorities said two people—a woman in her 50s and a teenage boy—tested positive for the new disease. The woman traveled recently to Daegu, South Korea, which saw an explosion of cases in recent days, but the teen has no travel history and officials don’t know the source of his infection.
A woman wears a mask on Wall Street near the New York Stock Exchange in New York on Feb. 28, 2020. (Brendan McDermid/Reuters)
The teen visited Seattle Children’s North Clinic on Feb. 24 and attends Jackson High School in Mill Creek. The Everett Public Schools superintendent decided to close the school on Monday to allow three days of “deep cleaning,” the Washington State Department of Health said.
Officials expect to find more cases of community transmission, Dr. Chris Spitters, interim health officer for the Snohomish Health District, said at a press conference on Friday night.
The four new cases were confirmed by the states using tests developed by the CDC. States received the testing kits early this month but most couldn’t use themuntil Friday.
The positive cases are considered presumptive pending confirmatory testing by the CDC, which is required through an Emergency Use Authorization. But the CDC and state and local public health officials are treating the cases as if they were confirmed.
Local officials attributed the detection of the cases to the new tests, which cut days off the testing process. States and local labs that couldn’t test locally previously had to spend hours packaging samples before shipping them to the CDC’s Atlanta headquarters. The Oregon State Public Health Laboratory used the new testing kit just hours after validating it, Oregon officials said.
Authorities also said they expect additional cases, a message that has been repeated by both state and federal officials.
The CDC’s laboratory test kit for the new coronavirus. (CDC via AP)
“Given the extent of global spread, we expect to identify more individuals with COVID-19 in Washington,” Washington Health Officer Dr. Kathy Lofy said at a press conference.
Federal officials warned earlier in the week that community spread of the new virus was likely, citing the spike in cases in South Korea, Italy, and Iran.
“It’s not so much a question of if this will happen anymore but rather more a question of exactly when this will happen and how many people in this country will have severe illness,” Dr. Nancy Messonnier, director of CDC’s National Center for Immunization and Respiratory Diseases, told reporters in a phone call on Wednesday.
Federal officials are using an in-depth report produced by its researchers in 2017 as a roadmap for how to deal with the virus. Without a vaccine or proven treatment, officials are focusing on nonpharmaceutical interventions, which fall into three categories: personal, community, and environmental.
Personal interventions include routine recommendations such as washing hands and staying home when sick, and measures specific to pandemics such as people voluntarily isolating themselves at home even if they’re not sick if a member of their household has become ill.
Community interventions can include closing schools and transitioning to internet-based teleschooling and changing business meetings from in-person to online as well. Some locales could postpone or cancel large gatherings.
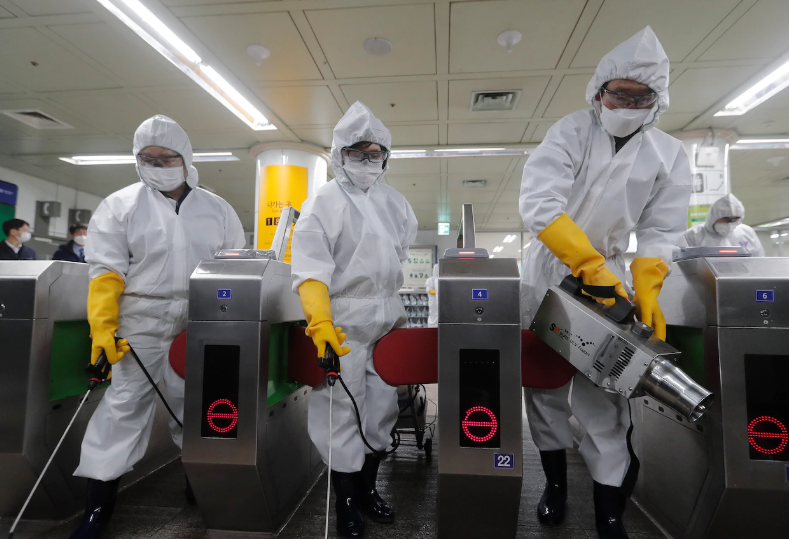
Environmental interventions primarily revolve around cleaning surfaces. The school closing for cleaning is an example of an environmental intervention.
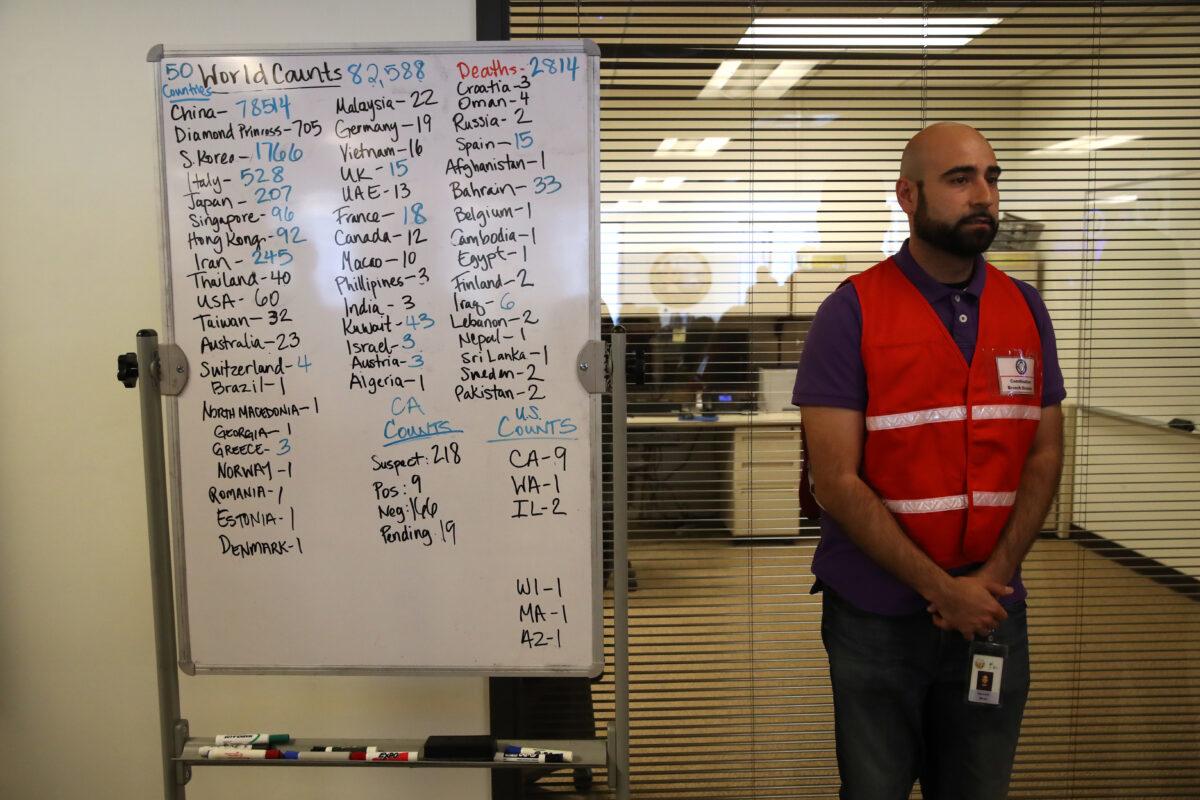
Narimon Mirza stands next a to a whiteboard showing the number of COVID-19 cases around the world at the Medical Health and Coordination Center at the California Department of Public Health in Sacramento on Feb. 27, 2020. (Justin Sullivan/Getty Images)
Americans, Messonnier said, should start preparing for “significant disruption” to their lives.
The new virus emerged in China late last year and has spread to dozens of countries, infecting patients in over a dozen countries for the first time this week alone. The virus spreads primarily through close contact and through respiratory droplets produced when an infected person coughs or sneezes. Patients who test positive are typically isolated in hospitals or at home. The origin of the virus isn’t known. Coronaviruses often circulate in animals and only in rare cases jump to humans before being transmitted between people.
Symptoms of the virus are similar to the flu and include fever, headache, and a dry cough. The incubation period is believed to be one day to 14 days.
Experts recommend people frequently wash their hands with soap and water for at least 20 seconds, especially going to the bathroom, before eating, and after blowing their nose, coughing, or sneezing. Other prevention techniques include avoiding close contact with sick people, cleaning and disinfecting frequently touched objects and surfaces, and not touching one’s eyes, nose, or mouth with unwashed hands.
People who show symptoms should isolate themselves at home and call health authorities or their healthcare provider. Family and household members should try to stay at least 6 feet away from sick people.
No Banker Goes To Jail – Former Barclays Executives Acquitted Of Fraud
Days after Wells Fargo agreed to pay $35 million to settle regulatory claims that its financial advisors pushed clients into risky exchange-traded funds, three former Barclays executives were acquitted of fraud by a London jury after they were accused of paying secret “fees” to Qatar in return for emergency funding during the financial crisis, reported Reuters.
In exchange for rescue financing to avoid nationalization of the bank (which would’ve meant shareholders take deep losses and executives loses their bonuses), Roger Jenkins, Tom Kalaris and Richard Boath (the three former Barclays executives) paid £322 million ($423 million) in “fees” to the Qatari sheikh who arranged the financing. To ensure that the deal went through, the executives allegedly conspired to hide these payments from their investors, the British government, and the press.
We noted several weeks before the first trial began last January, that after more than a decade since the fall of Lehman Brothers, ushering in the financial crisis, and wrecking the finances of tens of millions of middle-class Americans and citizens of other Western nations, “no bank executives have faced criminal penalties – that is, until very recently.”
The three former executives were on the cusp of facing a maximum of 10 years in jail after a 7.5-year investigation by the Serious Fraud Office (SFO) that charged the three in 2017, alleging they paid a “fee” demanded by Qatar in exchange for investing £4 billion ($5.15 billion) in the bank as part of an £11 billion ($14.15 billion) emergency fundraising in 2008. The funding allowed Barclays to avoid nationalization that would’ve been devastating for shareholder value.
The acquittals of the three executives is another loss for SFO, which failed to win a separate 2018 trial against Barclays for unlawful financial assistance to Qatar in 2008.
The case was historic because it would’ve meant for the first time in the Western world, a bank executive or executives would stand trial for serious legal consequences – maybe even jail time – for fraud stemming from the financial crisis, it appears banking elites remain untouchable to this day.
As for the next crisis that could be around the corner, it remains to be seen if bankers have the same immunity they did more than a decade ago.


