March Jobs Preview: The First Negative Print In Ten Years, And Then All Hell Breaks Loose
As RanSquawk notes, the data for March are already stale, given the release of the timelier initial jobless claims data, which showed another record high number of claims, and some 10 million laid off workers in the past 2 weeks. Additionally, the survey period of the BLS Employment Situation Report runs through the month ending 12th March, and therefore does not capture the full effect of the coronavirus disruptions on the US labor market, with “stay at home” orders being issued only after the 19th March in some US states.
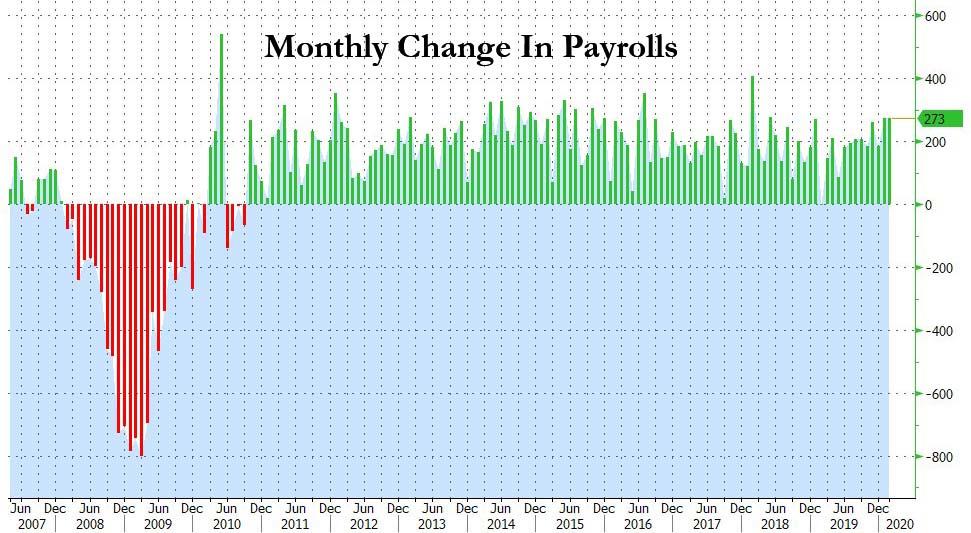
Still, even though it captures only the slowdown in the first half of the month, the March jobs report will almost certainly show a decline in monthly payrolls – the first since Sept 2010 – and breaking the longest stretch of positive payroll prints on record.
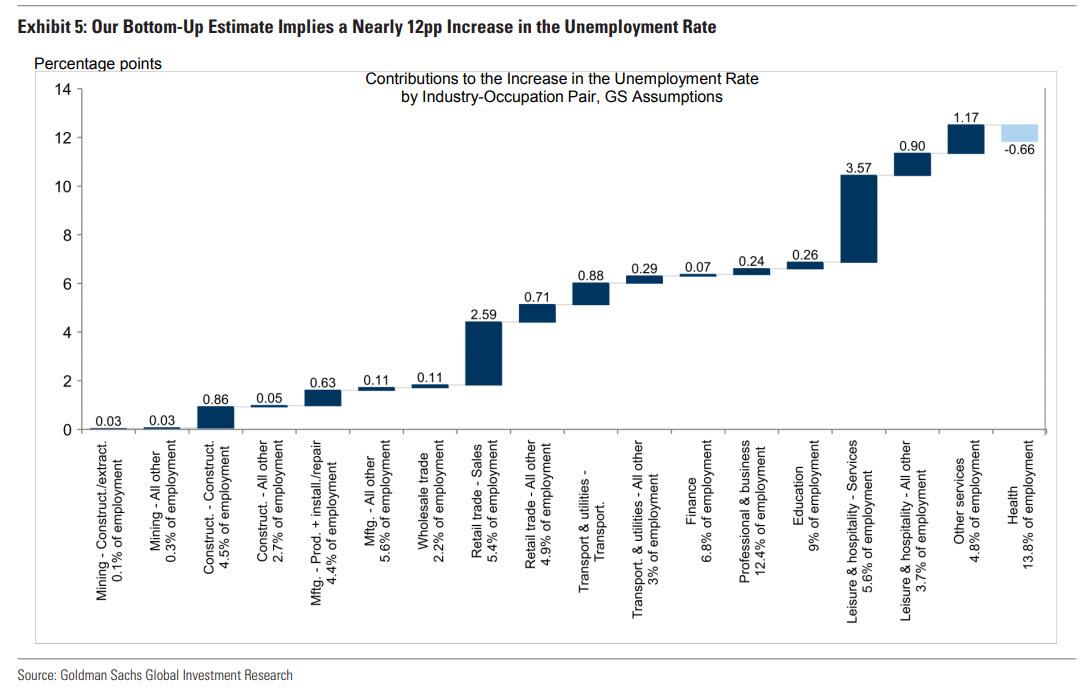
That said none of that matters: with the Fed having now gone full tilt in perpetuity no matter what the data says, we know that the data for the next 3-6 months will be catastrophic, with Goldman predicting 15% unemployment in Q2, meaning that in the next two months tens of millions of people will lose their job.
As such what the BLS reports tomorrow is completely meaningless. Still, for what it’s worth, here’s what Wall Street expects:
- Non-farm Payrolls: Exp. -100K, Prev. +273K
- Unemployment Rate: Exp. 3.8%, Prev. 3.5%
- Avg. Earnings M/M: Exp. 0.2%, Prev. 0.3%
- Avg. Earnings Y/Y: Exp. 3.0%, Prev. 3.0%
- Avg. Work Week Hours: Exp. 34.1, Prev. 34.4
- Private Payrolls: Exp. -163k, Prev. +228k
- Manufacturing Payrolls: Exp. -20k, Prev. +15k
- Government Payrolls: Prev. +45k
- U6 Unemployment Rate: Prev. +7.0%
- Labor Force Participation: Prev. 63.4%
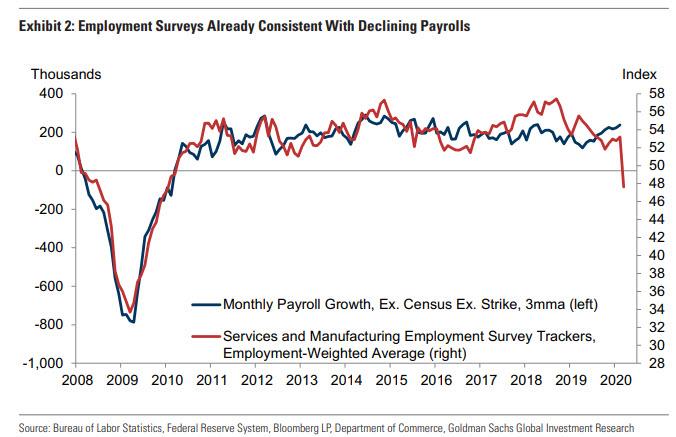
Speaking of Goldman, the bank estimates nonfarm payrolls declined 180k in March, below consensus of -100k. In addition to employment surveys falling into contractionary territory and jobless claims rebounding dramatically, sharp declines in commuting patterns in both New York City and Seattle indicate a sizeable drag from the coronavirus in those MSAs during the survey week. Goldman also estimate declining payrolls in the food services, accommodation, recreation services, social assistance, and temporary help subindustries (both in these cities and nationwide). Goldman also thinks the unemployment rate rose three tenths to 3.8%, with risks skewed towards a larger increase (consensus 3.8%). Jobless claims data indicate that the pace of layoffs increased sharply and an NPR/PBS poll found that 18% of employees were laid off or had their hours reduced. The silver lining, at least for those who still have jobs, is that the average hourly earnings increased 0.2% month-over-month and 3.0% year-over-year, reflecting negative calendar effects but a possible composition shift towards higher-paid workers (consensus also +0.2%/+3.0%).
And as noted above, while Goldman looks for a weaker-than-consensus report tomorrow, the March employment numbers are already fairly stale and insignificant in our view, “because the April report will likely show job losses in the millions.”
Here are some general observations courtesy of RanSquawk:
TREND RATES: The trend rates are meaningless going into the data, given disruptions caused by coronavirus. After the release of the February data, the 3-month average trend rate was at 243k (prev. 239k); 6-month was 231k (prev. 220k); 12-month at 201k (prev. 178k).
ADP EMPLOYMENT: ADP reported 27k payrolls were shed from the US economy in March, better than the consensus view for -150k. However, while the data appear encouraging, the ADP itself noted that the survey period ran through the 12th of the month, meaning that much of the COVID impact has not been captured in the data. It is also worth noting that the official BLS employment situation report also runs through that same period and therefore may be subject to similar caveats.
WEEKLY INITIAL JOBLESS CLAIMS: Weekly jobless claims for the week ending 28th March rose to a fresh record high 6.648mln, around double last week’s tally which was in itself a record high. The latest spike in jobless claims will not have an impact on the BLS data; in the corresponding survey period for the BLS data, initial jobless claims rose from 211k to 282k. But ahead, the data signals April’s Employment Situation Report will be grim, given accelerating claims; and ahead, analysts are not convinced the peak is in yet. Total layoffs between the March and April payroll surveys look destined to reach perhaps 16-to-20mln, according to Pantheon Macroeconomics, which would be consistent with the unemployment rate rising to 13- to-16%. “We have consistently argued from the beginning that the USD 2trln CARES Act is nothing like big enough; these data, and the numbers which will follow, make another huge package inevitable,” Pantheon said.
Additionally, some individuals may classify themselves as “employed but not at work”, which could limit the magnitude of the increase in the jobless rate tomorrow. Taken together, the March unemployment rate likely rose three tenths to 3.8%. And while the risks tomorrow are skewed towards a larger increase, the majority of the unemployment rise will occur in April and subsequent reports, with the jobless rate reaching 15% by midyear.

CHALLENGER JOB CUTS: Job cuts announced by US-based employers surged to 222,288 in March from 56,660, the highest monthly tally since January 2009; challenger noted that the data did not include the hundreds of thousands of workers who were furloughed in March. “The virus has caused total whiplash for HR, hiring managers, and recruiters. The labor data for February showed a strong economy with a tight labor market. Companies were fighting for talent across industries. Now, millions of workers have filed for unemployment, companies have frozen hiring, and in many cases, cut operations or closed completely,” Challenger said. It notes that the shut-down of nonessential businesses caused 141,844 cuts, primarily in entertainment/leisure; of the 54,300 cuts announced where no specific reason was provided, Challenger suspects many are due to COVID-19. Challenger notes that despite the jump in job cut announcements, hiring announcements have also surged during the outbreak. Instacart recently announced they would hire 300,000 new drivers, while grocery stores, like Kroger and Albertsons, are hiring tens of thousands of workers, and Pizza Hut, Domino’s, and Papa John’s are hiring thousands of delivery drivers. “The pandemic has created an opportunity for grocers and food delivery services, as well as consumer products delivery services, to thrive right now. The issue is whether they can find the workers to do jobs that now come with inherent risks that did not previously exist,” said Challenger.
BUSINESS SURVEYS: Not all of the business surveys are in ahead of the March jobs report. However, the March manufacturing ISM report saw the employment sub-index fall by 3.1 points to 43.8; ISM said this was the eighth month of employment contraction, and at a faster rate compared to February. It is again worth highlighting that the manufacturing sector accounts for around 11% of the US economy, and as such, it is difficult to infer what the ISM means for the BLS Data, particularly since manufacturing surveys have held up better than their services equivalent, of late. Additionally, some analysts, like those at UBS, have questioned the usefulness of survey data at the moment, noting that they are subject to quirks around a) some of the treatment of supply chains, which has flattered data, b) the fact that many respondents will not be replying to surveys during the virus disruption period, and c) survey data will give more accurate assessments during ‘normal’ times, perhaps not as much in unusual times.
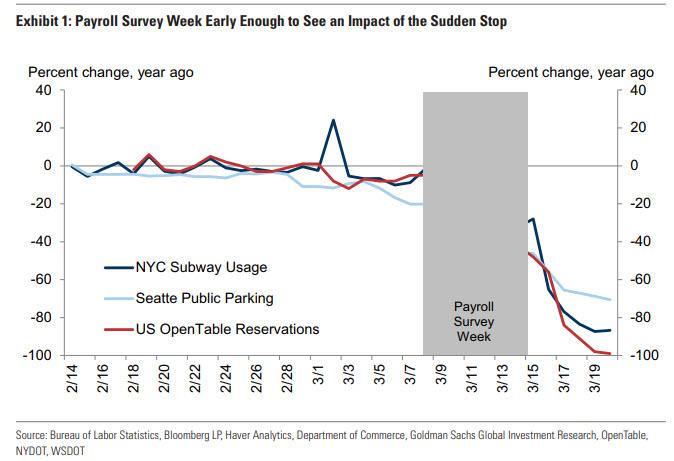
CORONAVIRUS: As shown below, Seattle public parking and NYC subway usage both declined 30% during the survey week (and by -14% and -18% on the Monday of the survey week, respectively), consistent with a sizeable drag on economic activity and employment from the 6.5mn payroll employees in these cities. And across the entire country, OpenTable reservations declined 25% year-on-year during the survey week, with declines in 35 out of 37 major cities on Monday of the survey week. Because of the coronavirus, expected declining payrolls in the food services, accommodation, recreation services, social assistance, and temporary help subindustries in this week’s report (both nationwide and in New York City and
Seattle).
And next month, expect all hell to break loose.
Tyler Durden
Fri, 04/03/2020 – 01:00
via ZeroHedge News https://ift.tt/2UW1RZ7 Tyler Durden