Private Wages Crash Most On Record As Savings Soar By $4 Trillion In 1 Month
Tyler Durden
Fri, 05/29/2020 – 10:32
One of the recurring laments about the BLS’ “average hourly earnings” series is that it does not actually measure the change in average hourly earning – which as a reminder surged 7.9% in April according to the latest jobs report…
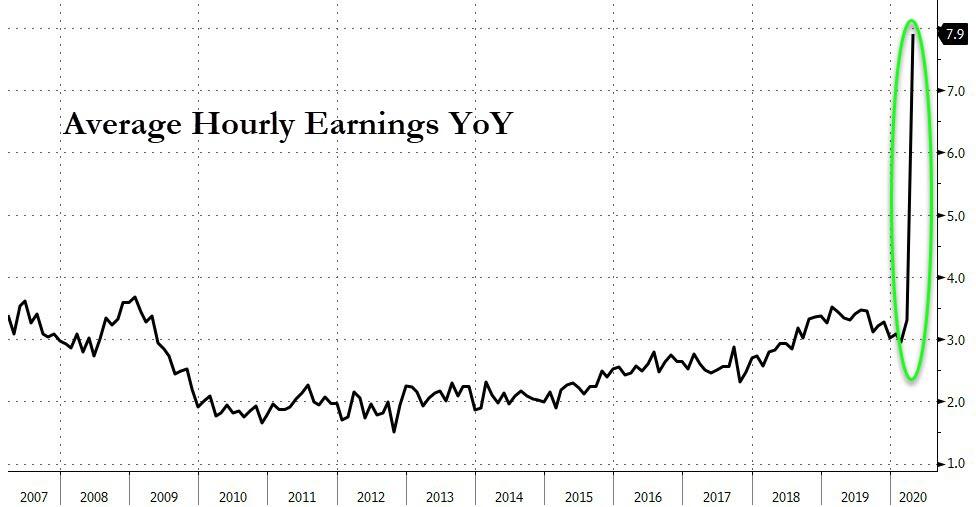
… but is merely a ratio between aggregate compensation and hours worked, and since the denominator crashed much more than the numerator, the number actually posted a sharp spike contrary to what actually happened since the start of the Second Great Depression.
So what did happen?
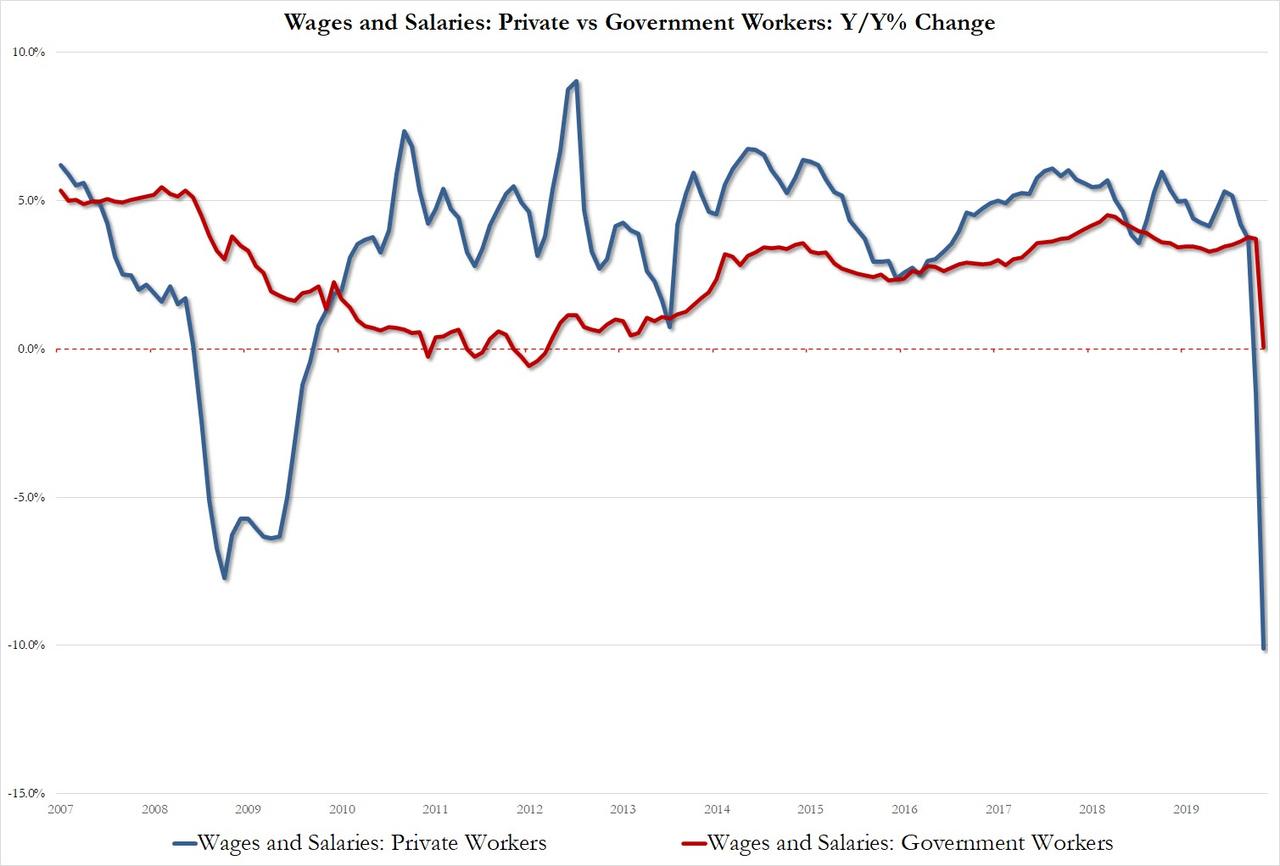
According to latest monthly income and spending reported published earlier today by the BEA, the reality was far uglier, as wages for private industries plunged to $7.0 trillion annualized from $7.7 trillion in March, and from $7.8 trillion last April. The drop of 10.1% was not only the accurate description of what actually happened to private wages, but was also the biggest annual drop on record, surpassing even the worst drop during the financial crisis. Furthermore, it meant that three years of private wage growth was lost in one month, as the last time private wages printed an annualized $7.0 trillion was in April 2017! Meanwhile, as private wages imploded, government workers also saw their pay drop drop, but far more modestly, from $1.487 trillion in March to $1.438 trillion in April, an unchanged print from a year ago, meaning that government workers have been far more insulated from the economic collapse, in line with expectations.
The chart below shows the true hit to private and government wages in April, a far cry from the “fake news” reported by the BLS’ average hourly earnings print which is clearly meaningless in a time of corona.
And yet, as total wages crashed by almost $1 trillion, down from $9.22 trillion annualized in March to $8.48 trillion in April, total personal income actually soared by nearly $2 trillion, from $18.7 trillion to $20.7 trillion.
How did this happen? Simple: the government unleashed the biggest ever flood of personal current transfer receipts (i.e., government handouts), which soared from an annualized $3.3 in March to a record $6.3 trillion in April. Here, unemployment benefits were a major contributor, rising from $69.6BN to $430BN annualized, but it was the “Other” line, which exploded from $528 billion to $3.122 trillion – which consisted of various coronavirus stimulus measures – that was primarily responsible for the surge.
![]()
Meanwhile, as noted earlier, despite this record boost to personal incomes, US spending – that biggest contributor to GDP accounting for 70% of US output – collapsed by the most on record, sliding -13.6%…
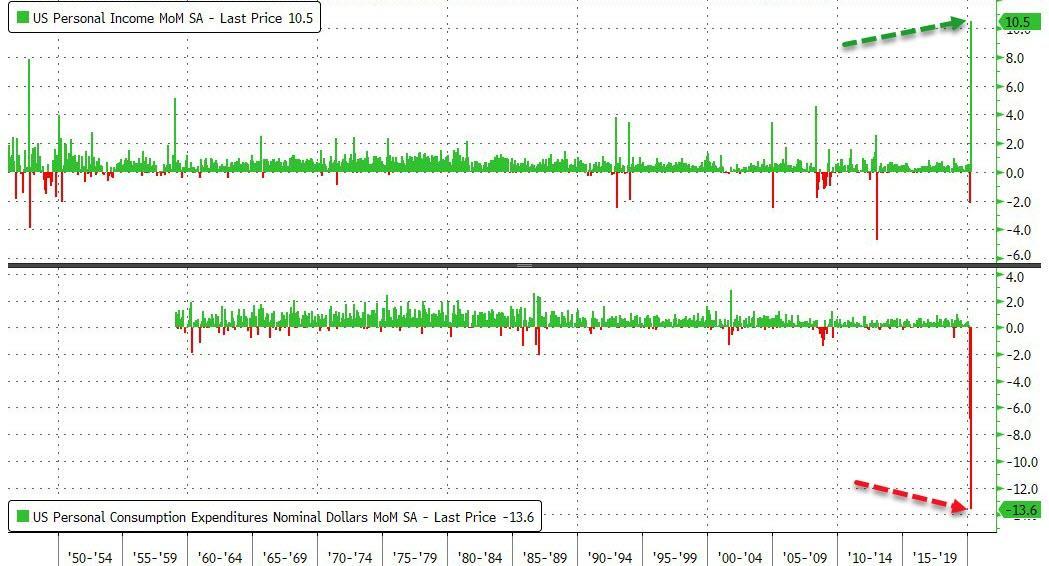
… as consumers were frozen, unsure if and when things will return to normal.
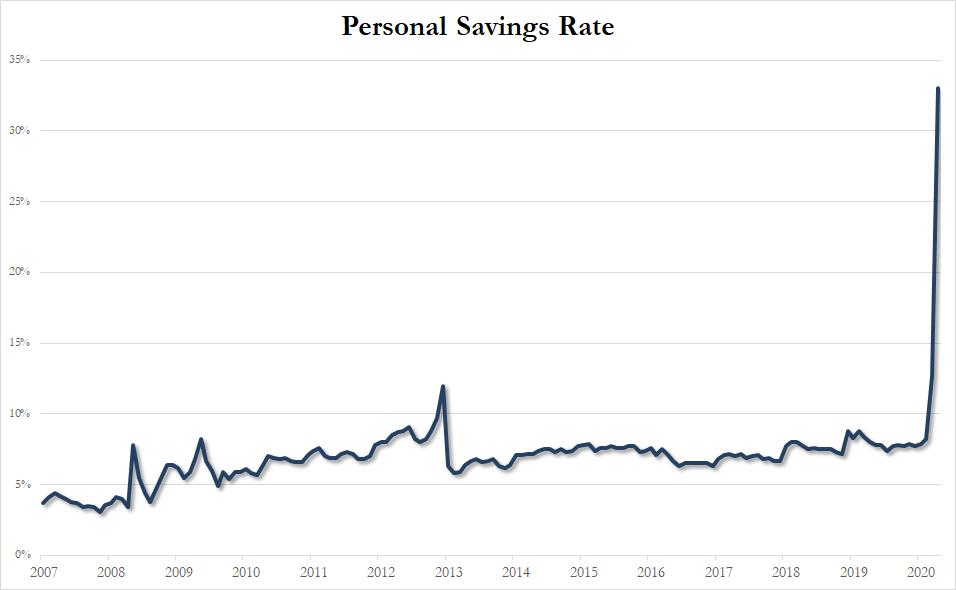
The result of this surge in personal incomes and plunge in spending, is that the annualized amount of Personal Savings exploded by a mindblowing $4 trillion in May, rising from $2.1 trillion to $6.1 trillion…
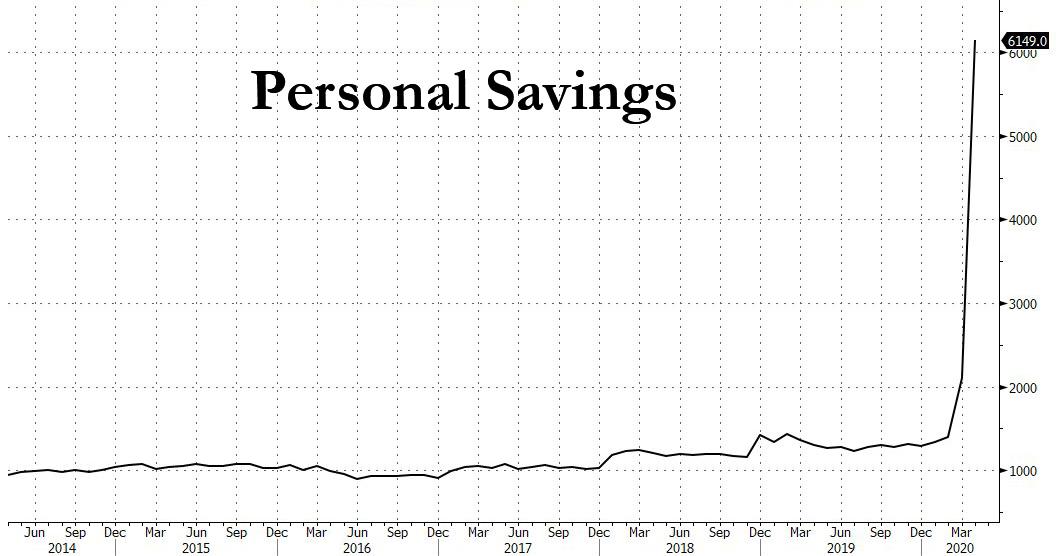
… and accounting for 33% of disposable personal income.
And while economists will say that consumer better start spending all those pent up savings soon to reboot the economy, we have a different question: how much of these “government stimulus” checks were already spent by the retail public to buy stocks, because as we observed last week, in addition to paying down debt and withdrawing cash, investing in stocks was listed as the third most popular use of government funds…
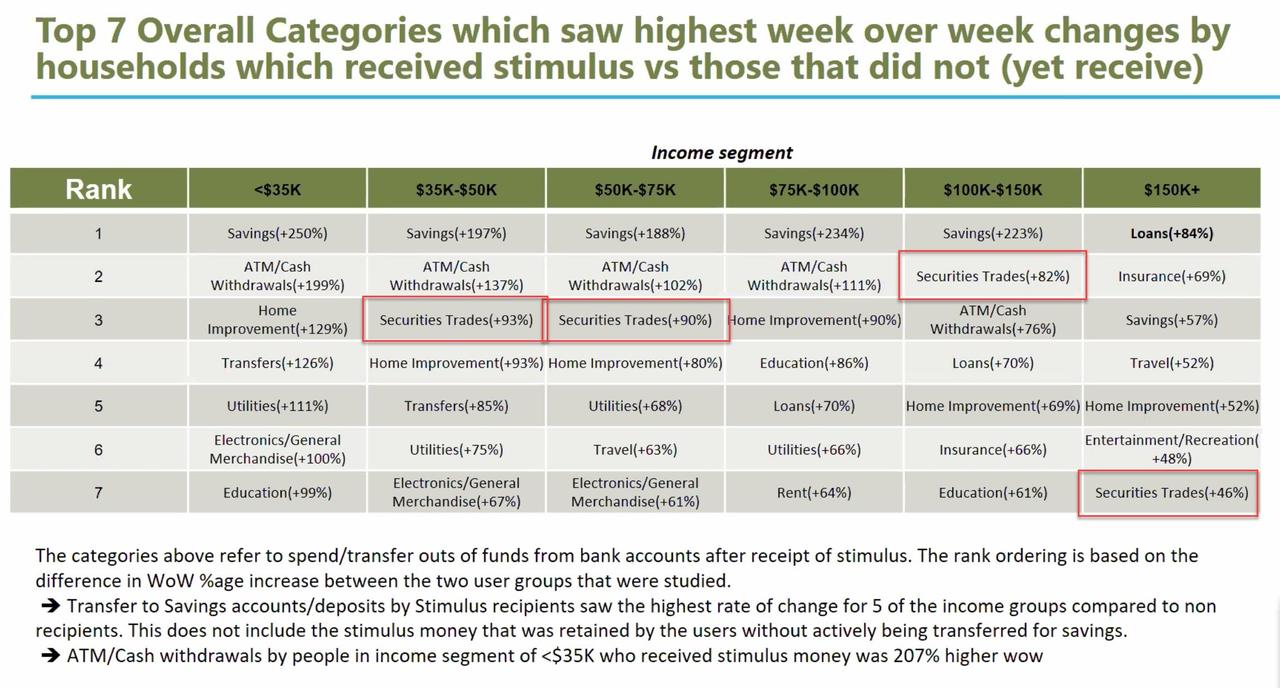
… and would easily explain the market’s torrid surge in recent weeks.
via ZeroHedge News https://ift.tt/2zGUzSx Tyler Durden