What’s Behind The Bizzare Break Between Breakevens And Crashing Real Rates
Tyler Durden
Mon, 08/10/2020 – 16:45
One of the core identities in finance is also the most fundamental one: Nominal Rates = Real Rates (inflation adjusted interest rates, typically reflected by TIPS) + Breakevens (or inflation expectations). In theory, this identity looks as follows:
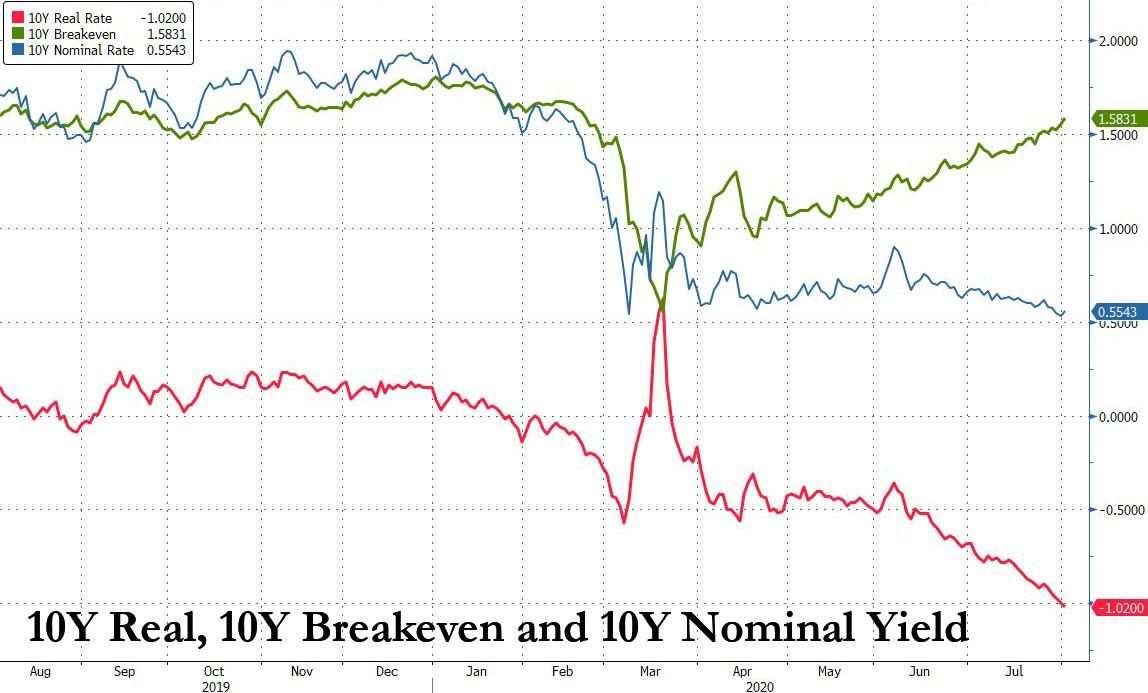
In practice, however, the decoupling between Real Rates (red line) and Breakevens (green line) should not look anywhere remotely close to what the chart above is depicting. And yet, over the past 5 months, a dramatic “break” has emerged in the bond market, where an unprecedented decoupling between current deflation conditions and future reflation expectations is now the norm and is sparking countless questions what’s behind it.
So what’s going on?
AS BofA’s chief rates strategist Mark Cabana explains, at the July FOMC, the Fed delivered a dovish message (Powell is “not even thinking about thinking about thinking about raising rates”) that clearly linked the economic outlook to the fate of the virus. There was limited “stage setting” for additional forward guidance or changes to asset purchases that could be announced at the September meeting. The Fed seems confident that the markets understand its reaction function and that rates will be low for a very long time. In short, Powell has been very clear that the Fed is not thinking about raising rates… and the first full hike is only priced in 2025.
This dovish message has also supported speculation around unconventional monetary policy, particularly Yield Curve Control (YCC) and negative rates. It is natural however that the market sees these as mutually exclusive near/medium-term, and the recent bias towards enhanced forward guidance, YCC, or twist is likely to strengthen the Fed’s preference of a zero floor.
So what is behind the breakeven decoupling?
According to BofA, as long as market participants believe the Fed is very resistant to take rates negative it should provide more resistance to declines for longer-dated nominal vs real rates. Nominal yields have been relatively range bound in the 50-80bp range that is consistent with a Fed at the ZLB and neutral rate expectations anchored around 0% real. Additionally, ongoing discussion around YCC reinforces the lower end of that range, and indeed Cabana sees a floor for the 2s10s curve post YCC around 25-30bp. In this context, it becomes increasingly difficult for nominal rates to reflect deteriorating macroeconomic fundamentals which would be a waning support for USTs as a hedge.
However, unlike nominal rates, real yields are not subject to these constraints and have a higher degree of freedom to reflect deteriorating macroeconomic fundamentals. What this implies is a (growing) level of decoupling between breakevens and inflation fundamentals. Meanwhile, BofA’s models for breakevens are starting to show some significant widening relative to levels implied by fundamentals (roughly 20bp wide in the macro framework for 10y BEs, and 28bp in a more stringent model that takes into account the nominal level of yields, oil prices, and a liquidity conditions ).
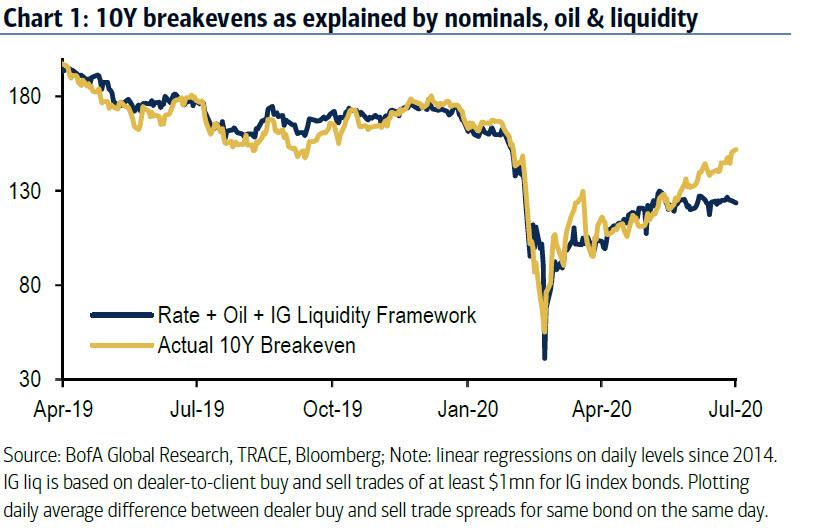
That said, while recent BE widening reflects some level of decoupling from inflation fundamentals driven by the zero rate floor and ultra-easy monetary policy, the depreciating dollar and some pricing of stagflation scenarios may have also contributed to the move.
Stagflation?
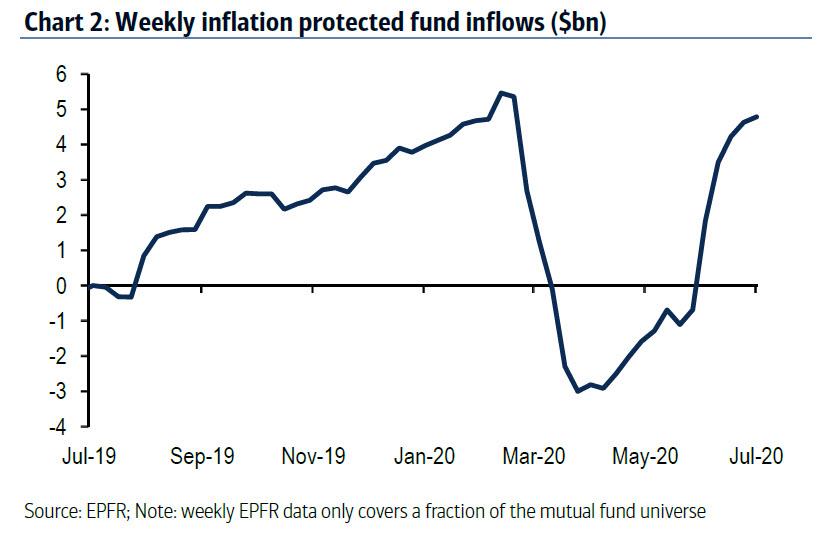
A far more ominous scenario is that, as Cabana notes, some investors may be pricing the risk of a stagflation scenario, as reflected by the growing inflows into inflation protected funds.
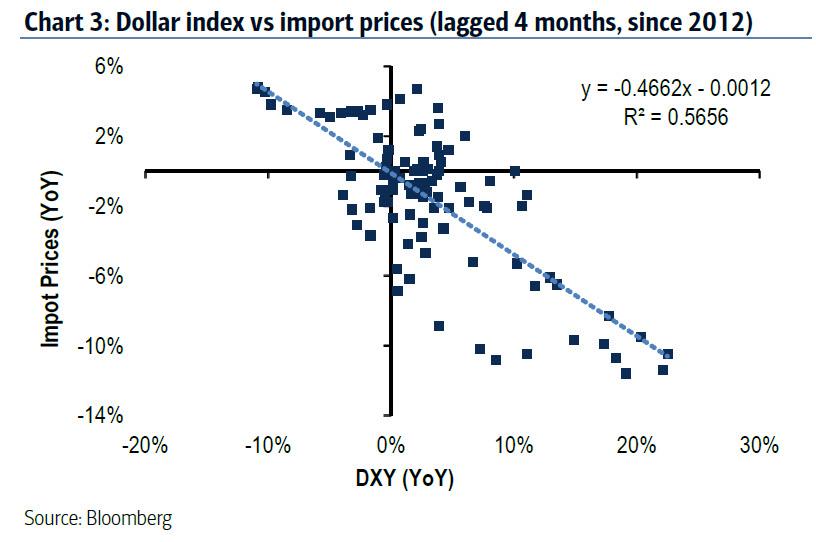
Some may also expect higher inflation supported by ongoing QE and/or higher import prices supported by the depreciating dollar.
That said, fund flows have slowed substantially after making up for March outflows likely due to the recent moderation of overall economic activity. Overall, the nominal/real rate and dollar dynamics are likely better suited to explain the recent rise in breakevens.
What about the dollar?
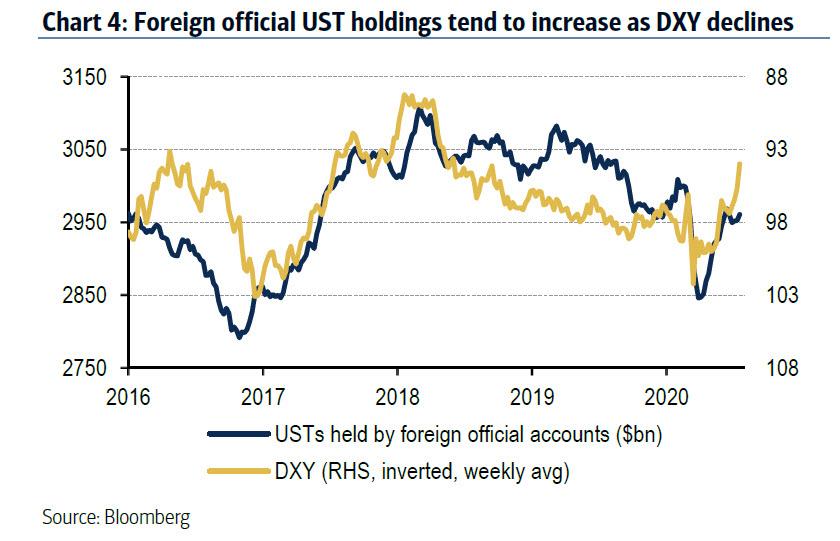
As BofA notes, the recent bearish dollar move has been driven by expectations of deterioration in US data relative to external data. A bearish USD trend should support reserve manager accumulation of US Treasuries as a bi-product of currency management practices (i.e. USD weakens and local CCY strengthens, reserve manager needs to sell local CCY to buy USD; USD then gets invested in USTs). This should help ease some of the 2H UST supply/demand imbalance especially in the front-end to belly of the curve which is where reserve holdings are concentrated.
Increased UST buying from the reserve manager community would compete with deposit rich banks that have recently stepped up their buying of front end and belly USTs. As a result, a dynamic of increased reserve manager & bank buying with a likely sharp wave of Fed reserve growth stemming from a decrease in the UST cash balance should serve to richen front end & belly USTs vs OIS. Confusingly, it would also be expected to place further downward pressure on real rates at intermediate dated tenors.
Bottom line: expect even lower real rates, and expect an even greater divergence between real rates and breakevens over the coming year.
via ZeroHedge News https://ift.tt/2PEK3zo Tyler Durden