“A Signal Fire Of Warnings Is Under Way”
Authored by Sven Henrich via NorthmanTrader.com,
The more things change the more they stay the same. So we had the bounce off of the 50MA and the other signal points we highlighted. The resulting rally brought markets right back to new highs, precisely the year 2000 script we had discussed.
Hence so far no surprises really. A steep rally since November, new all time highs in January, then a swift corrective move into the end of January and then a rally to new highs:
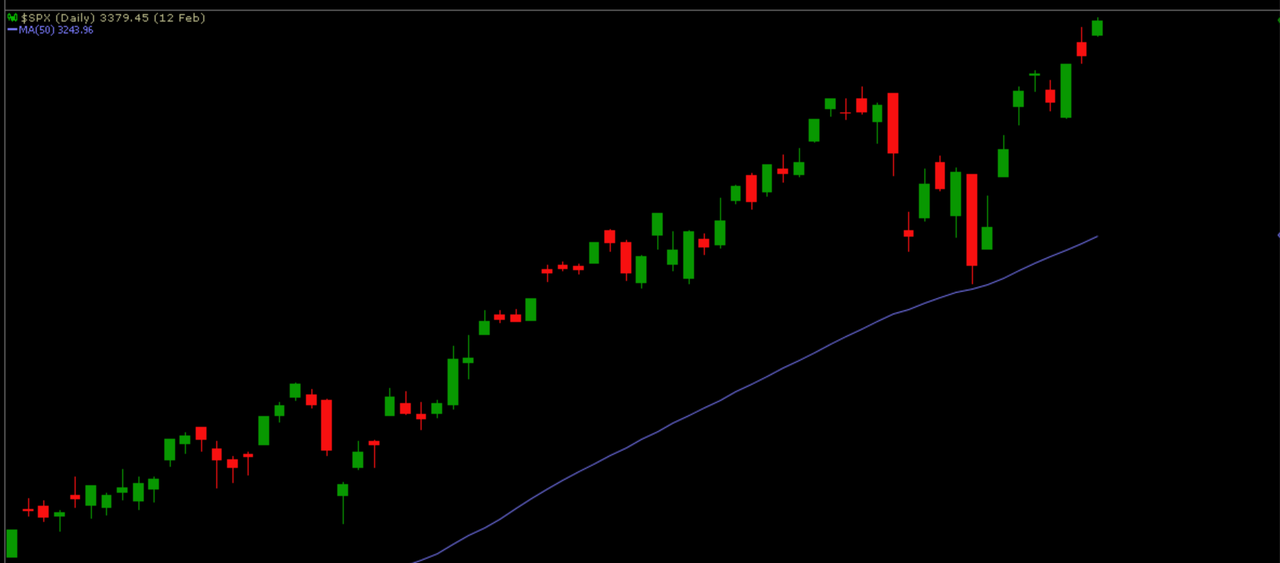
Oh, I’m sorry, that’s the chart from 2019/2020, here’s the current version:
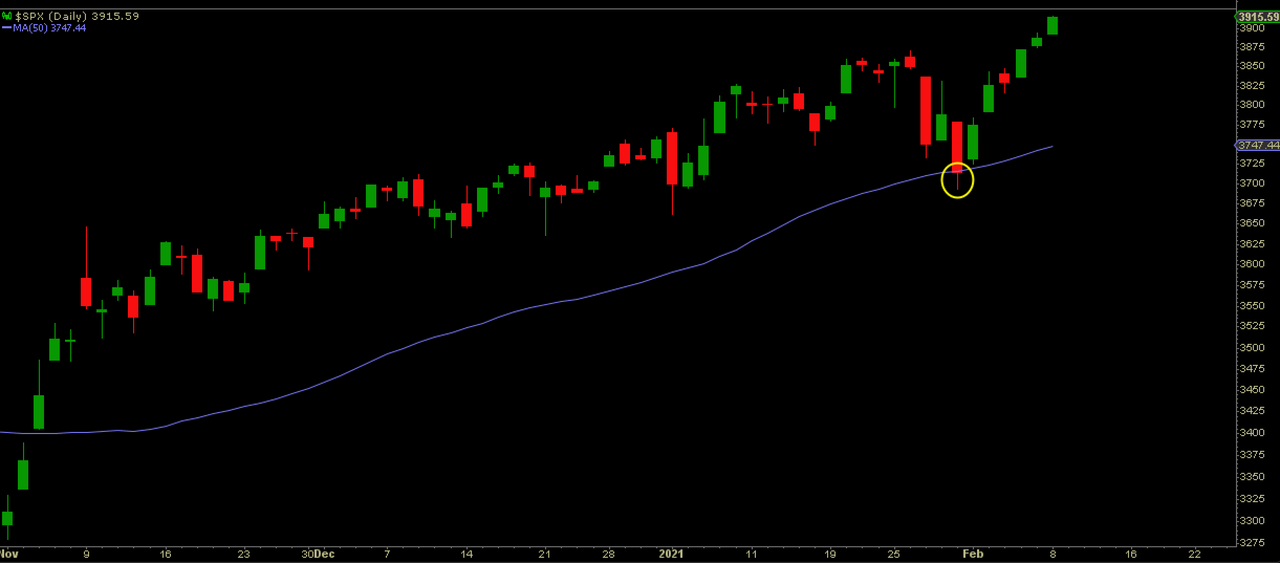
No, this market is really not behaving that much differently from the one that led to the February 2020 top. Back then of course the Fed too was printing running their Repo program having cut rates three times already, now of course printing still $120B a month with rates at zero following the balance blow out to $7.4 trillion.
Numbers aside the structure of the broader market is behaving very similarly to last year, hence it is noteworthy that some of the signals are also virtually the same, in fact suggesting a signal fire of warnings is under way.

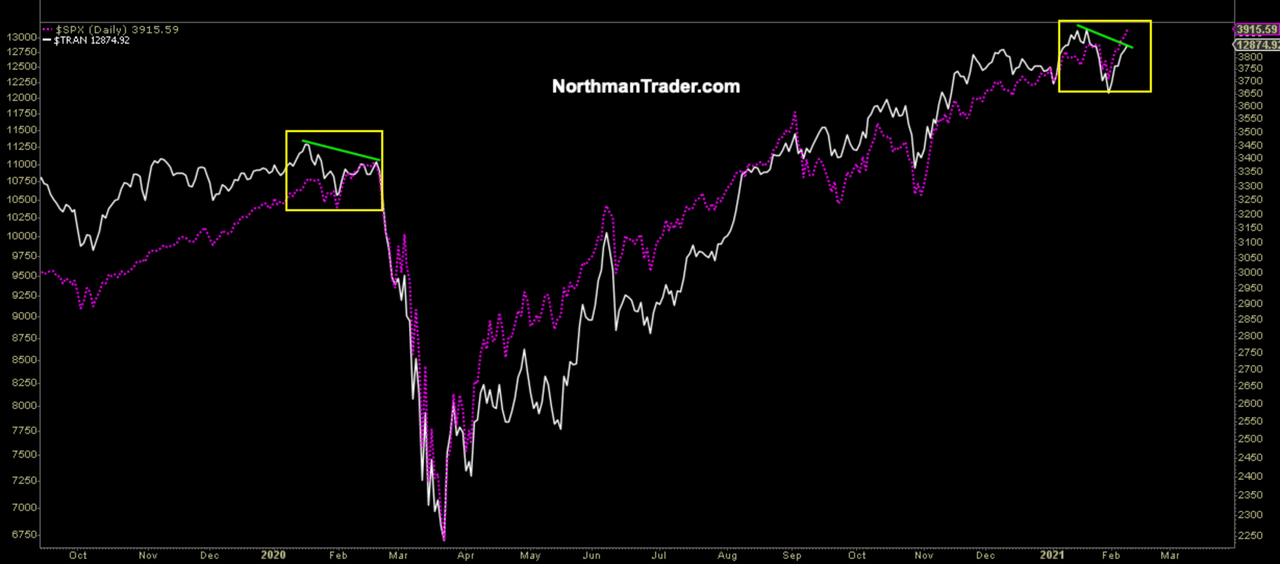
For one note the new highs on a negative divergence as in 2020:

Now that could just be temporary and if markets rally further the divergence could disappear. Yet note transports suddenly lagging, not making new highs while $SPX is, also very much like 2020:
Also notable, on the new highs here we see a similar program running with the $SPX components above their 50MA:
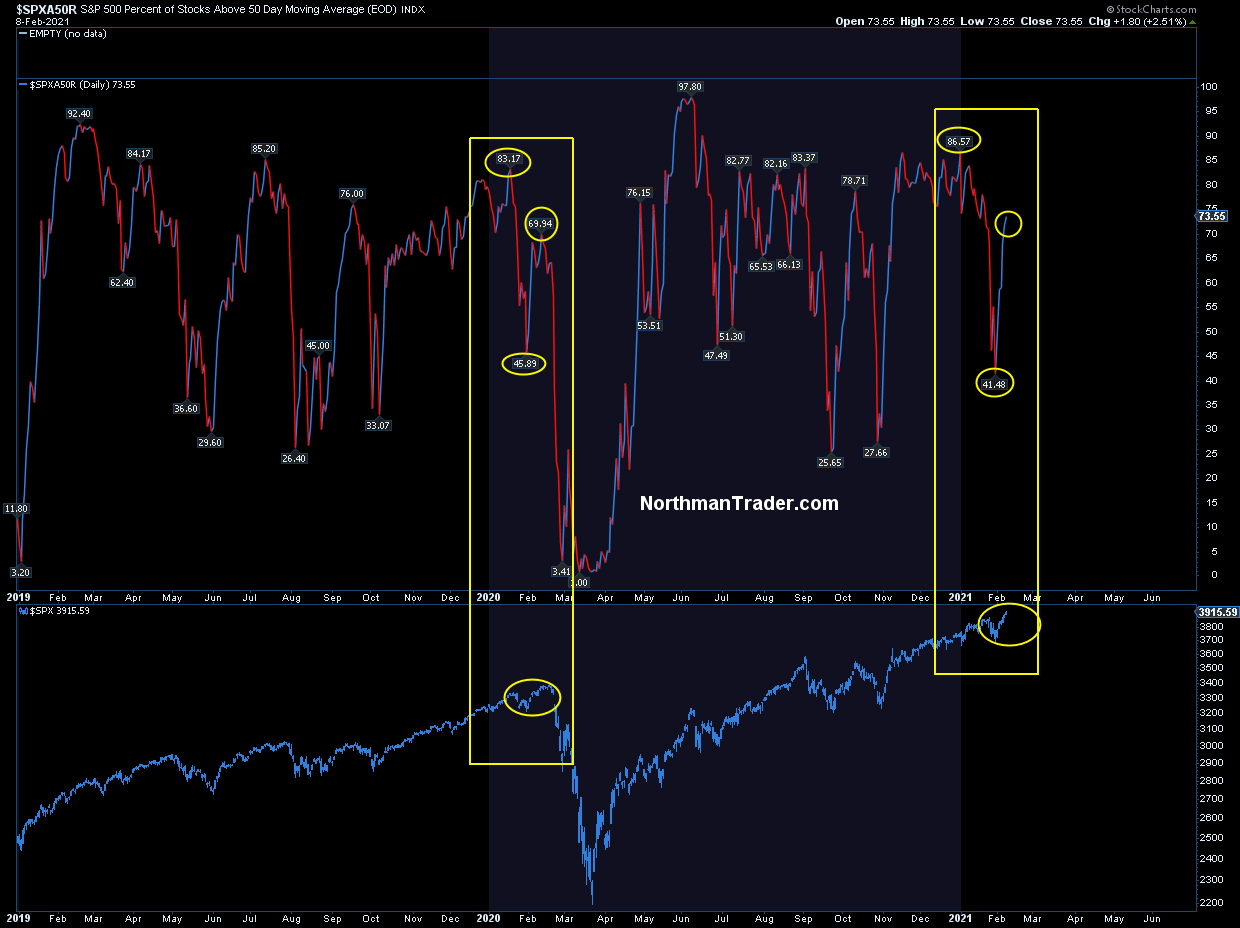
Nearly the same readings compared to January/February 2020 with lower readings versus new index highs. Weird. Same time frame, same behavior, same program.
In February 2020 these highs ultimately gave way to the now long forgotten 35% crash. Crashes are extremely rare, but corrections still do happen, the severity of course dependent on a number of factors, the relevance of which usually only become apparent after the fact.
Yet despite all the similarities there are also important differences to note compared to 2020.
For example, small caps are now at a record 40% extensions above their 200 day moving average and never before has the weekly chart seen such a steep disconnect from the weekly 50 moving average:
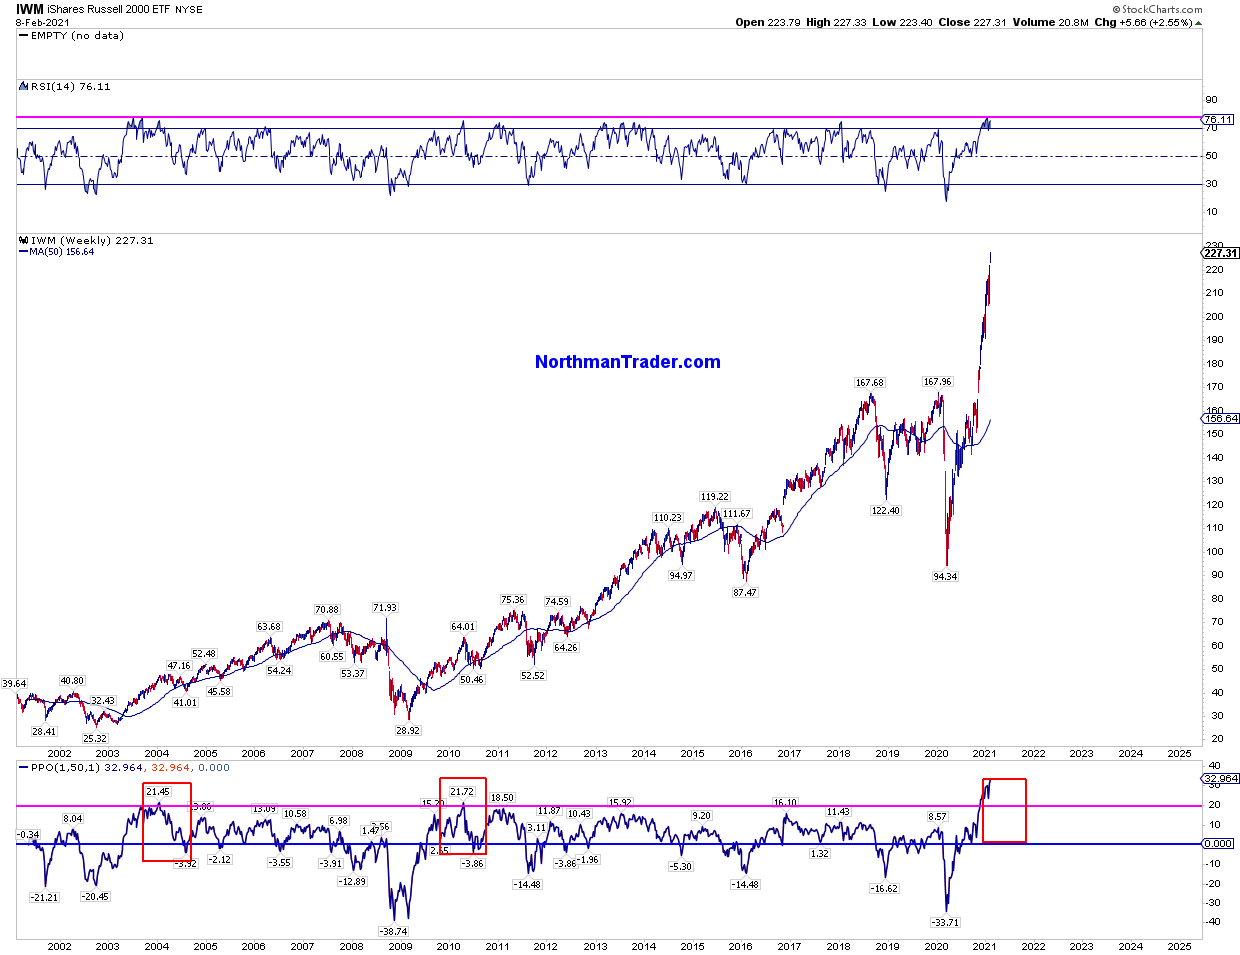
However there is no market history, none, that doesn’t see an eventual reconnect with the weekly 50MA, the question of course is the when and where. The moving average is by definition moving and is now trending higher. Just a standard/basic reconnect at this time would constitute a market crash as prices are so historically extended. And be clear: Reconnects can take quite some time to happen, but it’s rare for it not to happen for more than a year.
Bulls I suppose can take comfort in the history that extremes can become even more extreme as the tech sector showed in 2000:
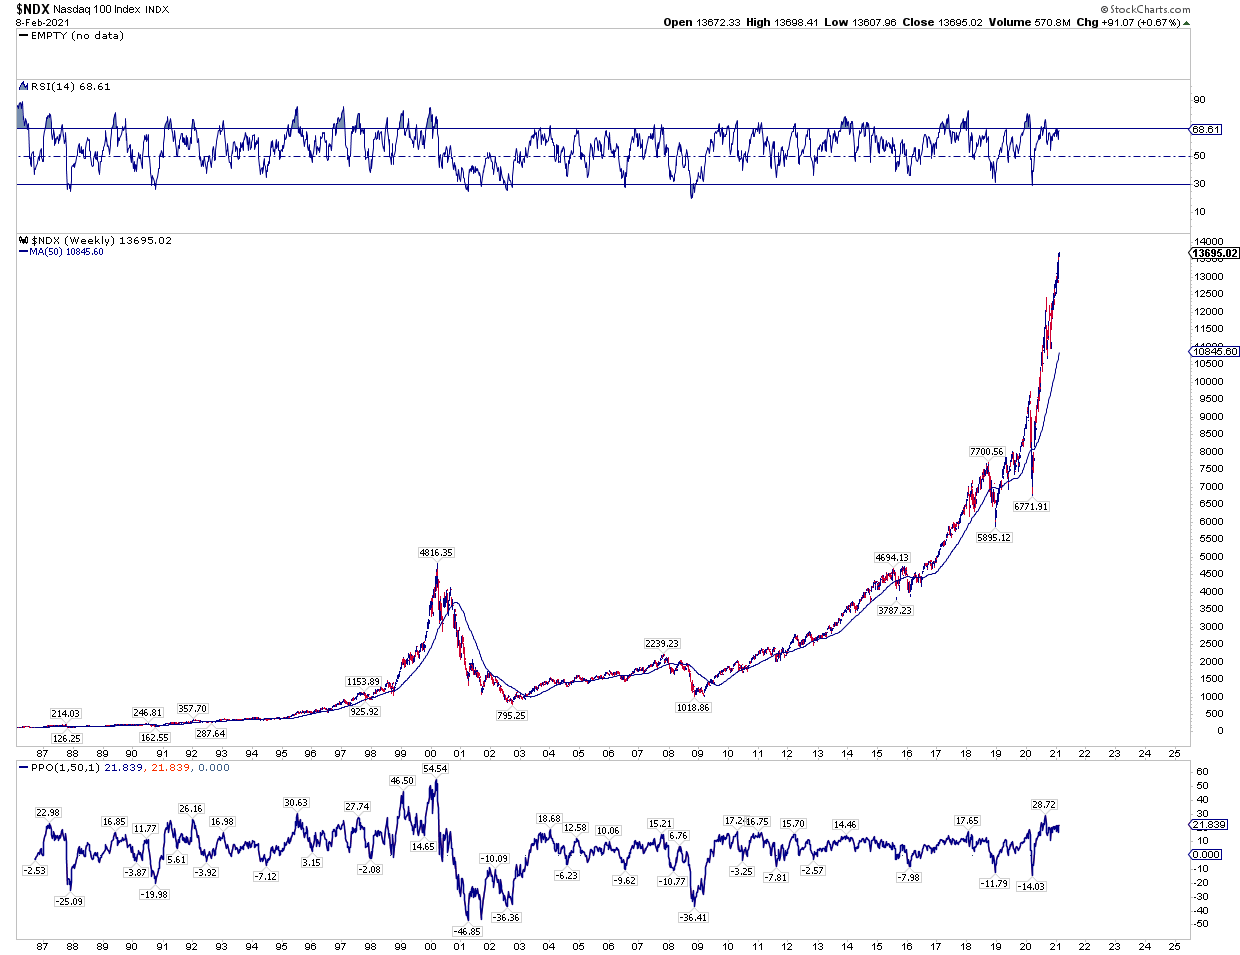
So yes, extremes can become more extreme and hence the 4156 $SPX area remains a clear technical possibility for now.
If that’s the hill you want to die on go ahead for all chart history shows extreme extensions don’t last. Rebalancing will come and the severity of the rebalance is also driven by the extreme of the previous disconnect.
And that’s a critical point for there is yet another difference between now and 2020 and 2000 for that matter: Market cap to GDP now at 194.9% versus 158% in February 2020 and 150% in the year 2000.
Never have we seen markets this disconnected from the economy:
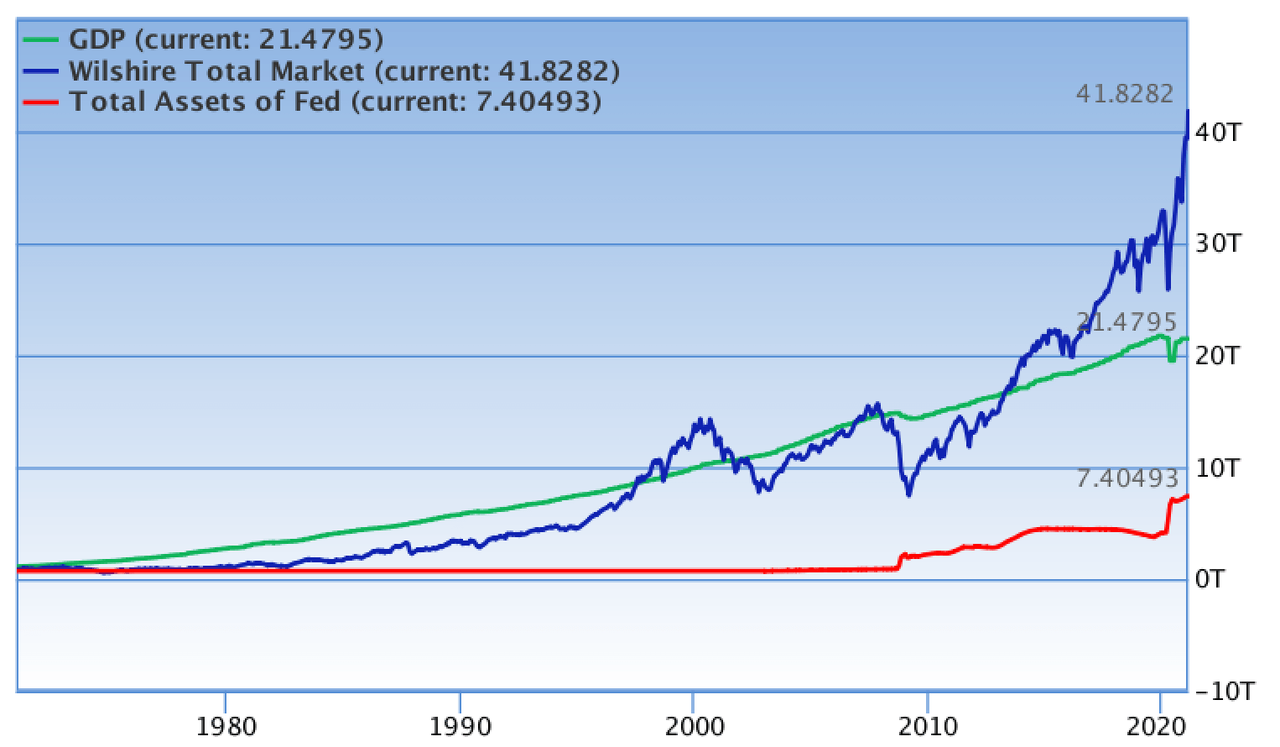
A rational bubble it’s been called because of the exorbitant amount of liquidity flowing through the system distorting everything.
Yet despite all this liquidity this market is behaving in a curious way. It is repeating the same behavior as it did last year before the crash. Except this year it is even more valued and more disconnected from technicals and fundamentals.
Last year the market topped February 19/20 and risk happened fast:
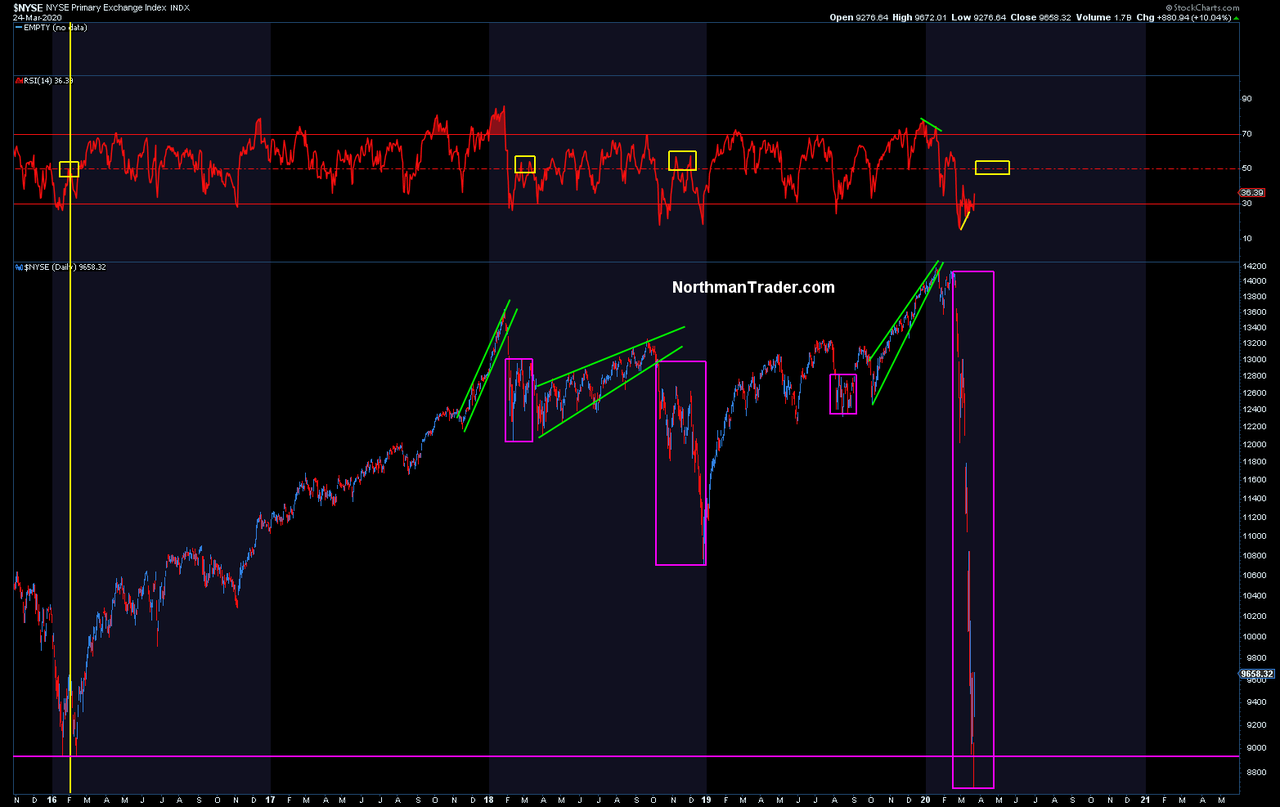
Don’t @ me saying I’m calling for a crash, I’m not. But a sizable correction remains very much overdue for this market that still appears impervious to all valuation concerns and remains among the most complacent markets in memory. In 2020 markets didn’t top until the later part of February. In 2000 markets didn’t top until March. 2021 has yet to show its hand.
But hey, maybe it’s different this time, although analyzing the charts above it appears that the more things change the more they stay the same.
* * *
For the latest public analysis please visit NorthmanTrader. To subscribe to our market products please visit Services.
Tyler Durden
Tue, 02/09/2021 – 11:20
via ZeroHedge News https://ift.tt/3rC1py6 Tyler Durden