“This Is Nuts!” – Is BofA Right About A Market Drop To 3800?
Authored by Lance Roberts via RealInvestmentAdvice.com,
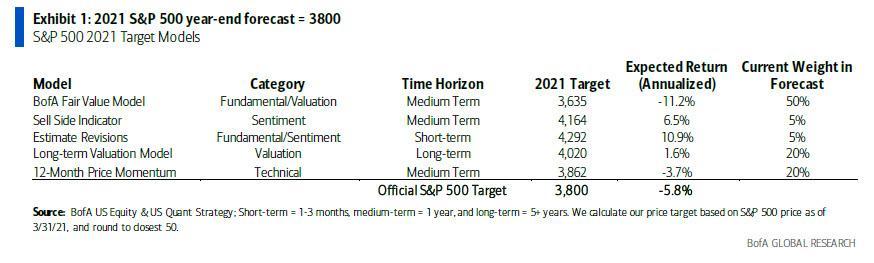
Recently, Bank of America’s Savita Subramanian discussed why the market could drop to 3800. She discussed her thesis in her latest strategy note titled “Five Reasons To Curb Your Enthusiasm.”
This analysis is interesting, particularly when analysts are rushing to upgrade both economic and earnings estimates.
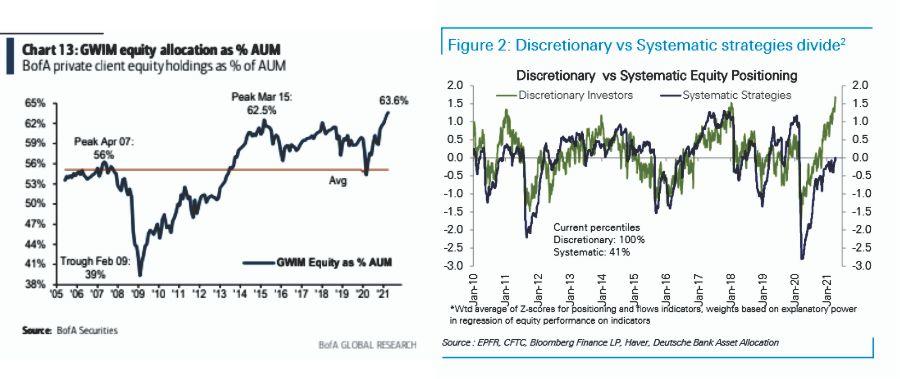
More importantly, investors are incredibly long-biased in portfolios, with equity allocations reaching some of the highest levels in history.
What Subramanian questions, and something we have asked previously, is all the “good news” already “priced in?”
“Amid increasingly euphoric sentiment, lofty valuations, and peak stimulus, we continue to believe the market has overly priced in the good news. We remain bullish the economy but not the S&P 500. Our technical model, 12-month Price Momentum, has recently turned bearish amid extreme returns over the past year.”
With investors “all in,” we suspect a correction is more likely than not.
Technical Deviations
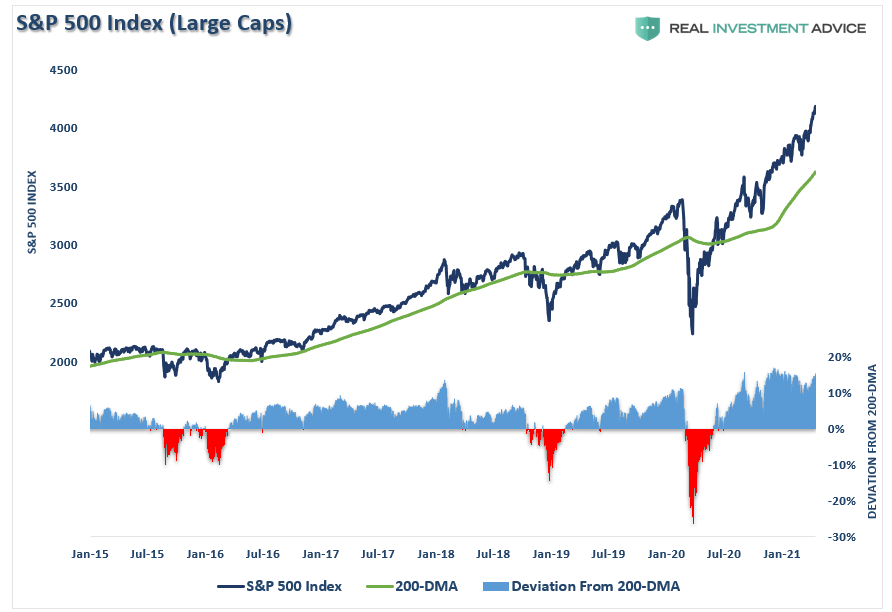
While BofA only expects a 10% correction, as shown, there is a risk of a deeper reversion.
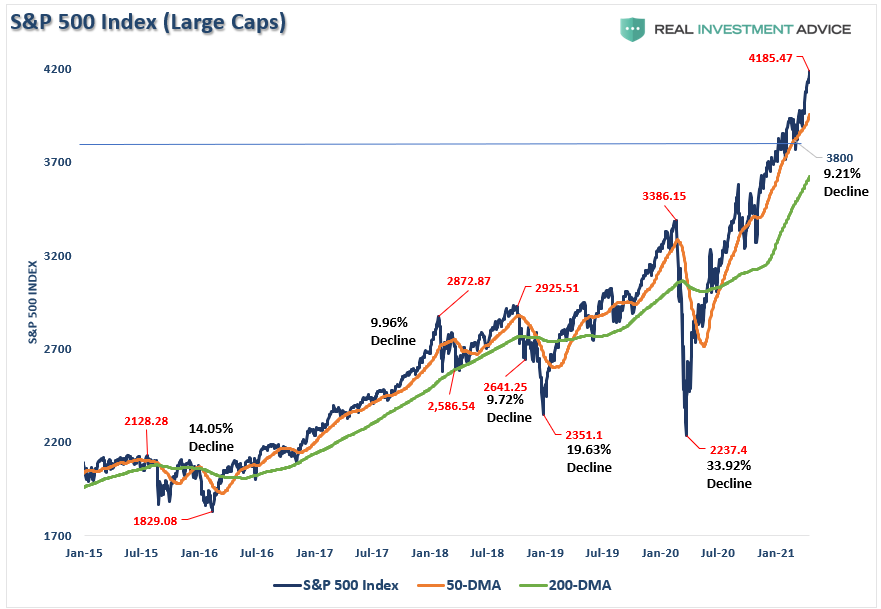
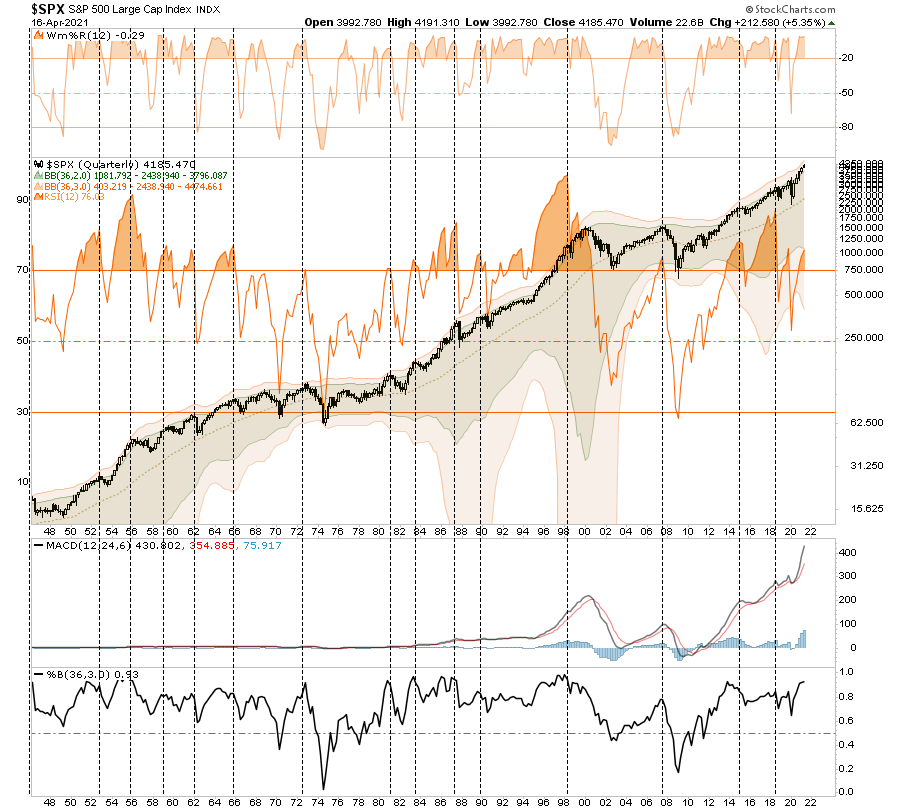
A correction back to 3800 would only revert prices to mid-2020. As shown, over the last 5-years, corrections have ranged from roughly -10% to -33%. Notably, these corrections usually have reverted the index either to the 200-dma or beyond.
Given the magnitude of the market’s current deviation from the 200-dma, a correction will likely surpass 3800. A retest of the 200-dma seems most probable.
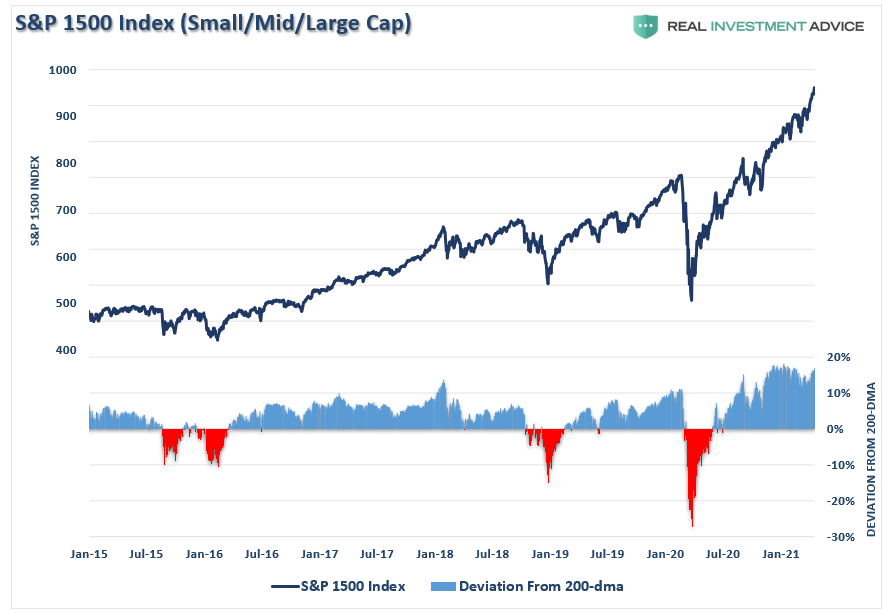
Furthermore, the entire market (small, mid, and large-capitalization companies) have all risen sharply in the liquidity-fueled advance from the March 2020 lows. Such provides plenty of fuel for a more significant correction if selling begins in earnest.
Retracements Suggests The Same
The 200-dma remains the lower boundary for corrections over the past 5-years. That level helps define the parameters of a retracement. As shown below, using the October lows as a starting point for the current rally, a 38.2% retracement aligns mostly with BofA’s prediction.
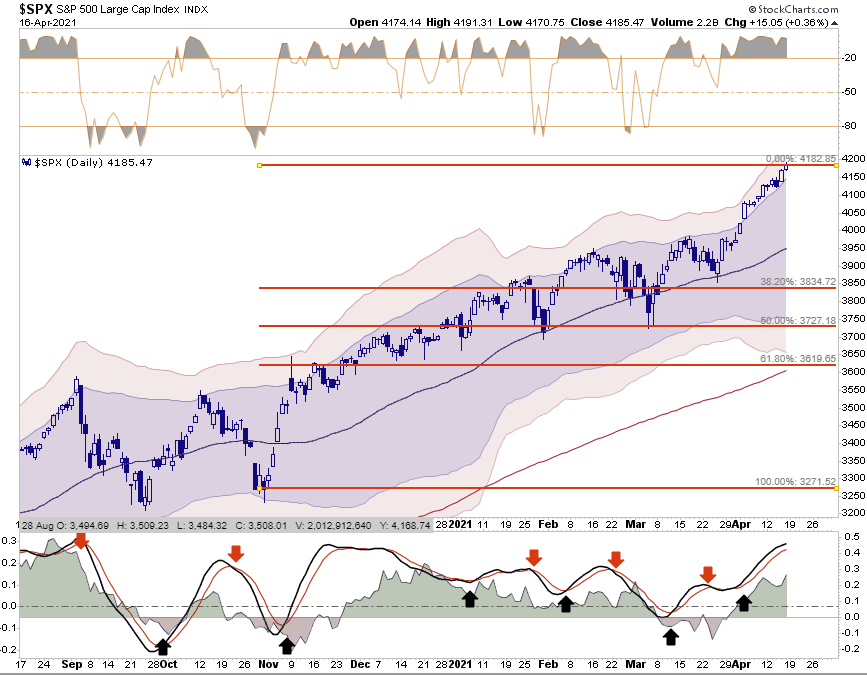
However, a 50% retracement seems more logical as it aligns with the previous bottoms in both February and March. But a 61.8% retracement also aligns with the 200-dma. As such, we can determine that a correction could range from:
-
38.2% = 8.3% Decline
-
50.0% = 10.89% Decline
-
61.8% = 13.46% Decline
While the mainstream media loathes the discussion of a correction, corrections of this magnitude are a healthy process of reverting market excesses. Furthermore, corrections of this magnitude are well within the confines of drawdowns seen over the last 5-years of the market’s advance.
Fundamentals Require A Lot More
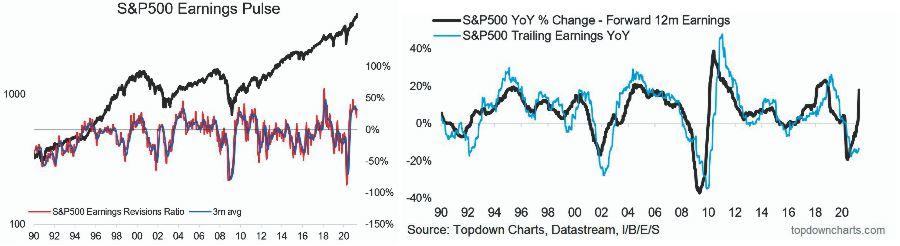
As discussed in “Earnings Optimism Explodes,” the market has run well ahead of fundamentals.
“Here is the problem for investors currently. Given analysts’ assumptions are always high, and markets are trading at more extreme valuations, such leaves little room for disappointment. As shown, using analyst’s price target assumptions of 4700 for 2020 and current earnings expectations, the S&P is trading 2.6x earnings growth.”

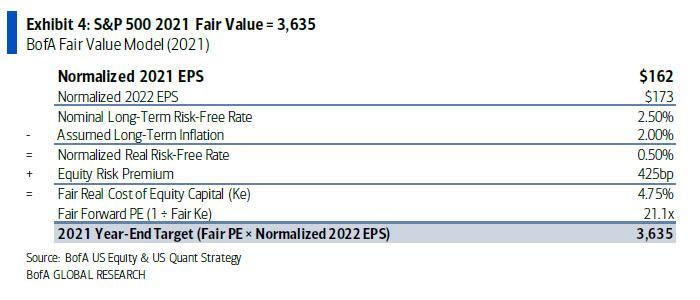
As BofA noted, their “fair value” model also suggests that prices are near a peak with a downside target of 3635. (Based on BofA’s 2022 cyclically-adjusted earnings forecast of $173 and its equity risk premium (ERP) forecast of 425bp by year-end (vs. 398bp today.)
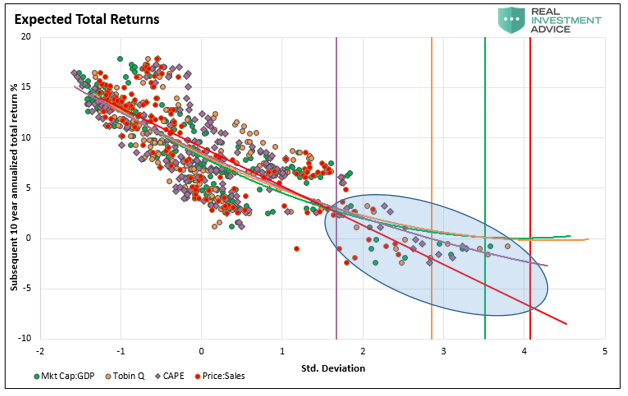
Longer-term valuation metrics are all entirely distorted and suggests markets a likely close to a long-term peak than not. As Michael Lebowitz noted recently, the four major valuation indicators are simultaneously at levels offering near-zero returns over the next decade.
This Is Nuts
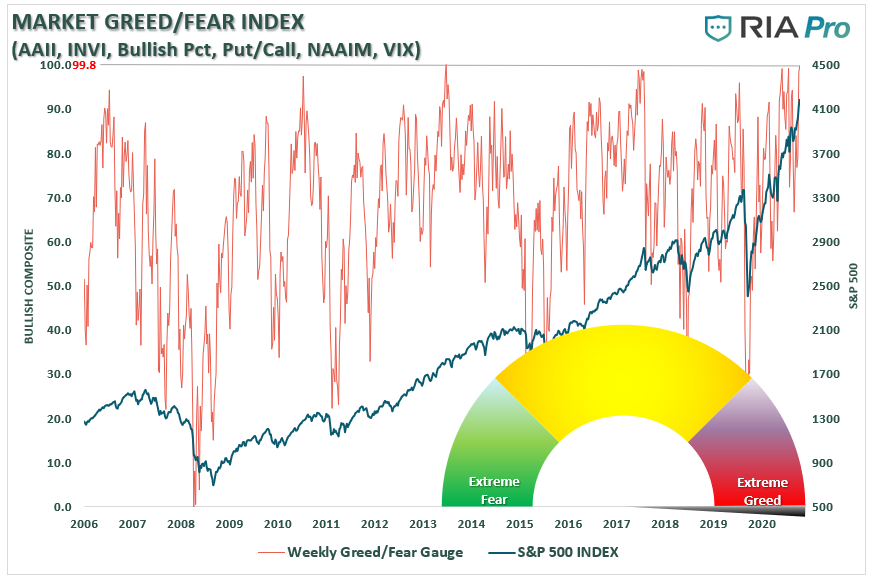
On many levels, the current exuberance is “nutty.” Our “Fear/Greed Allocation” gauge, which measures investor’s equity exposure, shows the same. With the index pushing 100, a historical rarity, such precedes market corrections.
There are few points in history where the market was this significantly deviated, extended, overbought, and overly bullish. Without exception, the market corrected. Sometimes it was just a 10-20% decline. However, sometimes it is a lot more.
While prices can certainly seem to defy the law of gravity in the short-term, the subsequent reversion from extremes has repeatedly led to catastrophic losses for investors who disregard the risk.
There are substantial reasons to be pessimistic about the markets longer-term. Economic growth, excessive monetary interventions, earnings, valuations, etc., all suggest that future returns will be substantially lower than those seen over the last decade. Bullish exuberance has erased the memories of the previous two major bear markets and replaced it with “hope” that somehow, “this time will be different.”
Maybe it will be.
Probably, it won’t be.
Starting To Take Profits
The problem for the majority of investors is the inability to predict whether the subsequent correction will be just a “correction” within an ongoing bull market advance or something materially worse. Unfortunately, by the time most investors figure it out – it is generally far too late to do anything meaningful about it.
Yesterday, we started selling and taking profits, which provides us three benefits for the future.
-
Less equity risk, and higher cash levels, reduce portfolio volatility and allows us to navigate a correction while protecting investment capital.
-
It gives us capital to reinvest back into positions we currently own at better prices; or,
-
Buy new positions which have corrected in price.
While it is entirely true that “you can not time the market,” you can do some analysis and make deliberate changes to avoid problems.
As discussed previously, “risk happens fast.”
It is essential not to react emotionally to a sell-off. Instead, fall back on your investment discipline and strategy. Importantly, keep your portfolio management process as simplistic as possible.
- Trim Winning Positions back to their original portfolio weightings. (ie. Take profits)
- Sell Those Positions That Aren’t Working. If they don’t rally with the market during this recent rally, they will decline more when the market sells off again.
- Move Trailing Stop Losses Up to new levels.
- Review Your Portfolio Allocation Relative To Your Risk Tolerance. If you have an aggressive allocation to equities at this point of the market cycle, you may want to try and recall how you felt during 2008. Raise cash levels and increase fixed income accordingly to reduce relative market exposure.
This is just how we are approaching it.
Tyler Durden
Tue, 04/20/2021 – 14:44
via ZeroHedge News https://ift.tt/3sAS8Gr Tyler Durden