Owner-Equivalent Rent Shock On Deck As Actual Rents Surge By Most On Record
Another month, another record surge in US rents to a new all time high.
According to the Apartment List national index, US rents increased by 2.1% from August to September, and although month-over-month growth has slowed slightly from its July peak when the sequential growth rate was 2.6%, rents are still growing much faster than the pre-pandemic trend. Since January of this year, the national median rent has increased by a staggering 16.4%. To put that in context, rent growth from January to September averaged just 3.4% in the pre-pandemic years from 2017-2019.
While even the smallest cooldown in rent growth is a welcome change for renters, Apartment List’s Chris Salviati notes that it’s important to bear in mind that prior to this year, the national index never increased by more than 0.9 percent in a single month, going back to 2017. “Furthermore, we have now entered the time of year when rents are normally declining due to seasonality in the market. In September of 2018 and 2019, for example, rents fell by 0.1 percent and 0.3 percent, respectively.”
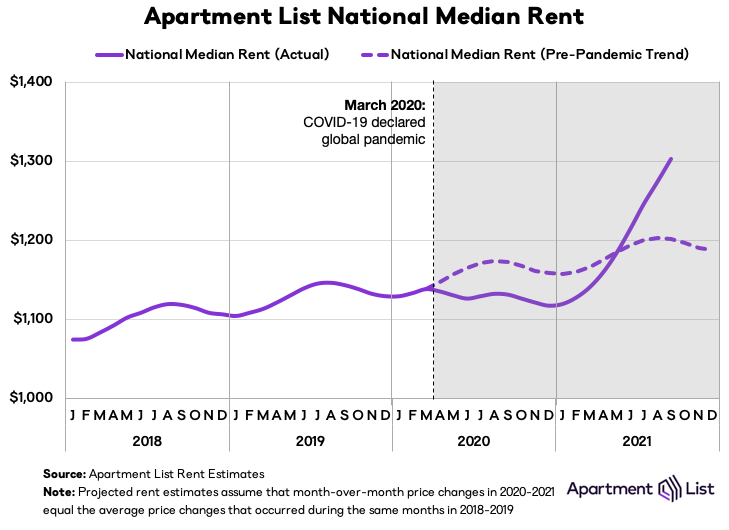
That said, we have a ways to go before US rent – where the median just rose above $1,300 for the first time ever – decline; and with rents rising virtually everywhere, only a few cities still remain cheaper than they were pre-pandemic, and even these remaining discounts are unlikely to persist much longer. At the other end of the spectrum, Apartment List finds 22 cities among the 100 largest where rents have increased by more than 25 percent since the start of the pandemic. That said, there are some early signals that tightness in the market may be beginning to ease: the vacancy index ticked up this month for the first time since last April. And in Boise, ID, which has seen the nation’s biggest price increase since the start of the pandemic, rents finally dipped slightly this month.
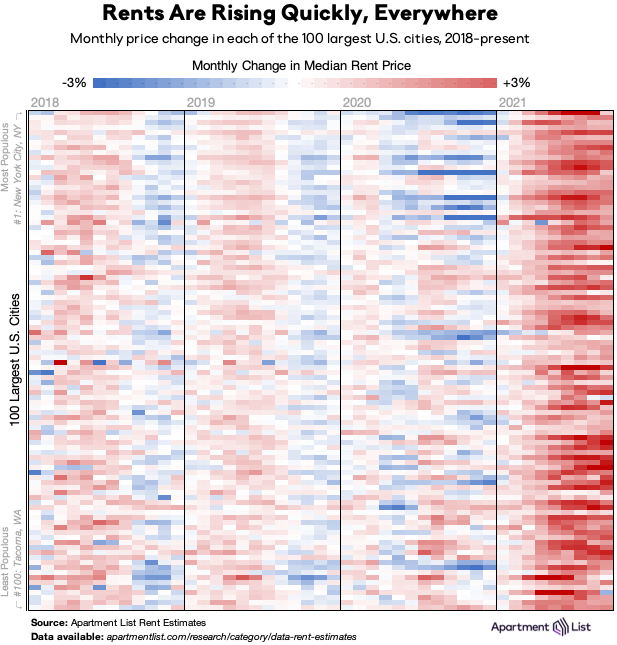
The chart below visualizes monthly rent changes in each of the nation’s 100 largest cities from January 2018 to September 2021. The color in each cell represents the extent to which prices went up (red) or down (blue) in a given city in a given month. Bands of dark blue in 2020 represent the large urban centers where rent prices cratered (e.g., New York, San Francisco, Boston), but those bands have quickly turned red as ubiquitous rent growth sweeps the nation in 2021. In 2020, 60 of these cities saw rent prices rise from August to September, but this year, 97 cities got more expensive in September.
In a glimmer of hope for Americans locked out of not only the housing but the rental market, one of the few markets where rents did not increase this month was Boise, ID. Since last March, rents in Boise are up by a staggering 39%, making the city the archetype for rental market disruption amid the pandemic. This month, however, the median rent in Boise fell by 0.1%. While such a small dip certainly doesn’t offer much relief to Boise renters, it may at least signal that the market is finally starting to stabilize. Spokane, WA, another city that has experienced skyrocketing rent growth this year, saw an even more notable decline this month, with rents down 1.8 percent.

Unfortunately, Boise and Spokane represent the exception rather than the rule — in most of the cities where rents had been growing quickly, that growth is continuing. Tampa, for example, saw rents jump by another 3.9% this month, and the city now ranks 2nd for cumulative rent growth since the start of the pandemic at 36%. Excluding Boise and Spokane, the other eight cities in the chart above experienced rent growth of 3.5%, on average, from August to September, as affordable Sunbelt markets continue to boom. Of particular note, four of the ten cities with the fastest rent growth since last March are suburbs of Phoenix.
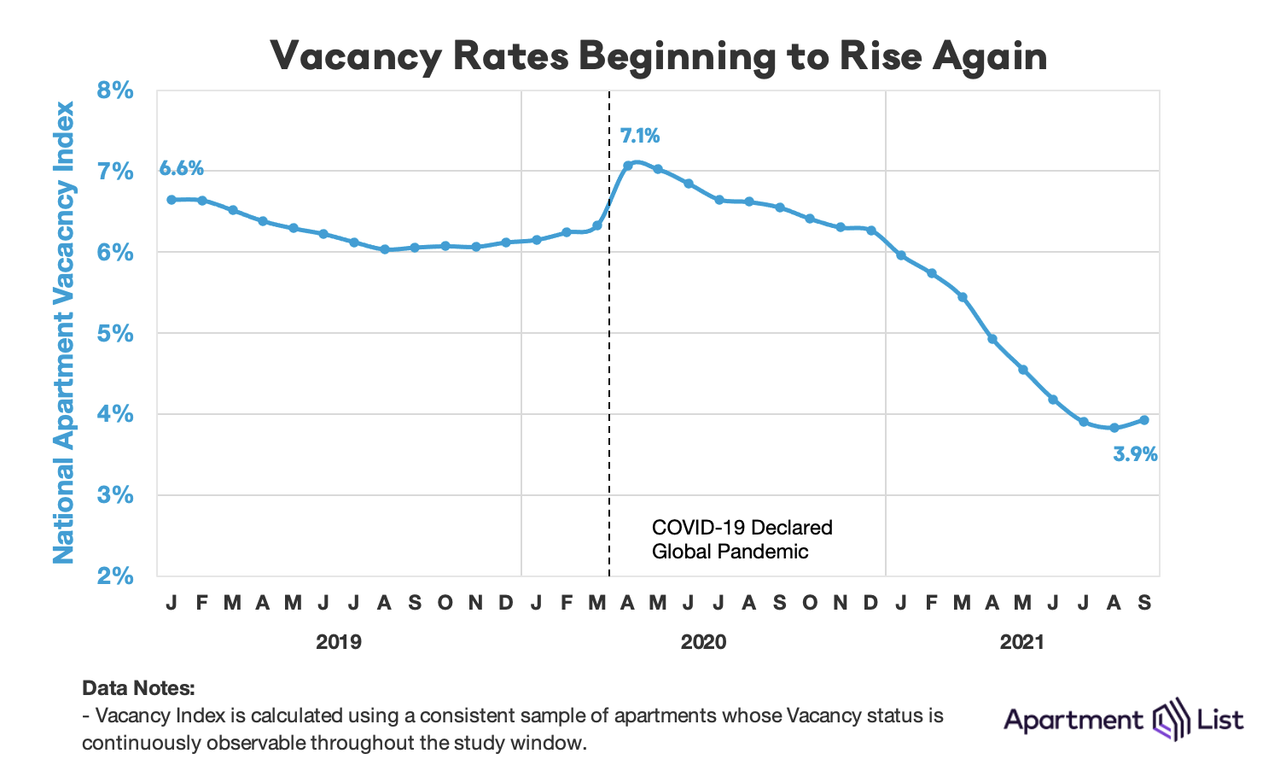
A more tangible indicator that demand destruction may be setting in, is that vacancy rates have posted their first increase since March. Indeed, as Apartment List notes, much of this year’s boom in rent prices can be attributed to a tight market in which more and more households are competing for fewer and fewer vacant units. The vacancy index spiked from 6.2% to 7.1% last April, as many Americans moved in with family or friends amid the uncertainty and economic disruption of the pandemic’s onset. Since then, however, vacancies have been steadily declining. For the past several months, the vacancy index has been hovering just below 4%, significantly lower than the 6% rate that was typical pre-pandemic.
This month, however, the vacancy index ticked up slightly, from 3.8 percent to 3.9 percent. Although this is a very minor increase, it represents the first increase of any magnitude since last April. While a few more months of data would be needed to confirm an inflection point, if vacancies are back on the rise again, it would signal that tightness in the rental market is finally beginning to ease and that rent growth will also continue to cool.
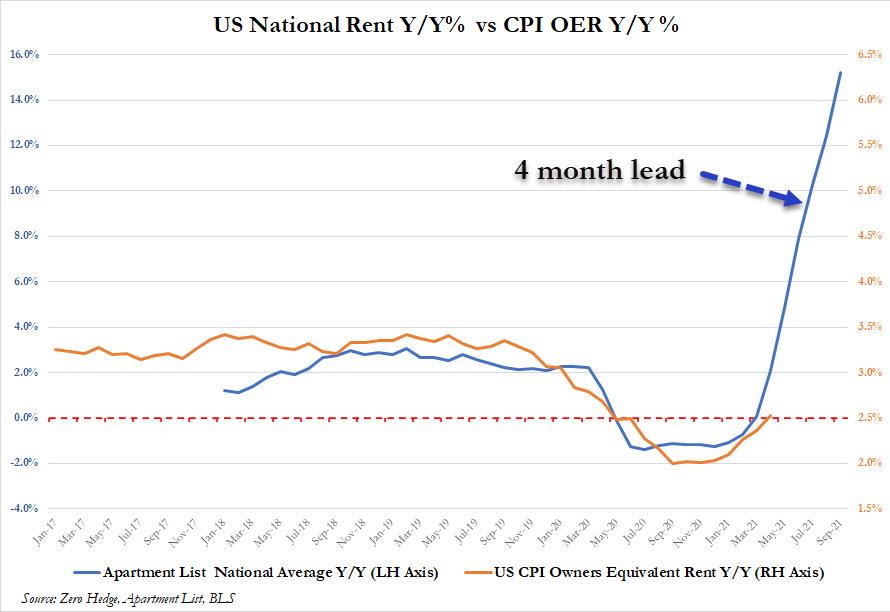
Finally, where there may be light at the end of the tunnel in real-time data, we have yet to see the pig even enter the python when it comes to the CPI’s Owner Equivalent Rent data series. As shown below, the Apartment List data normally has a 4 month lead to the OER series, which means that as actual rents soar by over 15% Y/Y, OER is either going to skyrocket in the coming quarters or the BLS will have to come up with some very fancy hedonic adjustments why rental inflation should exclude, well, rental inflation.
Tyler Durden
Tue, 09/28/2021 – 18:25
via ZeroHedge News https://ift.tt/3kLfjxc Tyler Durden