By now, the fundamental pros/cons picture of the market should be familiar to most. In the “positive” category, Nomura’s Charlie McElligott notes that three key bullish drivers du jour are:
- i) the reloaded PBoC liquidity/China stimulus cannon, where Beijing’s injection- and stimulus-/easing- spree extended into this week’s deployment of the new term lending facility, a targeted version of the MLF tool which funds small businesses cheaper than the regular MLF, while also allowing 1Y funding to be rolled over twice—making 3.15% for effectively a 3 year loan (vs 3.3% at the traditional MLF window)—a de facto / stealth “rate cut” as perceived by some, which too still leaves room for further RRR cuts coming down the pipe in 2019;
- ii) ongoing “dovish” pivots by global central banks accelerating in light of the (China-linked) disinflationary impulse— overnight the Bank of Korea followed the BoJ and cut its inflation forecast overnight; this comes after ECB’s Draghi stated that significant stimulus is still needed to support inflation last week, Fed Chair Powell in Dec noting that inflation has “…continued to surprise to the downside” and all while UK consumer prices fell to two year lows in the background—While the SNB, BoJ, BoK and others have too recently acknowledge no plans to change from current “easier” footing
- iii) “Glass half-full” Equities EPS reception as the low-bar of negative earnings revisions are being bought—positivity around PG and UTX prints and today’s very bullish reception to STMicro, +8.8% despite weak sales guidance, all helping squelch terrible PMIs and provide calm.
More importantly, we have several key concerns in the “negative” category, among them the following:
- i) more global growth gloom against Nomura’s backdrop that Chinese data will “max out” to the downside likely out into 2Q19, including: The Euro-Area wide PMIs missing forecasts once again, specifically with German Manufacturing (contracted for the first time in four years) and French Services and Manu (both lowest in at least four years and contracting) looking particularly grim. Japan Mfg PMIs also crashed in horrible fashion, touching the ‘50’ line for the first time since Sep 2016 when the Nikkei was ~25% lower than current levels, while Japan Machine Orders crumbled -18.3% YoY as foreign orders disappeared.
- ii) it is getting far more difficult from here for the Fed to “pivot more dovish” unless US economic data significantly worsens first, which is a “pick your poison” scenario as either will finally trigger the “recession is coming” signal of UST yield curve steepening.
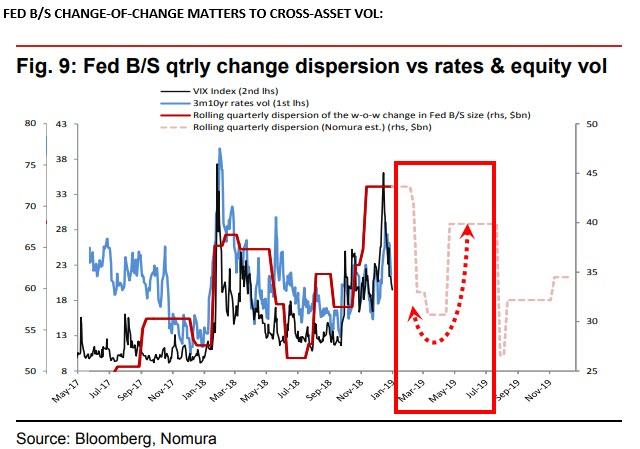
- iii) In the background, the Fed “QT” continues unabated—the good news, there is a “soft-patch” coming in 1Q19 of “less lumpy” Fed weekly roll-offs where in-particular the risk-asset sensitive MBS-portion should provide an easier backdrop vs a few of the shock balance-sheet tightening impulses experienced in 2018—but the “change of change” in balance-sheet (quarterly dispersion of the WoW change in SOMA size) again will “pick-up” into Q2, likely resulting in a new step-wise jump in Rate- and Equity volatility.
Of course, it is the daily battle between the “positives” and “negatives” that will determine the longer-run direction of the market.
None of this is a surprise to those traders who still follow the daily newsflow and attempts by central bankers to offset any adverse impact of reality on risk prices.
However, what is far more notable, is McElligott’s warning about what he sees as an imminent episode of sharply higher volatility, not due to any incremental news or economic or political event, but simply due to the vagaries of the market’s underlying algorithmic technicals. And yes, once again it is all about the CTAs, those trend-following algos who have been the cause of so much trader pain in recent years.
So why should traders brace for turbulence? McElligott explains in a “few fascinating observations”:
Recall that last week, McElligott pointed out that CTAs, until recently short, had started to cover. As it turns out that was only half the story, because given the strong performance last week in Equities, the strategist recalibrated his CTA model and it implies “EVEN LARGER ‘BUY TO COVER’ $FLOWS than we had initially anticipated last week.”
As a result, Nomura’s signal across Equities futures positions is now just “-56% Short” rather than “-91% Short” previously measured, with the price action / notional estimates updated and making rational sense with the scale of the ‘day’ moves highlight below:
- Implied buying of closer to ~$16bn of SPX (rather than ~$8bn as proposed initially) on 1/15/2019
- And incremental buying of ~$5bn on 1/18/2019
But the punchline, and the reason behind a potential volatility explosion, as we move forward, is that Nomura’s model is now showing a VERY outsized (and growing since 2H18) importance of the 1Y window across the various model time weightings, with ~78% of the overall “Equities” model impact being driven by the 1Y window.
Why is this CRITICAL? Because it was almost exactly 1 year ago that we saw the escalation of the US Equities/US Rates sell-off against the enormous cross-asset “short Vol” squeeze—so the “halcyon days” of early-to-mid January ‘18 have dropped-out of the 1Y window, and instead now we “pick-up” the very volatile days surrounding the Feb 5th 2018 “Vol Event” and larger “QE to QT” macro regime change era.
So what “points of interest” should traders be on the lookout for?
According to McElligott, 8-10 weekdays from now, there will be a number of “choppy” points that roll out of the 1 year window, all of which have outlier SPX returns (-2.3%, -5.4%, +3.3%) off the back of the VIX ETN market-event price action last year.
This would potentially cause “NOISY” signals from the bank’s model in 1-2 weeks’ time–assuming that our regression still generates significant weighting to the 1 year lookback window.
There is one footnote: “if we simply hover around flat in terms of performance the rest of this week, we project no significant changes to our model’s signals these next couple of days.” Should this happen, and at zero change projected-forward between now and that next week window – a big “if” – the next “buy to cover” would be at ~2805 while the next “re-leveraging of the short” would be at ~2317—both far OOTM.
* * *
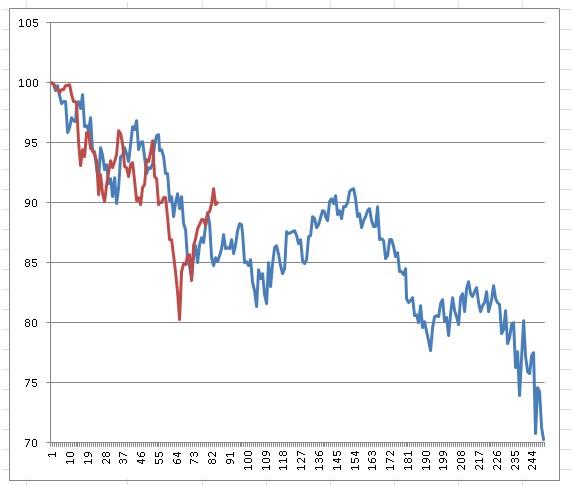
Finally, here is McElligott’s latest update of Nomura’s 2007-2008 analog:
This “void” per the SPX 2007-08 analog we’ve been tracking (of all the prior violent de-risk scenarios per trigger of “SPX -17.5% in 67 days or less,” the Oct 07-Oct 08 trade is the most highly correlated to this current selloff since Sep ’18) which has created this window for this short-term weakening call (after accurately calling the “top tick” last Friday, we are now entering day three of the overall average nine-day anticipated move lower), and so far is ~ -110bps of an anticipated overall -5% potential over the nine day window before my plan to “closing out” the down-trade call into Jan 31st / Feb 1st (which marks the “local low” date), as we then see another pivot to “upside” thereafter with catalysts aligning (the return of the corporate buyback and the analog signaling further extension of rally)
via ZeroHedge News http://bit.ly/2G22b2X Tyler Durden