Following this week’s surge in ADP private payrolls, the Street is looking for a trend-like 185k nonfarm payrolls print. And while the US unemployment rate is expected to remain unchanged, average hourly wage growth is seen ticking up to a near post-crisis high of 3.3%. However, as RanSquawk notes, payroll indicators are mixed heading into the data, although jobless claims falling to cyclical lows in the survey week augur well; however, other gauges, like ISM’s manufacturing PMI, as well as Challenger’s assessment of the labour market call for some caution, analysts say.
First, here is what Wall Street expects, via RanSquawk:
- Non-farm Payrolls: Exp. 185k, Prev. 196k.
- Private Payrolls: Exp. 180k, Prev. 182k; Manufacturing Payrolls: Exp. 10k, Prev. -6k.
- Unemployment Rate: Exp. 3.8%, Prev. 3.8% (the FOMC currently projects unemployment will stand at 3.7% at the end of 2019, and 4.3% in the longer-run).
- U6 Unemployment Rate: Prev. 7.3%.
- Labour Force Participation: Prev. 63.0%.
- Avg Earnings Y/Y: Exp. 3.3%, Prev. 3.2%; Avg Earnings M/M: Exp. 0.3%, Prev. 0.1%.
- Avg Work Week Hours: Exp. 34.5hrs, Prev. 34.5hrs.
The average pace of monthly payroll additions has been easing: 12-month nonfarm payroll headline has averaged 211k, 6-month average 207k, and 3-month average 180k. Nevertheless, “demand for workers remains strong given the economy’s robust performance, yet the shrinking pool of available labour means competition for staff is intense,” ING writes, “this is constraining employment growth and pushing up pay, which will support consumer spending while adding to medium term inflation risks.”
WAGES: The Phillips Curve-like relationship between the unemployment rate and wages is alive, but the link between the UR/wages and overall PCE/CPI has attenuated and that is the Fed’s focus, JPMorgan says, and the bank sees wages likely ticking higher vs March levels. Wells Fargo suggests keeping an eye on the participation rate: The bank says that the rebound in participation has kept wage pressures from building to the point where labour cost would set off inflation or severely strain profits (and therefore, Wells says the increase in labour force participation has provided the FOMC with another reason it can be patient with additional rate hike)
CLAIMS DATA: In the nonfarm payrolls survey period, initial jobless claims in the week fell to a fresh cyclical low at 193k. While this augurs well for the official payrolls data, Pantheon Macroeconomics notes that much of the decline in the first part of April looked like a seasonal adjustment issues; the next week saw a rebound to 230k, supporting that notion. Pantheon thinks the trend probably is still a bit below the 220K mark, but it should head down towards 210K in Q2 as consumer spending rebounds and, perhaps, capex picks up too.
ADP PAYROLLS: ADP’s gauge of payrolls printed 275k in April, beating the Street’s view for 180k, with analysts suggesting that it presents some upside potential for the official payrolls data consensus (185k). “. Unfortunately, the more reliable survey evidence and the temporary employment figures of the official series itself suggest our below-consensus forecast for a subdued 165k gain will be closer to the mark,” Capital Economics says, noting that the large increase in April was helped by an outsized 52k gain in employment in the goodsproducing sector, reflecting a subdued 5k gain in manufacturing payrolls, but a “suspiciously large” 49k gain in construction employment. Overall, CapEco says “the data suggest some upside risk to our forecast that the official figures will show payroll employment growth slowing to 165k in April, following a 196k gain in March,” but says that ADP data has not been an accurate predictor of the official NFP data, and are frequently revised; “so we prefer to rely on a much wider range of indicators, the vast majority of which point to slower employment growth ahead,” CapEco says.
ISM SURVEYS: The non-manufacturing ISM report is scheduled to be released after the NFP data; the manufacturing reports’ employment sub-index printed 52.4 points (-5.1 points vs. March), signalling that employment growth remains in expansion for the 31st straight month. “Employment continued to expand, but at lower levels compared to March,” ISM’s Fiore said, “retention issues and sourcing of skilled and professional labor were noted by respondents as continuing drags on production performance.” NOTE: An employment sub-index above 50.8, over time, is consistent with an increase in the BLS data on manufacturing employment.
CHALLENGER JOB CUTS: Job cuts fell to 40k in April, +31% Y/Y. This was the lowest monthly total since last August. Despite the monthly drop, April cuts are still +11% vs April 2018, and so far this year, employers have announced 230k job cuts, +31% vs the first four months of last year. “The second quarter averages the fewest cuts of the year, according to our historical tracking,” Challenger said, “with the favourable jobs report from the Bureau of Labor Statistics in March, this could signify companies are slowing down plans to cut workers for the spring and summer months.” It also said that the high job cut numbers in the manufacturing and automotive sectors are “troubling, as changes in these industries tend to have a trickle-down effect,” he added. Challenger says that the majority of cuts this year are due to “restructuring,” with 55.7k cuts announced due to this reason. “While the lower number of cuts last month is certainly a good sign, and we saw a huge hiring announcement in the Retail sector from McDonald’s last month, we are still seeing more than a 30% increase in cuts over last year. The sectors that are making cuts could indicate trouble ahead,” Challenger added.
* * *
Finally, some qualitative considerations, via Goldman Sachs:
Arguing for a stronger report:
Jobless claims. Initial jobless claims declined over the four weeks between the payroll reference periods (-19k to 202k on average, lowest since 1969, and 193k in the payroll reference week). While claims rebounded sharply in the two weeks after the April payroll month, averaging across these periods continues to suggest that the pace of layoffs remains very low. Continuing claims also fell from survey week to survey week (-101k to 1,654k).
Business surveys. The employment components of both our manufacturing and services employment trackers declined (-1.0pt to 55.9 and -0.2pt to 55.1, respectively), but this only partially reversed the sizeable rebound in March. The headline indices of business surveys were mixed in April[1]. Taken together, the level of business surveys still suggests solid job growth in April (see Exhibit 1). Service-sector job growth rose 170k in March and averaged 171k over the last six months. Manufacturing payroll employment declined 6k in March and increased 15k on average over the last six months.
ADP. The payroll-processing firm ADP reported a 275k increase in April private payroll employment—95k above consensus and well above the +210k average pace over the prior six months. While encouraging at the margin, we see several reasons not to overreact to the ADP beat. First, prior-month nonfarm payroll growth and jobless claims are both inputs to the ADP model and likely contributed to the strength. Second, ADP noted in the report text that “April’s job gains overstate the economy’s strength” and suggested in comments on CNBC that the report is consistent with April nonfarm payroll growth of 175k-200k. We also note that weather tends to affect the official payroll measure more so than it affects the ADP series (a negative factor this month, in our view).
Arguing for a weaker report:
Winter weather. We believe winter weather boosted job growth in last month’s report, but only by around 10k. And while winter weather typically does not matter as much for the April employment report, a relatively late and large storm affected much of the Midwest during the survey week (Winter Storm Wesley). Historically, we find that above-average snowfall in the Midwest in April does indeed weigh on weather-sensitive categories. At 0.7 inches above normal (population-weighted basis), we estimate that April snowfall may have lowered growth by around 20k in the region.
Job availability. The Conference Board labor market differential—the difference between the percent of respondents saying jobs are plentiful and those saying jobs are hard to get—rebounded by 4.8pt to 33.5 in April. However, other jobs availability readings were weak, as JOLTS job openings fell sharply (-538k to 7,087k in February) and the Conference Board’s Help Wanted Online index declined (-1.7pt to 102.3 in March). We note that the JOLTS measure may be somewhat backward looking at this point, and its signal may have already been reflected in the softer February payroll gain (+33k).
Job cuts. Announced layoffs reported by Challenger, Gray & Christmas declined by 13k in April to 39k (SA by GS). However, they remain modestly above their April 2018 level (+5k yoy).
Census hiring. The hiring of temporary federal workers ahead of the 2020 Census has so far proceeded very slowly, lagging those of the prior two decades (see Exhibit 3).
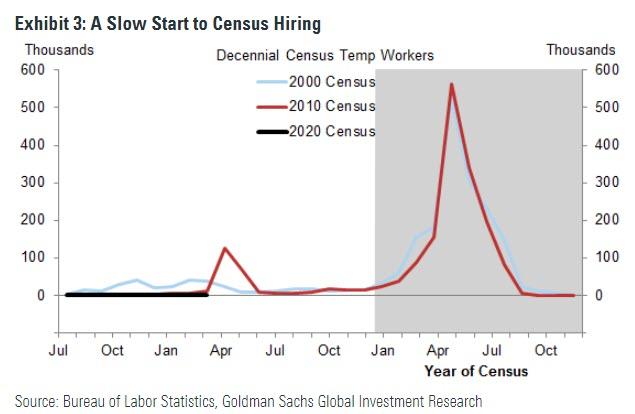
And while in April 2009 (the employment report exactly 10 years ago), Census hiring boosted nonfarm payroll growth by 114k jobs, we expect only a modest boost in tomorrow’s figures, likely between 1k and 10k. It appears that the recruiting process commenced only recently (and may have been delayed by the government shutdown).
via ZeroHedge News http://bit.ly/2Wtmds8 Tyler Durden