What Does A Catastrophic First Half Mean For The Rest Of The Year (Spoiler: Nothing Good)
Contrary to some erroneous and superficial assessments that a catastrophic first half of the year has historically been good for future returns, the reality is that an ugly H1 – and this year was certainly ugly, in fact the worst first half since 1970 – suggests a volatile and lackluster second half.
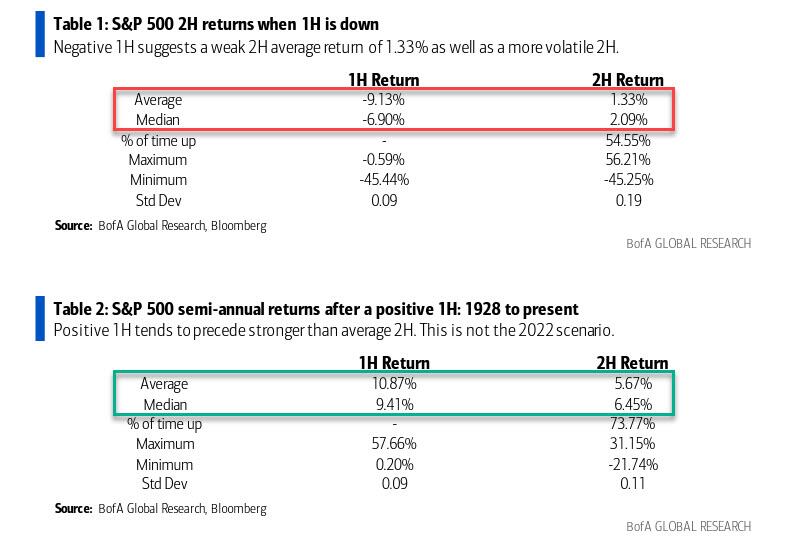
According to the latest analysts from BofA chief technician Stephen Suttmeier (full note available to pro subs), when the SPX Index has a negative first half of the year, the second half of the year tends to recover but is much less robust. The 2H average return after a down 1H is 1.33% (2.09% median), which is considerably lower when compared to the average return after a positive 1H of 5.67% (6.45% median). Additionally, after a down 1H, 2H tends to have a lower percent of time up, as well as more volatile returns given that the range of returns tends to be double that of 2H returns after a positive 1H.
There is some silver lining, and it has to do with midterm years: according to Suttmeier, after a down 1H, the midterm year tends to recover in 2H and is up 55% of the time on an average return of 4.42% (3.38% median)
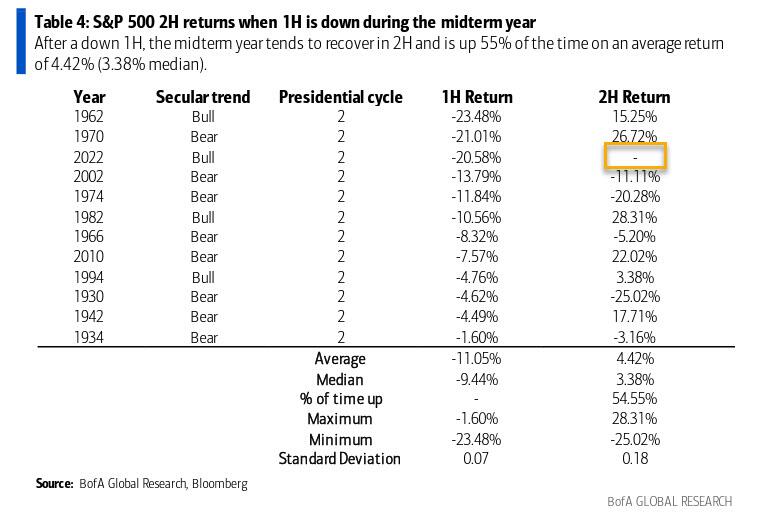
Of course, one has to look back decades to find a similar shitshow when it comes to US governance, so it’s probably best to not get one’s hopes up, although once the market starts pricing in the Democratic devastation of the midterms, it’s not too far-fetched to see stocks soaring in anticipation.
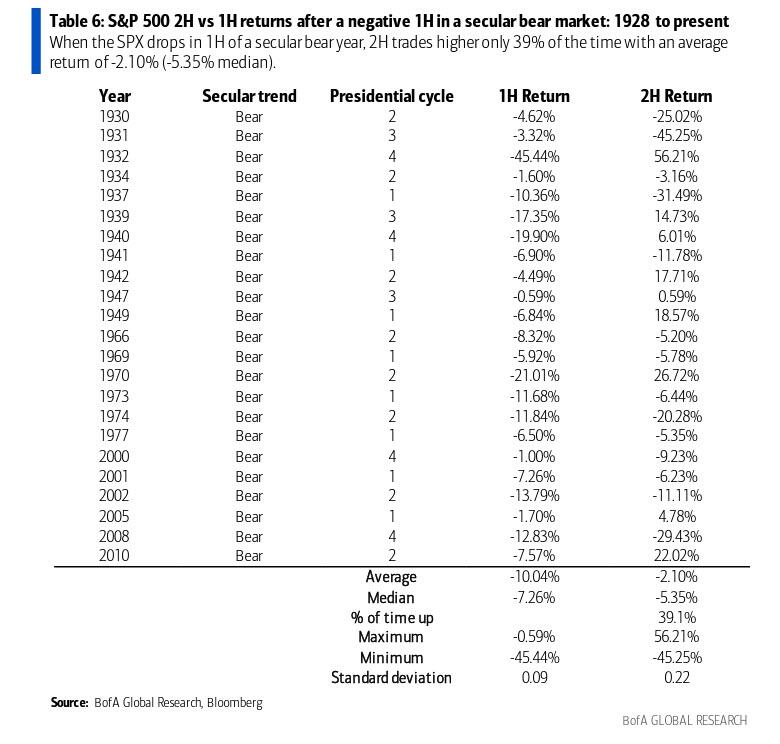
Midterm outliers aside, the BofA goes down the list of historic events with some more bad news: specifically, as the data next show, first half declines often precedes a down 2H during bear markets, which this now is. According to Suttmeier, “when the SPX drops in 1H of a secular bear year, 2H trades higher only 39% of the time with an average return of -2.10% (-5.35% median). The range of 2H returns after a down 1H are also more volatile during a secular bear market vs a secular bull market.”
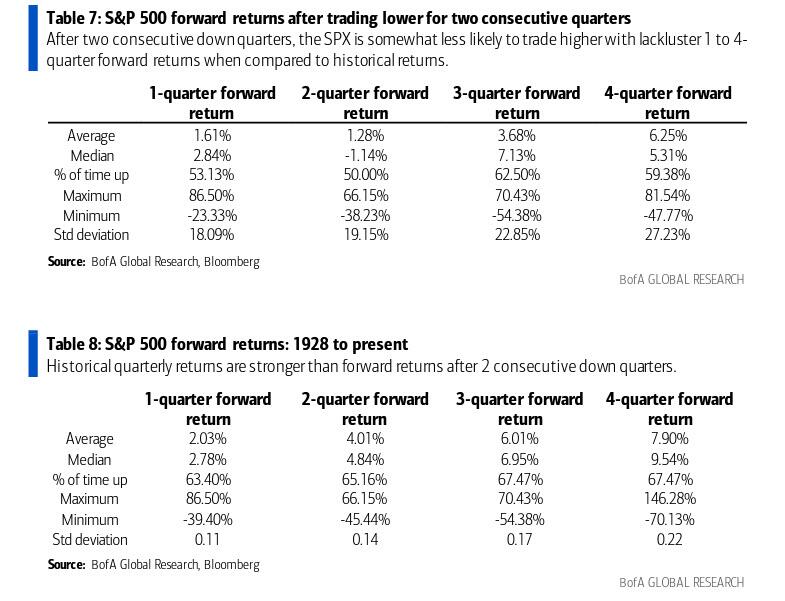
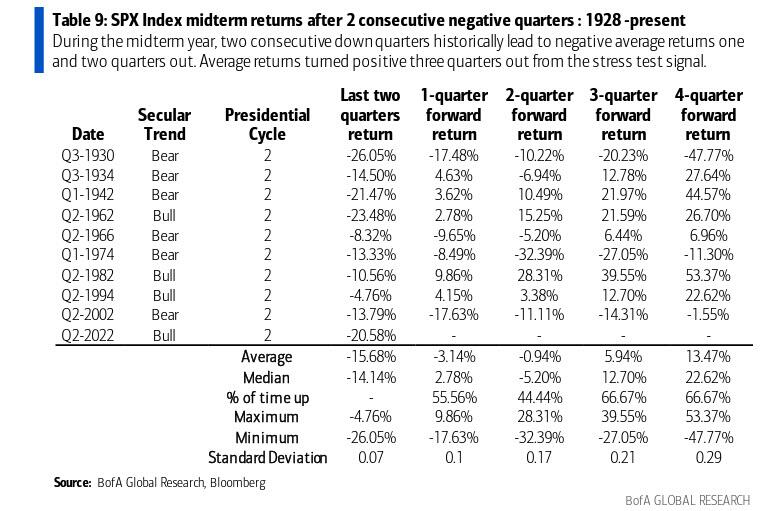
There’s more, because as Suttmeier shows next, 2 consecutive down quarters = lackluster forward returns. As the BofA technician reminds us, the SPX was down 16.46% in 2Q, which follows a 1Q drop of 4.95%. After two consecutive down quarters, the SPX is somewhat less likely to trade higher with lackluster 1 to 4-quarter forward returns. The biggest drag on forward returns is at the 2-quarter forward return period. Going out one year shows the SPX up 59% of the time on an average return of 6.25% (5.31% median), which compares to a historical average return of 7.90% (9.54% median) with the SPX up 67% of the time.
Going back to the “midterm year” special case, Suttmeier notes that two consecutive down quarters either within or heading into the midterm year “provide a stress test for the Presidential Cycle. This scenario shows weaker returns going out from one to two quarters prior to better 3-quarter returns and more robust 4-quarter returns. In our view, this is a risk for 2H 2022 SPX returns.”
One final point from BofA on the big picture, and it has to do with pullbacks: yes, over the long run stocks have enjoyed a higher path since 1930s but with plenty of big dips.
After the 1929 market crash and downtrend into a 1932 low, the SPX has trended higher, but only surpassed the 1929 peak in 1954, a quarter century later! Intra-day data show an early January into mid June cyclical bear market of 24.5%, which corrects the 120% rally from the March 2020 low.
The chart below shows that big rallies over the years get interrupted by sizeable corrections, but the SPX has trended higher over time, especially after bullish breakouts in 1950, 1950, 1980 and 2013.

According to Suttmeier, the big pullbacks in the chart above average 36.7% (29.6% median).
The table below provides the key statistics around the biggest drawdowns that the SPX has seen throughout the years. The average drop of 36.7% lasts 17 months, while the median drop lasts 14 months and is less severe at 29.6%. Rallies from big lows take a while to recover the prior high The data for all pullbacks back to the late 1920s suggest that the rallies from big correction lows to a monthly close above the prior intra-month high happen 55 months later on average on an average rally of 91.4%. The median rally from the low to a close above the prior monthly high is 42.1% and takes 25 months.
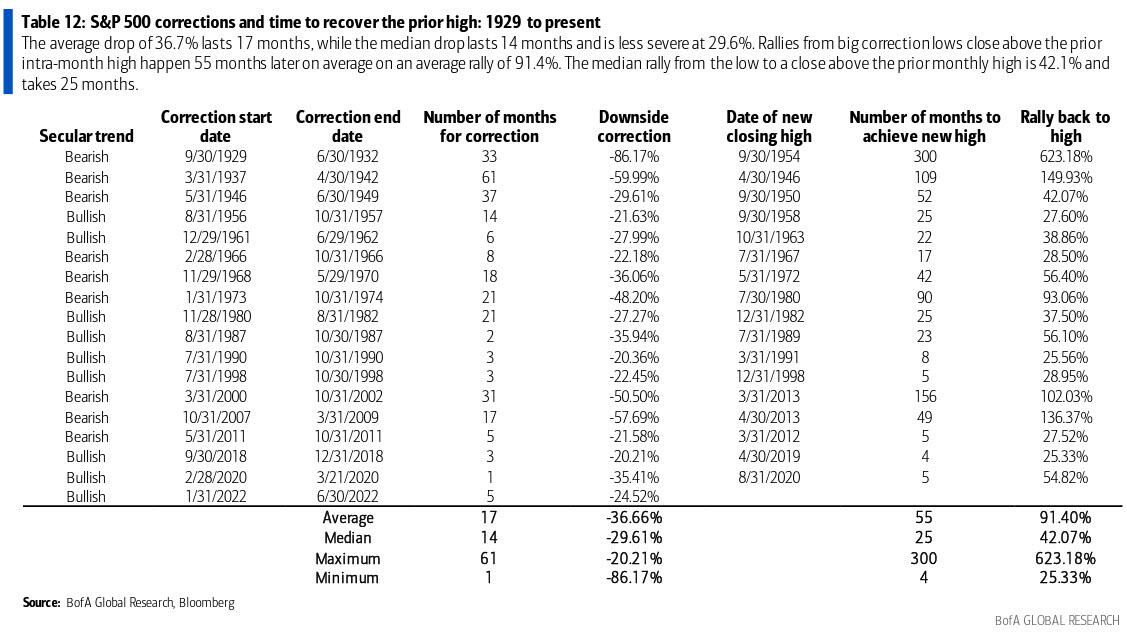
Finally, those wondering how long they have to wait for a new high, the answer is (on average) just over two years, as rallies from lows to new highs from five to 25 months.
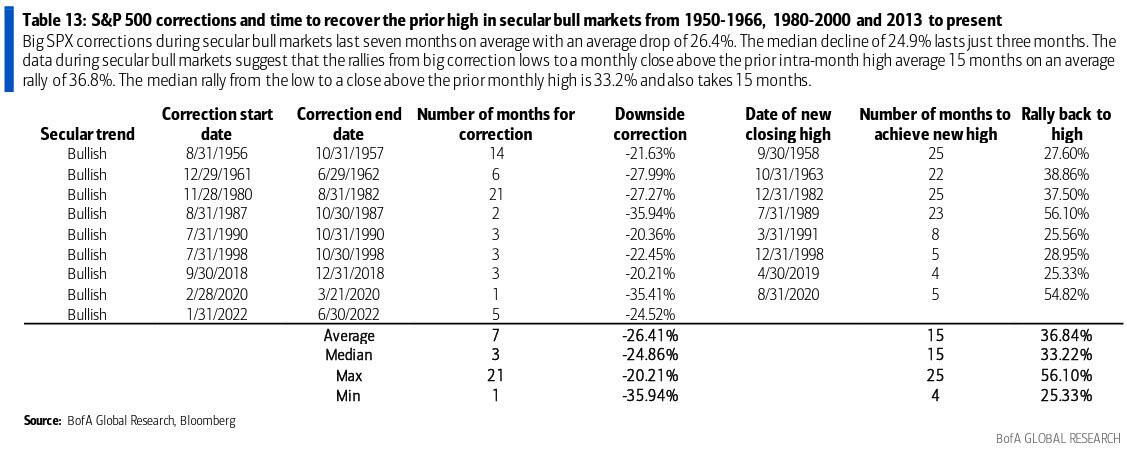
The data during secular bull markets suggest that the rallies from big correction lows to a monthly close above the prior intra-month high average 15 months on an average rally of 36.8%. The median rally from the low to a close above the prior monthly high is 33.2% and also takes 15 months. However, the rallies from the lows in 1957, 1962, 1982 and 1987 took 22 to 25 months to surpass the prior high, while those from lows in 1990, 1998, 2018 and 2020 took only four to eight months to achieve a new high.
There are many more stats in the full BofA report available to professional subs.
Tyler Durden
Tue, 07/05/2022 – 15:29
via ZeroHedge News https://ift.tt/Xa6APOs Tyler Durden