35 Chinese Cities Have Economies As Big As Countries

Gaining perspective on China’s monstrous economy isn’t always the easiest thing to do.

As Visual Capitalist's Jeff Desjardins notes, with 1.4 billion people and the third-largest geographical area, the country is a vast place to begin with. Add in explosive economic growth, a market-oriented but Communist government, a longstanding and complex cultural history, and self-inflicted demographic challenges – and understanding China can be even more of a puzzle.

Courtesy of: Visual Capitalist

CITY BY CITY

To truly grasp the emergence of China, one approach is to look at the impressive economic footprint made by the country’s cities.

Of course, cities like Shanghai, Beijing, and Hong Kong are the metro economic powerhouses that most people are familiar with. But have you heard of cities like Shijiazhuang, Wuxi, Changsha, Suzhou, Ningbo, Foshan, or Yantai?

There are literally dozens of Chinese cities that most people in Western countries have never heard of – yet they each hold millions of people and have an economic output comparable to nations.

The infographic above illustrates 35 of them, but here’s a list of 10 of them, the size of their local economy, and a comparably sized national economy:

MEGAREGIONS

It’s also important to remember that these cities don’t exist in isolation, and are instead cogs in the wheels of larger megaregions. Such areas would be comparable to the Northeast U.S., in which New York City, Philadelphia, Boston, Baltimore, and Washington, D.C. are all hours apart and remain largely integrated as a regional economy.

In China, there are three main megaregions worth noting:

Yangtze River Delta
With a combined GDP of $2.17 trillion, which is comparable to Italy, the Yangtze River Delta contains cities like Shanghai, Suzhou, Hangzhou, Wuxi, Ningbo, and Changzhou.

Pearl River Delta
With a combined GDP of $1.89 trillion, which is comparable to South Korea, the Pearl River Delta has cities like Hong Kong, Guangzhou, Shenzhen, Foshan, Dongguan, and Macao.

Beijing-Tianjin
With a combined GDP of $1.14 trillion, which is comparable to Australia, this megaregion holds the two largest cities in northern China, Beijing and Tianjin. The two cities are a 30-minute bullet train ride apart.

via http://ift.tt/2zxjS6T Tyler Durden

Paul Craig Roberts Laments “I Don’t Recognize My Country Today”

Authored by Paul Craig Roberts,

Having grown up during the second half of the 20th century, I don’t recognize my country today. I experienced life in a competent country, and now I experience life in an incompetent country.

Everything is incompetent.

The police are incompetent. They shoot children, grandmothers, cripples, and claim that they feared for their life.

Washington’s foreign policy is incompetent. Washington has alienated the world with its insane illegal attacks on other countries. Today the United States and Israel are the two most distrusted countries on earth and the two countries regarded as the greatest threat to peace.

The military/security complex is incompetent. The national security state is so incompetent that it was unable to block the most humiliating attack in history against a superpower that proved to be entirely helpless as a few people armed with box cutters and an inability to fly an airplane destroyed the World Trade Center and part of the Pentagon itself. The military industries have produced at gigantic cost the F-35 that is no match for the Russian fighters or even for the F-15s and F-16s it is supposed to replace.

The media is incompetent. I can’t think of an accurate story that has been reported in the 21st century. There must be one, but it doesn’t come to mind.

The universities are incompetent. Instead of hiring professors to teach the students, the universities hire administrators to regulate them. Instead of professors, there are presidents, vice presidents, chancellors, vice chancellors, provosts, vice provosts, assistant provosts, deans, associate deans, assistant deans. Instead of subject matter there is speech regulation and sensitivity training. Universities spend up to 75% of their budgets on administrators, many of whom have outsized incomes.

The public schools have been made incompetent by standardized national testing. The purpose of education today is to pass some test. School accreditation and teachers’ pay depend not on developing the creativity or independent thinking of those students capable of it, but on herding them through memory work for a standardized test.

One could go on endlessly.

Instead, I will relate a story of everyday incompetencies that have prevented me from writing this week and for a few more days yet.

Recently, while away from my home, a heavy equipment operator working on a nearby construction site managed to drive under power lines with the fork lift raised. Instead of breaking the wire, it snapped the pole in half that conveyed electric power to my house. The power company came out, or, as I suspect, an outsourced contractor, who reestablished power to my home but did not check that the neutral wire was still attached. Consequently for a week or so my house experienced round the clock surges of high voltage that blew out the surge protection, breaker box, and every appliance in the house. Expecting my return, the house was inspected, and the discovery was that there was no power. Back came the power company and discovered that high voltage was feeding into the house and had destroyed everything plugged in.


So. Here we have a moron operating heavy equipment who does not understand that he cannot drive under power lines with the lift raised. We have a power company or its outsourced contractor who does not understand that power cannot be reconnected without making certain that the neutral wire is still connected.


So every appliance is fried. Glass everywhere from blown out light bulbs. We are talking thousands of dollars.

This is America today.

And the incompetents ruling incompetents want war with Iran, Korea, Russia, China. Considering the extraordinary level of incompetence throughout the United States, I guarantee you that we will not win these wars.

via http://ift.tt/2jhNfo1 Tyler Durden

More New Normal – Buy Bloomberg’s “Bubblicious” Index Of Bubbles – Make Out Like A Bandit

If only every year was this “easy”.

Unfortunately, the old adage of the trend being your friend becomes harder to adhere to as a guidepost as one asset market after another goes into bubble territory. As we discussed here, Alberto Gallo of Algebris Investments has ranked (see here) the top 14 bubbles worldwide, according to characteristics such as duration, appreciation, valuation and the degree of irrational behaviour.

When we started in this industry, we were taught by those with the gray hair of experience that betting against the herd was the key to success. Turning up on January 1, imagine the look on their faces if you’d told them you’d bought a portfolio of everything that had gone parabolic (or almost) the previous year. Luckily for them, markets were relatively free and absent $15 trillion of price insenstive asset purchases by central banks. Fundamentals counted for somethiing – and will again (we hope) – there’s just the small matter of getting to the other side of the current bubble, sorry bubble(ssssssssssssssssssssssssssss).

In 2017, the strategy of buying bubbles has obviously worked almost perfectly or, as Bloomberg notes,“Investors can either buy bubbles or be left far behind”. Indeed, it’s gone to the trouble (see here) of creating ts own “Bubblicious” index, which includes an equal weighting of a host of the “usual suspects”. These include:

  • Sunac China Holdings Ltd.: perhaps the poster child of the real-estate frenzy in the world’s second-largest economy, this company’s aggressive acquisition strategy has been met with raised eyebrows among regulators at a time when China is trying to rein in the country’s financial risk.
  • Tencent Holdings Ltd.: A 2,600 percent rise in the past decade? Tencent is the leader of the pack when it comes to Asian tech stocks that have made the sector the biggest component of the MSCI Asia Pacific Index for the first time since the internet bubble.
  • Tesla Inc. and Netflix Inc.: two U.S. tech companies that have both been branded with the b-word by hedge fund manager Einhorn.
  • VelocityShares Daily Inverse VIX Short-Term ETN, ticker XIV: this exchange-traded note is a proxy for the presumed “short volatility” bubble that’s seen investors bet billions of dollars on the prospect of not much happening in markets.
  • Bitcoin Investment Trust, ticker GBTC: the cryptocurrency fund that typically trades at a substantial premium to its net asset value. Bitcoin itself has been called a bubble by bank CEOs including JP Morgan Chase & Co.’s Jamie Dimon, ethereum co-founder Joseph Lubin and many more.
  • ETF Industry Exposure & Financial Services ETF, ticker TETF: this meta exchange-traded product holds a basket of firms poised to benefit the most from the explosion in ETFs — a proxy for the “passive bubble.”
  • Lots of long bonds: The iShares 20+ Year Treasury Bond ETF has enjoyed $1.8 billion worth of inflows in a year that saw former Federal Reserve Chair Alan Greenspan warn of a massive bubble in the space. Meanwhile yields on German sovereign debt maturing in 2048 and Japanese bonds maturing in 2050 have dipped ever lower, sealing the latter’s reputation as a ‘widow maker’ for frustrated shorts. The portfolio also includes the infamous Argentinian century bond.

Bloomberg observes that its broad range of choices mean that its Bubblicious portfolio is “fairly well diversified” across the many bubbles. Actually, it could have been more diversified. While we don’t disagree with the inclusion of any of Bloomberg’s picks, it’s worth noting that compared with Gallo’s list, the Bubblicious portfolio does not include European high yield, EM high yield or any of the obvious property bubbles outside China. London, for example, and Australian cities, such as Sydney and Melbourne. Unlike Gallo, we might have chosen New Zealand property instead of London property (where prices have started falling) and, while Bloomberg has chosen Sunac as its “poster child” for Chinese real estate, China Evergrande and others would be equally valid.

Anyway, as Bloomberg explains, the “Bubblicious” index has risen by well more than 120% so far this year.

The best way to crush the crowd in 2017? Buy the things everyone insisted would never keep going up. A portfolio stuffed with allegedly over-inflated assets would have returned more than 120 percent so far in 2017, trouncing the S&P 500 Index and underscoring the challenge for investors facing a plethora of pricey securities.

As the chart shows, if you’d gone “Bubblicious” on 1 January 2017, you’d have smashed the S&P 500 "out of sight" by more than 100%.

As Bloomberg laments.

The hypothetical ‘Bubblicious’ portfolio includes Chinese real estate and internet names, a pair of U.S. tech behemoths, a cryptocurrency fund, the ETF industry, bonds that mature decades from now, and a dash of short volatility bets just to make things more interesting.


The out-performance is a testament to the momentum mania prevalent in today’s markets, a dynamic which has prompted the likes of Greenlight Capital’s David Einhorn, Goldman Sachs Group Inc., and Sanford C Bernstein & Co. LLC to mull whether value investing is in the midst of an existential crisis given ultra-low interest rates and abundant liquidity.

Of course it is, but the nature of markets is that they move in cycles. This cycle happens to be the most unpleasant cycle for value investors, active managers and contrarian thinkers, but it’s still a cycle.

via http://ift.tt/2zLvfJr Tyler Durden

13 Baltimore High Schools Have Zero Students That Are Proficient In Math

For the past several weeks, one Fox affiliate in Baltimore has been publishing some staggering stories about the Baltimore public school system under an investigative series called “Project Baltimore.”  Just a few weeks ago we noted one of those stories in which an undercover teacher admitted that public schools routinely pass kids that never even bother to show up for class a single day during the school year.

Now, a stunning new installment of the Project Baltimore series from Fox 45 reveals that 13 public high schools sprinkled around Baltimore, of the city’s 39 total, had exactly 0 kids that tested proficient in math. 

An alarming discovery coming out of City Schools. Project Baltimore analyzed 2017 state testing data and found one-third of High Schools in Baltimore, last year, had zero students proficient in math.


Project Baltimore analyzed 2017 state test scores released this fall. We paged through 16,000 lines of data and uncovered this: Of Baltimore City’s 39 High Schools, 13 had zero students proficient in math.


  • Achievement Academy
  • Carver Vocational-Technical High
  • Coppin Academy
  • Excel Acadamy @ Francis M. Wood High
  • Forest Park High
  • Frederick Douglass High
  • Independence School Local 1
  • Knowledge and Success Academy
  • New Era Academy
  • New Hope Academy
  • Northwestern High
  • Patterson High
  • The Reach! Partnership School

Meanwhile, digging a bit deeper, Fox 45 also found that of the 3,804 students in Baltimore’s worst 19 high schools, only 14 of them, or less than 1%, were proficient in math.

Digging further, we found another six high schools where one percent tested proficient. Add it up – in half the high schools in Baltimore City, 3804 students took the state test, 14 were proficient in math.


  • Ben Franklin H.S. at Masonville Cove
  • ConneXions: Community Based Arts SchoolDigital Harbor High School
  • Edmondson-Westside High
  • Renaissance Academy
  • Vivien T. Thomas Medical Arts Academy

Not sursprisingly, only one Baltimore school replied to Fox 45 with a generic comment suggesting that improvement is difficult and “will take time.”  That said, why do we suspect that ‘improvement’ will also take just a little more taxpayer money despite the fact that Baltimore already spends $16,000 per year per student…which, mind you, is more than many private schools that deliver far better results.

With these eye-opening results, Project Baltimore reached to North Avenue. But no one inside the building would sit down to answer our questions. Instead, we got a statement. Concerning our investigation, it read, “These results underscore the urgency of the work we are now pursuing. We must do more to meet the needs of all our students.”


That work, according to the statement, involves a new math curriculum started this year, enhanced teacher development and expanded partnerships to provide opportunities for students.


The statement concludes, “There is no simple answer that will close the achievement gap for Baltimore’s students. Though we all want to see results quickly, the work is hard and will take time.”

Of course, we’re almost certain that these poor results have absolutely nothing to do with Baltimore’s stellar, unionized teachers and administrators who will undoubtedly get to maintain their jobs and exorbitant public pensions despite the complete failure of their students.

via http://ift.tt/2hhOj6U Tyler Durden

“Lull Before The Storm” – Will China Bring An Energy-Debt Crisis?

Authored by Gail Tverberg via Our Finite World blog,

It is easy for those of us in the West to overlook how important China has become to the world economy, and also the limits it is reaching. The two big areas in which China seems to be reaching limits are energy production and debt. Reaching either of these limits could eventually cause a collapse.

China is reaching energy production limits in a way few would have imagined. As long as coal and oil prices were rising, it made sense to keep drilling. Once fuel prices started dropping in 2014, it made sense to close unprofitable coal mines and oil wells. The thing that is striking is that the drop in prices corresponds to a slowdown in the wage growth of Chinese urban workers. Perhaps rapidly rising Chinese wages have been playing a significant role in maintaining high world “demand” (and thus prices) for energy products. Low Chinese wage growth thus seems to depress energy prices.

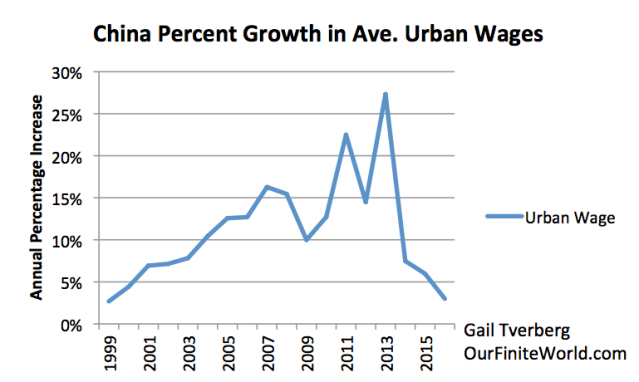
(Shown as Figure 5, below). China’s percentage growth in average urban wages. Values for 1999 based on China Statistical Yearbook data regarding the number of urban workers and their total wages. The percentage increase for 2016 was based on a Bloomberg Survey.

The debt situation has arisen because feedback loops in China are quite different from in the US. The economic system is set up in a way that tends to push the economy toward ever more growth in apartment buildings, energy installations, and factories. Feedbacks do indeed come from the centrally planned government, but they are not as immediate as feedbacks in the Western economic system. Thus, there is a tendency for a bubble of over-investment to grow. This bubble could collapse if interest rates rise, or if China reins in growing debt.

China’s Oversized Influence in the World

China plays an oversized role in the world’s economy. It is the world’s largest energy consumer, and the world’s largest energy producer. Recently, it has become the world’s largest importer of both oil and of coal.

In some sense, China is the world’s largest economy. Usually we see China referred to as the world’s second largest economy, based on GDP converted to US dollars. Economists use an approach called GDP (PPP) (where PPP is Purchasing Power Parity) when computing world GDP growth. When this approach is used, China is the world’s largest economy. The United States is second largest, and India is third.

Figure 1. World’s largest economies, based on energy consumption and GDP based on Purchasing Power Parity. Energy Consumption is from BP Statistical Review of World Energy, 2017; GDP on PPP Basis is from the World Bank.

Besides being (in some sense) the world’s largest economy, China is also a country with a very significant amount of debt. The government of China has traditionally somewhat guaranteed the debt of Chinese debtors. There is even a practice of businesses guaranteeing each other’s debt. Thus, it is hard to compare China’s debt to the debt level elsewhere. Some analyses suggest that its debt level is extraordinarily high.

How China’s Growth Spurt Started

Figure 2. China’s energy consumption, based on data from BP Statistical Review of World Energy, 2017.

From Figure 2, it is clear that something very dramatic happened to China’s coal consumption about 2002. China joined the World Trade Organization in December 2001, and immediately afterward, its coal consumption soared.

Countries in the OECD, whether they had signed the 1997 Kyoto Protocol or not, suddenly became interested in reducing their own greenhouse gas emissions. If they could outsource manufacturing to China, they would be able to reduce their reported CO2 emissions.

Besides reducing reported CO2 emissions, outsourcing manufacturing to China had two other benefits:

  • The goods being manufactured in China would be cheaper, allowing Americans, Europeans, and Japanese to buy more goods. If more “stuff” makes people happy, citizens should be happier.
  • Businesses would suddenly have a new market in China. Perhaps the people of China would start buying goods made elsewhere.

Of course, a major downside of moving jobs to China and other Asian nations was the likelihood of fewer jobs elsewhere.

Figure 3. US Labor Force Participation Rate, as prepared by Federal Reserve Bank of St. Louis.

In the early 2000s, when China started competing actively for jobs, the share of people in the US workforce started shrinking. The drop-off in labor force participation did not level out until mid-2014. This is about when world oil prices began to fall, and, as we will see in the next section, when China’s growth in average wages began to fall.

Another downside to moving jobs to China was more CO2 emissions on a worldwide basis, even if emissions remained somewhat lower locally. CO2 emissions on imported goods were not “counted against” a country in its CO2 calculations.

Figure 4. World carbon dioxide emissions, split between China and Rest of the World, based on BP Statistical Review of World Energy, 2017.

At some point, we should not be surprised if countries elsewhere start pushing back against the globalization that allowed China’s rapid growth. In some sense, China has lived in an artificial growth bubble for many years. When this artificial growth bubble ends, it will be much harder for China’s debtors to repay debt with interest.

China’s Rapid Wage Growth Stopped in 2014

Rising wages are important for making China’s growth possible. With rising wages, workers can increasingly afford the apartments that are being built for them. They can also increasingly afford consumer goods of many kinds, and they can easily repay debts taken out earlier. The catch, however, is that wage growth cannot get ahead of productivity growth, or the price of goods will become too expensive on the world market. If this happens, China will have difficulty selling its goods to others.

China’s wage growth seems to have slowed remarkably, starting in 2014.

Figure 5. China’s percent growth in average urban wages. Values for 1999 based on China Statistical Yearbook data regarding the number of urban workers and their total wages. The percentage increase for 2016 was estimated based on a Bloomberg Survey.

This is when China discovered that its high wage increases were making it uncompetitive with the outside world. Wage growth needed to be reined in. Its growth in productivity was no longer sufficient to support such large wage increases.

China’s Growth in Energy Consumption Also Slowed About 2014 

If we look at the annual growth in total energy consumption and electricity consumption, we see that by 2014 to 2016, their growth had slowed remarkably (Figure 6). Their growth pattern was starting to resemble the slow growth pattern of much of the rest of the world. Energy growth allows an economy to increasingly leverage the labor of its workforce with more energy-powered “tools.” With low energy growth, it should not be surprising if productivity growth lags. With low productivity growth, we can expect low wage growth.

Figure 6. China’s growth in consumption of total energy and of electricity based on data from BP Statistical Review of World Energy, 2017.

It is possible that the increased rate of electricity consumption in 2016 is related to China’s program of housing migrant workers in unsalable apartments that took place at that time. The fact that these apartments were otherwise unsalable was no doubt influenced by the slowing growth in wages.

This decrease in energy consumption most likely occurred because the price of China’s energy mix was becoming increasingly expensive. For one thing, the mix included a growing share of oil, and oil was expensive. The proportion of coal in the mix was falling, and the replacements were more expensive than coal. There was also the issue of the general increase in fossil fuel prices.

Lower Wage Growth in China Likely Affected Fossil Fuel Prices

Affordability is the big issue with respect to how high fossil fuel prices can rise. The issue is not just buying the oil or coal or natural gas itself; it is also being able to afford the goods made with these fuels, such as food, clothing, appliances, and apartments. If wages were depressed in the developed countries because of moving production to China, then rising wages in China (and other similar countries, such as India and the Philippines) must somehow offset this problem, if fossil fuel prices are to remain high enough for extraction to continue.

Figures 7 and 8 (below) show that oil, natural gas, and coal prices all started to slide, right about the time China’s urban wages growth began shrinking (shown in Figure 5).

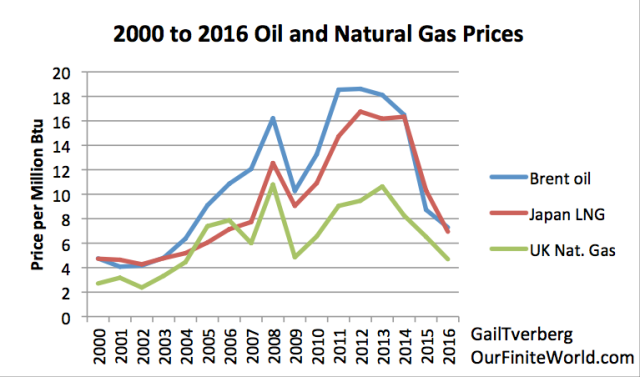
Figure 7. Oil and natural gas prices, based on BP Statistical Review of World Energy data.

Figure 8. Coal prices between 2000 and 2016 from BP Statistical Review of World Energy. Chinese coal is China Qinhuangdao spot price and Japanese coal is Japan Steam import cif price, both per ton.

The lower recent increases made China’s urban wage growth look more like that of the US and Europe. Thus, in 2014 and later, Chinese urban wages present much less of a “push” on the growth of the world economy than they had previously. Without this push of rising wages, it becomes much harder for the world economy to grow very rapidly, and for it to have a very high inflation rate. There is simply not enough buying power to push prices very high.

It might be noted that the average Chinese urban wage increases shown previously in Figure 5 are not inflation adjusted. Thus, in some sense, they include whatever margin is available for inflation in prices as well as the margin that is available for a greater quantity of purchased goods. Because of this, these low wage increases may help explain the recent lack of inflation in much of the world.

Quite likely, there are other issues besides China’s urban wage growth affecting world (and local) energy prices, but this factor is probably more important than most people would expect.

Can low prices bring about “Peak Coal” and “Peak Oil”?

What does a producer do in response to suddenly lower market prices–prices that are too low to encourage more production?

This seems to vary, depending on the situation. In the case of coal production in China, a decision was made to close many of the coal plants that had suddenly become unprofitable, thanks to lower coal prices. No doubt pollution being caused by these plants entered into this decision, as well. So did the availability of other coal elsewhere (but probably at higher prices), if it is ever needed. The result of this voluntary closure of coal plants in response to low prices caused the drop in coal production shown in Figure 8, below.

Figure 8. China’s energy production, based on data from BP Statistical Review of World Energy, 2017.

It is my belief that this is precisely the way we should expect peak coal (or peak oil or peak natural gas) to take place. The issue is not that we “run out” of any of these fuels. It is that the coal mines and oil and gas wells become unprofitable because wages do not rise sufficiently to cover the fossil fuels’ higher cost of extraction.

We should note that China has also cut back on its oil production, in response to low prices. EIA data shows that China’s 2016 oil production dropped about 6.9% compared to 2015. The first seven months of 2017 seems to have dropped by another 4.2%. So China’s oil is also showing what we would consider to be a “peak oil” response. The price is too low to make production profitable, so it has decided that it is more cost-effective to import oil from elsewhere.

In the real world, this is the way energy limits are reached, as far as we can see. Economists have not figured out how the system works. They somehow believe that energy prices can rise ever higher, even if wages do not. The mismatch between prices and wages can be covered for a while by more government spending and by more debt, but eventually, energy prices must fall below the cost of production, at least for some producers. These producers voluntarily give up production; this is what causes “Peak Oil” or “Peak Coal” or “Peak Natural Gas.”

Why China’s Debt System Reaches Limits Differently Than Those in the West

Let me give you my understanding regarding how the Chinese system works. Basically, the system is gradually moving from (1) a system in which the government owns all land and most businesses to (2) a system with considerable individual ownership.

Back in the days when the government owned most businesses and all land, farmers farmed the land to which they were assigned. Businesses often provided housing as part of an individual’s “pay package.” These homes typically had a shared outhouse for a bathroom facility. They may or may not have had electricity. There was relatively little debt to the system, because there was little individual ownership.

In recent years, especially after joining the World Trade Organization in 2001, there has been a shift to more businesses of the types operated in the West, and to more individual home ownership, with mortgages.

The economy acts rather differently than in the West. While the economy is centrally planned in Beijing, quite a bit of the details are left to individual local governments. Local heads of state make decisions that seem to be best based on the issues they are facing. These may or may not match up with what Beijing central planning intended.

Historically, Five-Year Plans have provided GDP growth targets to the various lower-level heads of state. The pay and promotions of these local leaders have depended on their ability to meet (or exceed) their GDP goals. These goals did not have any debt limits attached, so local leaders could choose to use as much debt as they wanted.

A major consideration of these local leaders was that they also had responsibility for jobs for people in their area. This responsibility further pushed them to aim high in the amount of development they sought.

Another related issue is that sales of formerly agricultural land for apartments and other development are a major source of revenue for local governments. Local leaders did not generally have enough tax revenue for programs, without supplementing their tax revenue with funds obtained from selling land for development. This further pushed local leaders to add development, whether it was really needed or not.

The very great power of local heads of state and their administrators made these leaders tempting targets for bribery. Entrepreneur had a chance of getting projects approved for development, with a bribe to the right person. There has been a recent drive to eliminate this practice.

We have often heard the comment, “A rising tide raises all boats.” When the West decided to discourage local industrialization because of CO2 concerns, it gave a huge push to China’s economy. Almost any project could be successful. In such an environment, local rating agencies could be very generous in their ratings of proposed new bond offerings, because practically any project would be likely to succeed.

Furthermore, without many private businesses, there was little history of past defaults. What little experience was available suggested the possibility of few future defaults. Wages had been rising very rapidly, making individual loans easy to repay. What could go wrong?

With the central government perceived to be in control, it seemed to make sense for one governmental organization to guarantee the loans of other governmental organizations. Businesses often guaranteed the loans of other businesses as well.

Why the Chinese System Errs in the Direction of Overdevelopment

In the model of development we are used to in the West, there are feedback loops if too much of anything is built–apartment buildings (sold as condominiums), coal mines, electricity generating capacity, solar panels, steel mills, or whatever else.

In China, these feedback loops don’t work nearly as well. Instead of the financial system automatically “damping out” the overcapacity, the state (or perhaps a corrupt public official) figures out some way around what seems to be a temporary problem. To understand how the situation is different, let’s look at three examples:

Apartments. China has had a well-publicized problem of  building way too many apartments. In about 2016, this problem seems to have been mostly fixed by local governments providing subsidies to migrant workers so that they can afford to buy homes. Of course, where the local governments get this money, and for how long they can afford to pay these stipends, are open questions. It is also not clear that this arrangement is leading to a much-reduced supply of new homes, because cities need both the revenue from land sales and the jobs resulting from building more units.

Figure 9 shows one view of the annual increase in Chinese house prices, despite the oversupply problem. If this graph is correct, prices have increased remarkably in 2017, suggesting some type of stimulus has been involved this year to keep the property bubble growing. The size of an apartment a typical worker can now afford is very small, so this endless price run-up must end somewhere.

Figure 9. Chinese house price graph from GlobalPropertyGuide.com.

Coal-Fired Power Plants. With all of the problems that China has with pollution, a person might expect that China would stop building coal-fired power plants. Instead, the solution of local governments has been to build additional power plants that are more efficient and less polluting. The result is significant overcapacity, in total.

May 2017 article says that because of this overcapacity problem, Beijing is forcing every coal-fired power plant to run at the same utilization rate, which is approximately 47.7 % of total capacity. A Bloomberg New Energy Finance article estimates that at year-end 2016, the “national power oversupply” was 35%, considering all types of generation together. (This is likely an overestimate; the authors did not consider the flexibility of generation.)

Beijing is aware of the overcapacity problem, and is cancelling or delaying a considerable share of coal-fired capacity that is in the pipeline. The plan is to limit total coal-fired capacity to 1,100 gigawatts in 2020. China’s current coal-fired generating capacity seems to be 943 gigawatts, suggesting that as much as a 16% increase could still be added by 2020, even with planned cutbacks.

It is not clear what happens to the loans associated with all of the capacity that has been cancelled or delayed. Do these loans default? If “normal” feedbacks of lower prices had been allowed to play out, it is doubtful that such a large amount of overcapacity would have been added.

If China’s overall growth rate slows to a level more similar to that of other economies, it will have a huge amount of generation that it doesn’t need. This adds a very large debt risk, it would seem.

Wind and Solar. If we believe Darien Ma, author of “The Answer, Comrade, Is Not Blowing in the Wind,” there is less to Beijing’s seeming enthusiasm for renewables than meets the eye.

According to Ma, China’s solar industry was built with the idea of having a product that could be exported. It was only in 2013 when Western countries launched trade suits and levied tariffs that China decided to use a substantial number of these devices itself, saving the country from the embarrassment of having many of these producers go bankrupt. How this came about is not entirely certain, but the administrator in charge of wind and solar additions was later fired for accepting bribes, and responsibility for such decisions moved higher up the chain of authority.

Figure 10. China current view of solar investment risk in China. Chart by Bloomberg New Energy Finance.

Ma also reports, “Officials say that they want ‘healthy, orderly development,’ which is basically code for reining in the excesses in a renewable sector that has become yet another emblem of irrational exuberance.”

According to Ma, the Chinese National Energy Administration has figured out that wind and solar are still about 1.5 and 2.5 times more expensive, respectively, than coal-fired power. This fact dampens their enthusiasm for the use of these types of generation. China plans to phase out subsidies for them by 2020, in light of this issue. Ma expects that there will still be some wind and solar in China’s energy mix, but that natural gas will be the real winner in the search for cleaner electricity production.

Viewed one way, we are looking at yet another way Chinese officials have avoided closing Chinese businesses because the marketplace did not seek their products. Thus, the usual cycle of bankruptcies, with loan defaults, has not taken place. This issue makes China’s total electricity generating capacity even more excessive, and reduces the profitability of the overall system.

Conclusion

We have shown how low wages and low energy prices seem to be connected. When prices are too low, some producers, including China, make a rational decision to cut back on production. This seems to be the true nature of the “Peak Coal” and “Peak Oil” problem. Because China is reacting in a rational way to lower prices, its production is falling. China is already the largest importer of oil and coal. If there is a shortfall elsewhere, China will be affected.

We have also given several examples of how the current system has been able to avoid defaults on loans. The issue is that these problems don’t really go away; they get hidden, and get bigger and bigger. At some point, all of the manipulations by government officials cannot hide the problem of way too many apartments, or of way too much electricity generating capacity, or of way too many factories of all kinds. The postponed debt collapse is likely to be much bigger than if market forces had been allowed to bring about earlier bankruptcies and facility closures.

Chinese officials are now talking about reining in the growth of debt. There is also discussion by heads of Central Banks about raising interest rates and selling QE securities (something which would also tend to raise interest rates). China will be very vulnerable to rising interest rates, because of stresses that have been allowed to build up in the system. For example, many mortgage holders will not be able to afford the new higher monthly payments if rates rise. If interest rates rise, factories will find it even harder to be profitable. Some may reduce staff levels, to try to reach profitability. If this is done, it will tend to push the system toward recession.

We likely now are in the lull before the storm. There are many things that could push China toward an energy or debt crisis. China is so big that the rest of the world is likely to also be affected.

via http://ift.tt/2zvBbW3 Tyler Durden

Deutsche Bank CEO Says AI Will Help Him Cut Tens Of Thousands Of Jobs

While many in the financial services industry are dreading the day that AI technology becomes advanced enough to render broad swaths of the human workforce obsolete, Deutsche Bank’s John Cryan ironically sees the technology as something that might help him save his job.

The leader of the biggest German lender has been tasked with putting the bank back on sound footing, regaining market share and – of course – reining in costs, including the bank’s bloated headcount. DB has 97,000 employees worldwide, about double the number of employees at many of its European peers.

And as the bank has made about half of the 9,000 cuts promised by Cryan in a five-year restructuring plan, the CEO told the Financial Times that machine learning and automation technology could help him cut tens of thousands of additional jobs, particularly in the bank’s back office.

Deutsche has made about 4,000 of the 9,000 job cuts promised under a five-year restructuring plan announced in late 2015. Mr Cryan said many of the additional cuts would come through using technology to boost efficiency in the bank’s processes.


“There we’ve got the most to gain,” he said. “We’re too manual, which can make you error-prone and it makes you inefficient. There’s a lot of machine learning and mechanisation that we can do."


Mr Cryan said the ratio of front office, revenue-generating staff, to back office people who keep the bank’s systems running, was “out of kilter” at Deutsche. 

When asked about the specific number of employees at risk of being replaced, he told Laura Noonan at the Financial Times it would be a "big number."

Cryan’s remarks come after the bank reported a tangible return on equity of just 4% for the third quarter, far short of its medium-term target of 10%. Of course, hitting that goal will be virtually impossible as long as the European Central Bank is embracing NIRP. As we noted yesterday, DB’s investment bank is looking to the risky leveraged loan market, where it can collect juicy fees from US corporates.

While the bank’s headcount has been reduced elsewhere, the Frankfurt-based lender added 24 managing directors and directors to its US corporate finance business this year.

As the FT points out, DB’s staff has taken umbrage in some of Cryan’s more critical remarks about the staff bloat at the bank. Back in September, Cryan said the bank’s accountants “sped a lot of time basically being abacuses”  and are ripe for being automated.

As the bank works to integrate its retail network with Postbank, its German retail banking subsidiary, Cryan said he closing retail branches and pushing more of its customers to do their banking online could help the bank cut costs.

Furthermore, Cryan believes entire industries will be able to replace workers with robots, not just Deutsche Bank. "We have to find new ways of employing people and maybe people need to find new ways of spending their time," he said, according to CNBC. "The truthful answer is we won't need as many people."

Cryan’s views on AI are diametrically opposed to Elon Musk’s warnings that AI is the “single biggest threat to humanity” and that governments should immediately move to regulate the technology.

However, some experts say that any meaningful advancements in AI that would render a significant portion of the US labor force obsolete are still far in the future, and that the technology has been incredibly overhyped. According to Gartner Inc.’s hype cycle for new technologies, the hype surrounding machine learning is at the “peak of inflated expectations” and heading to the “trough of disillusionment"…


via http://ift.tt/2iIW6ej Tyler Durden

How Central Banks Widen Wealth And Income Gaps

Authored by Hal Snarr via The Mises Institute,

The Federal Reserve’s latest Survey of Consumer Finances, according to Federal Reserve Governor Brainard, shows that the share of income held by the top 1 percent of households has risen from 17 percent in 1988 to 24 percent in 2015, and that the wealth held by that same group rose from 30 percent in 1989 to 39 percent in 2016.

There are many explanations of why the gap between the rich and the poor widens. Governor Brainard attributes some of it to labor market disparities relating to geography and to race and ethnicity. She and Robert Frank say it results from the wealthiest households being much more likely to invest additional money received than those in other income groups. Vincent Del Giudice and Wei Lu blame automation and robotics. John Tamny says it is a consequence of the explosion in entrepreneurship that has benefited us all. A Tax Policy Center report concludes that it will widen even more if the president’s income tax overhaul is enacted.

The Brookings Institute held a conference to explore whether monetary policy widens the wealth gap.

Mainstream economists support expansionary monetary policy because the income gap closes after mortgage payments are lowered when homes are refinanced at lower interest rates.

However, a conference panelist and former Federal Reserve (Fed) board member Kevin Warsh referred to the Fed’s monetary policy during the financial crisis as being “reverse Robin Hood.”

This view has merit because the Fed’s purchases of securities push interest rates down and expand the money supply. The expansion of money then inflates the prices of financial assets, which are disproportionately owned by the rich.

In a previous article for Mises Wire, I discussed data that seems to support both sides of the Brookings debate. In it, I conducted a thought experiment using aggregated data from Edward Wolff’s recent NBER paper and total household debt from the Federal Reserve Bank of New York. The experiment uses these data to calculate windfalls (or reductions in interest payments) that accrue to households when central banks lower interest rates. It assumes the interest rate that would have prevailed in the absence of central banking starts at 5 percent. To meet its annual inflation target of 2 percent, the Fed expands the money supply through time. This has lowered the interest rate on reserves to around 1 percent. The experiment assumes this is the interest that prevails in the presence of the Fed.

In aggregate, the experiment suggests that a reduction in interest rates from 5 percent to 1 percent benefited the bottom 90 percent. That group received the larger aggregated windfall from the Fed’s too-low interest rates. The total interest that this group paid declined by $332 billion. For the richest 1 percent, the total interest they paid declined by only $24 billion.

The above result supports the mainstream view that expansionary monetary policy disproportionally benefits the Americans populating the bottom 90 percent. Aggregation, however, is the fatal conceit of this view.

As I pointed out, 98.9 percent more people are in the bottom 90 percent than in the top 1 percent. When the aggregate windfalls are disaggregated to the household level, the annual windfall for the richest 1 percent was $20,852, but only $3,154 for the bottom 90 percent.

So, in any given year, setting too-low interest rates widens the income gap between rich and poor.

Over a long period of time, investment compounding of these windfalls widens the wealth gap. This results from the richest households being much more likely to invest windfalls than people in the lower income group, who mostly live paycheck to paycheck. Investing annual windfalls of $20,852 at 5.91 percent increases the wealth of those in the top 1 percent by $273,687 in 10 years or $1,622,639 in 30 years. This is not the case for those in the bottom 90 percent. If they spend most of their annual windfalls on consumer goods and invest the rest, say $1000, at 3.27 percent, their wealth increases by $11,607.45 in 10 years or $49,711.94 in 30 years.

Although the Federal Reserve was created to provide the US with a flexible and stable monetary and financial system, it has not.

Its policies have caused economic booms and busts, reduced the value of the dollar to about a penny in just over 100 years, and may be causing substantial income and wealth inequality.

via http://ift.tt/2zKcgyT Tyler Durden

Perpetual Notes – China’s New Way To Hide Debt (Call It Equity)

The legacy of the soon-to-retire PBoC governor, Zhou Xiochuan, will be that in sharp contrast to his western brethren, he warned that China’s credit bubble would burst before the fact. Two weeks ago, Zhou warned during the Party Congress that China’s financial system could be heading for a “Minsky moment” due to high levels of corporate debt and rapidly rising household debt (see here).

“If we are too optimistic when things go smoothly, tensions build up, which could lead to a sharp correction, what we call a ‘Minsky moment’. That’s what we should particularly defend against.”

Perhaps sensing that nobody in the Middle Kingdom was paying attention, we noted two days ago his lengthy essay published on the PBoC website. It contained another warning that latent risks are accumulating in the Chinese system, including some that are “hidden, complex, contagious and hazardous.” He also highlighted “debt finance disguised as equity” as a concern. Talking of which, there’s a new growth market in the gargantuan Chinese corporate debt market – we are referring to perpetual notes. Are you ready for the clever part about perpetual notes – they are debt but it’s permissible under Chinese accounting regulations to classify them as “equity” – et voila, corporate gearing has fallen. According to Bloomberg.

Under pressure to trim borrowings, China’s companies have found a way to reduce their lofty debt burdens — even if some of the risk remains. Sales of perpetual notes – long-dated securities that can be listed as equity rather than debt on balance sheets given that in theory they could never mature — have soared to a record this year as Beijing zeros in on leverage and the threat it poses to the financial system. The bonds are so popular that issuance by non-bank firms has jumped to the equivalent of 433 billion yuan ($65 billion), more than seven times sales by companies in the U.S.


“Chinese issuers love perpetual bonds because they are under great pressure to deleverage,” said Wang Ying, a senior director at Fitch Ratings in Shanghai. “Sophisticated investors should do their homework and shouldn’t be misled by the numbers in accounting books.

Unsurprisingly the state-owned companies have been gorging themselves on perpetuals, accounting for more than 60% of issuance. In the state-owned sector, perpetuals are the perfect source of financing for companies that are unlisted and need to raise financing without damaging their pro-forma gearing level. As Bloomberg notes.

While many state-owned or connected companies are trying to deleverage, actually reducing debt can be tough, says Ivan Chung, head of Greater China credit research at Moody’s Investors Service in Hong Kong. A lot of firms aren’t listed so can’t raise cash by issuing shares.


“By selling perpetual bonds under Chinese account treatment they can present lower debt ratios to SASAC,” Chung said, referring to the State-Owned Assets Supervision and Administration Commission of the State Council.


SASAC generally uses the ratio of total liabilities to total assets to measure the leverage of China’s state-owned enterprises against their performance, according to Christopher Lee, managing director of corporate ratings at S&P Global Ratings. That means perpetuals wouldn’t appear as part of the tally.

Don’t mention the war perpetuals. Bloomberg’s efforts to engage regulators and corporates in a discussion of perpetuals was spectacularly unsuccessful. To wit.

Two calls to SASAC weren’t answered and the body didn’t respond to faxed questions about why perpetual sales were increasing and whether the practice helped SOEs to conceal their true leverage burdens. State firm China Datang Corp. has sold 15 billion yuan of the securities this year, making it the country’s top non-financial issuer. The company also didn’t respond to emailed questions on the sales. Local issuance of perpetual notes only started in 2013, while offshore dollar-denominated perpetuals from China dates back to 2010. The finance ministry didn’t issue the regulation saying accountants can classify the securities as equity until 2014.

Besides facilitating more debt equity to be piled on to China’s debt mountain, there are two further downsides to the rapid growth in perpetuals issuance:

  • Perpetuals are more expensive than plain vanilla debt during the five years following issuance. Bloomberg estimates the average coupon on perpetual notes is 5.83%, about 20 basis points higher than a 5-year note; and
  • The coupon on perpetuals typically rises after 5 years, often by 100-200 basis points or more. Consequently, Chinese corporates need to be in a position to refinance them within that period.

With respect to the latter, Bloomberg notes…

Rating firms sometimes classify perpetuals as debt when assessing Chinese companies’ creditworthiness. Fitch does this if the call date on the note is within five years of issuance and the coupon step-up is 100 basis points or more. S&P does the same if the jump in the coupon is at least 200 basis points. But because of the way they work, perpetuals can pose particular problems for firms facing financial difficulties, said Tan Chang, an analyst at China Chengxin International Credit Rating Co.’s research institute in Beijing.


“If a company faces capital shortages on the call date and can’t redeem the bonds, they must accept a surge in future interest payments,” she said. That “may worsen the company’s financials and increase credit risks.”

…which is reminiscent of adjustable rate mortgages.

We have to credit (intended) China’s corporate sector with “pushing the envelope” in terms of finding ways to extend its debt binge. Last week we highlighted the debt-laden and corruption-tainted conglomerate, HNA, which issued dollar bonds with less than a year to maturity in order to circumvent restrictions on outbound investment. The only problem was the coupon of 9%. PBoC Governor, Zhou, must be coming to the realisation that nobody is going to listen to him and he might as well trudge off into the sunset and leave China Inc. to its fate. Nobody likes a smart ass anyway.

via http://ift.tt/2zv7u7s Tyler Durden

“This Is Crazy” – Antarctic Supervolcano Is Melting The Ice-Caps From Within

As we’ve pointed out, the supervolcano phenomenon is hardly unique to Yellowstone National Park, where a long dormant volcano with the potential to cause a devastating eruption has been rumbling since mid-summer, making some scientists uneasy.

Surprisingly active supervolcanos have been documented in Italy, North Korea and, now, Antarctica after scientists at NASA’s Jet Propulsion Laboratory (JPL) have found new evidence to support a theory that the breakup of Antarctic ice may be caused in part by a massive geothermal heat source, with output close to the scale of Yellowstone National Park.

Of course, if accurate, this theory would help rebut the notion that man-made climate change is in part responsible for the melting ice, Russia Today reports.

A geothermal heat source called a mantle plume, a hot stream of subterranean molten rock that rises through the Earth's crust, may explain the breathing effect visible on Antarctica's Marie Byrd Land and elsewhere along the massive ice sheet.

While the mantle plume is not a new discovery, the recent research indicates it may explain why the ice sheet collapsed in a previous era of rapid climate change 11,000 years ago, and why the sheet is breaking up so quickly now.

"I thought it was crazy. I didn't see how we could have that amount of heat and still have ice on top of it," said Hélène Seroussi of NASA's Jet Propulsion Laboratory in Pasadena, California.

Seroussi and Erik Ivins of JPL used the Ice Sheet System Model (ISSM), a mathematical depiction of the physics of ice sheets developed by scientists at JPL and the University of California, Irvine. Seroussi then tweaked the ISSM to hunt for natural heat sources as well as meltwater deposits.

This warm water lubricates the ice sheet from below, allowing glaciers to slide off into the sea. Studying meltwater in western Antarctica may allow scientists to estimate how much ice will be lost in future.

During their initial work, Seroussi and Ivins created simulations using higher heat flows than 150 milliwatts per square meter, which did not align with their space-based readings, except for one area: The Ross Sea.


Their calculations showed that, in certain sections of the sea, a heat flow of at least 150-180 milliwatts was required to create sufficient meltwater flows that matched with observations. They now believe the mantle plume is responsible for these higher-than-average readings.

The Marie Byrd Land mantle plume formed 50 to 110 million years ago, predating the Western Antarctic ice sheet. The mantle plume theory was initially proposed 30 years ago, but it’s not the only theory. Another posits that the sheer weight of the ice sheets causes melting deep below the surface.
 

via http://ift.tt/2jdty0p Tyler Durden

Joe Biden Admits His Biggest Regret

Amid Donna Brazile's revelations that she wanted to replace Hillary with Joe Biden due to health concerns, this morning's comments from the former vice-president are intriguing to say the least.

Just over two years ago, then-Vice President Joe Biden announced that he would not run to succeed President Barack Obama in the 2016 presidential election.

But as ABC News reports, this week, he admitted he regrets that he doesn't currently occupy the Oval Office given the potential he sees in the United States.

"I regret that I am not president because I think there is so much opportunity," Biden told Oprah Winfrey in a clip from an OWN Network interview aired exclusively by "Good Morning America" on Thursday.


"I think America is so incredibly well-positioned."

In a tug-at-your-heartstrings interview with Oprah, Biden – who has yet to rule out a run in 2020 – explained his biggest regret… then that he didn't really regret it…

Though Biden did not directly refer to Trump in the clips aired by "GMA," he described to Winfrey the characteristics he believes make for a successful leader.

"They understand their strengths and they understand their weaknesses. They play to their strengths and try to shore up their weaknesses," he explained.


"And the people who don't do that are the people who aren't self aware enough to know … because most of the time that abuse ends up in their downfall as well."

Biden-Oprah ticket in 2020?

via http://ift.tt/2hiYN62 Tyler Durden