Warning Flashes As Corporate Execs Dump Most Stocks Since 2015 Tyler Durden
Fri, 09/04/2020 – 09:57
The S&P500 hit an all-time high price earlier this week, with a forward P/E multiple surpassing the dot com peak of 27x, printing at 27.02x. These mind-numbing valuations (before Thursday’s panic sell) have been met with intense insider selling as corporate executives dump billions of dollars worth of their stock into unsuspecting Robinhood traders.
Data compiled for the Financial Times by Smart Insider shows insider selling by 1,042 chief executives, chief financial officers and company directors in Aug. was the highest dollar amount since Nov. 2015. The total number of execs disposing of their stock as valuations, in some cases, surged beyond dot com levels, was the highest since Aug. 2018.
The insider selling frenzy has been happening as only a handful of technology stocks push overall main equity indexes to record or near-record forward P/Es. The optics of insiders selling in force is not a good one, indicating these business elites don’t believe in today’s rich valuations as the economic recovery stalls.
“Chief executives have been much more downbeat in their outlooks than investors,” said Max Gokhman, head of the asset allocation for Pacific Life Fund Advisors.
“If you think that your future is dim, but your stock is soaring, then it makes sense to sell,” Gokhman said.
For some historical context, after insiders dumped billions of dollars worth of stock in Nov. 2015, the S&P500 tumbled nearly 14% over 65 days into a low in late Jan.-Feb. 2016.
FT outlines the most significant insider selling transactions in Aug.:
Steven Rales and his brother Mitchell, founders of US industrial conglomerate Danaher, were the biggest sellers in August, offloading nearly $1bn worth of stock in technology specialist Fortive Group, which was spun out of Danaher in 2016.
Steven Rales pocketed $606m while Mitchell took home $363m. Fortive’s stock is up about three-quarters since the March trough. The company did not respond to a request for comment.
Leslie Wexner, the founder of L Brands, which owns Victoria’s Secret, sold $89m of the company’s stock — which has more than tripled since the rally began. Mr. Wexner has made headlines in recent years for hiring Jeffrey Epstein, the disgraced financier who died in prison last year, to manage his personal fortune. L Brands did not respond to a request for comment. -FT
In a separate report via StoneX, a brokerage, insider selling of Nasdaq 100 tech stocks over the second quarter hit $10.4 billion, up 171% over the same quarter in 2019.
“Insiders at Nasdaq 100 index companies are harvesting a once-in-a-millennium bonanza,” said Vincent Deluard, a macro strategist for StoneX.
Insiders are suggesting that current valuations aren’t just rich, but the latest rally in stocks this summer is not sustainable, rather it could be viewed as a blowoff top.
For more color, we recently penned a couple of pieces (see: here & here) that shows insiders have been dumping through the summer, meanwhile, Robinhood daytraders are panic buying every dip as they might just be transformed into bagholders.
via ZeroHedge News https://ift.tt/2R828a9 Tyler Durden
India On The Cusp Of Passing Brazil As World’s 2nd-Biggest COVID-19 Outbreak: Live Updates Tyler Durden
Fri, 09/04/2020 – 09:42
Summary:
India nears 4 million cases, on track to top Brazil
Berlusconi hospitalized with COVID
South Korea extends tight restrictions
Hungary reports single-day record as central European outbreak smolders
* * *
US coronavirus numbers continued to slow this week, even as rising numbers in Iowa, North Dakota, South Dakota and Alabama stoked concerns that the US pandemic is merely migrating once again. But as we head into the long holiday weekend in North America, the biggest story internationally is India, which is on the cusp of surpassing Brazil as the world’s largest outbreak.
Government officials in New Delhi have been pushing a mass testing drive to try and eradicate the virus from the hardest-hit areas, which include the densely populated slums of Delhi and Mumbai.
Once again, India reported 80k+ new infections in 24 hours on Friday, with 83,341 coronavirus infection, to be exact. The latest numbers put India’s total at 3.94 million, health ministry data showed on Friday, putting it within striking distance of 4 million, and surpassing Brazil, whose outbreak has finally begun to slow.
Asia’s worst-hit country is now just around 60,000 cases behind Brazil, which has around 4 million confirmed cases. The US, the worst-affected country, has more than 6 million cases.
India has recorded the largest daily tally in the world for the past month, as PM Narendra Modi continues to push ahead with reopening his economy after an economically devastating lockdown.
GDP data reported earlier this week revealed that India’s economy took a beating during the quarter ended in June, as the strict lockdown forced the people inside, and away from commerce.
While cases have soared, deaths in India from COVID-19 have remained relatively low, a sign of the aggressiveness of the government’s testing campaign. The ministry said on Friday that 1,096 people died from COVID-19 in the last 24 hours, taking India’s death toll to 68,472.
Former Italian PM Silvio Berlusconi has been admitted to a hospital in Milan after testing positive for COVID-19 earlier this week. The 83-year-old, who still leads the Forza Italia party, had been isolating at his home near Milan. A spokesman insisted his hospitalization was “a precautionary measure.”
As an outbreak in central Europe continues to smolder, Hungary reported a daily record of 459 coronavirus infections Friday, with new cases mostly affecting young people. Active cases climbed to 2,817, while the number of deaths rose by one to 621.
In South Korea, authorities are extending a set of strict social distancing measures in the Seoul area by a week to Sept. 13, Health Minister Park Neung-hoo said. The country will also extend nationwide level 2 social distancing steps by two weeks, and delay the start of in-person education until Sept. 20, vs Sept. 11.
Earlier Friday, Prime Minister Chung Sye-kyun warned that rushing to ditch the precautions could open the door to another flareup.
via ZeroHedge News https://ift.tt/354uEBu Tyler Durden
“Great Jobs Numbers!” Trump Booms As US Unemployment Rate Unexpectedly Tumbles To 8.4% Tyler Durden
Fri, 09/04/2020 – 09:35
Amid a wide range of sellside estimates, and a whisper number that was either too high or too low depending on whom you asked, moments ago the BLS reported that in August, the number of payrolls was almost unexpectedly in line with consensus expectations: according to the August jobs report, some 1.371MM payrolls were created, essentially on top of the 1.35MM expected.
But if the Establishment survey was strong, the Household Survey was a blockbuster print, where a whopping 3.8 million newly employed workers were uncovered, as the total rose from 143.5 million to 147.3 million.
This was clearly a better than expected report, where some had expected a substantial slowdown in August due to a spike in virus cases across Sunbelt states, and U.S. labor-market rebound unambiguously extended for a fourth month in August, giving hope that the economy can continue to recover – and that Trump can parade with a strong labor market in the next two months – despite Washington’s standoff over further government aid to jobless Americans and small businesses.
That said, a quarter of all job gains were thanks to government jobs (Census hiring), so we are confident that one can find issues with the report.
The change in total nonfarm payroll employment for June was revised down by 10,000, from +4,791,000 to +4,781,000, and the change for July was revised down by 29,000, from +1,763,000 to +1,734,000. With these revisions, employment in June and July combined was 39,000 less than previously reported.
The one series tracked by all, the number of “temporarily” unemployed surprised as it dropped by more than 3 million to just 6.2 million, from 9.2 million the month before. As usual, debate over what defines “temporary” unemployment remains in the foreground.
This was offset by the number of people in the U.S. seeing permanent job losses, which rose by about half a million to 3.4 million, the highest level since 2013. “It points to the ongoing business closures, bankruptcies, and investment cuts across the country.” as BBG’s Katia Dimitrieva said.
Meanwhile, the percentage of the labor force unemployed for more than 15 weeks: this jumped to 5.1%, the highest since the financial crisis.
The average hourly earnings also printed generally in line, rising by 4.7% in August, unchanged from the previous month, and above the 4.5% expected.
According to the BLS, average hourly earnings for all employees rose by 11 cents to $29.47. Average hourly earnings of private-sector production and nonsupervisory employees increased by 18 cents to $24.81, following a decrease of 10 cents in the prior month. As the BLS notes, the large employment fluctuations over the past several months–especially in industries with lower-paid workers–complicate the analysis of recent trends in average hourly earnings.
Also worth noting is that the average workweek for all employees on private nonfarm payrolls increased by 0.1 hour to 34.6 hours in August. In manufacturing, the workweek rose by 0.3 hour to 40.0 hours, and overtime increased by 0.1 hour to 3.0 hours. The average workweek for production and nonsupervisory employees on private nonfarm payrolls was unchanged at 34.0 hours.
The labor force participation rate rose modestly, from 61.4 to 61.7, as the Civilian Labor Force rose by 1 million to 160.8 million in August while the population rose by just 200K to 260.558MM.
Where there was a surprise was in the unemployment rate, which unexpectedly tumbled from 10.2% in July to 8.4%, smashing expectations of a 9.8% print. It looks like Trump wants to go into the November elections with a 7% or lower unemployment rate.
Despite all the superlatives, let’s not forget that In August, nonfarm employment was below its February level by 11.5 million, or 7.6 percent. Looking at the sector breakdown, government employment rose in August, as expected, reflecting temporary hiring for the 2020 Census. Notable job gains also occurred in retail trade, in professional and business services, in leisure and hospitality, and in education and health services.
Some more details:
Employment in government increased by 344,000 in August, accounting for one-fourth of the over- the-month gain in total nonfarm employment. A job gain in federal government (+251,000) reflected the hiring of 238,000 temporary 2020 Census workers. Local government employment rose by 95,000 over the month. Overall, government employment is 831,000 below its February level.
Retail trade added 249,000 jobs in August, with almost half the growth occurring in general merchandise stores (+116,000). Notable gains also occurred in motor vehicle and parts dealers (+22,000), electronics and appliance stores (+21,000), and miscellaneous store retailers (+17,000). Employment in retail trade is 655,000 lower than in February.
Employment in professional and business services increased by 197,000. More than half of the gain occurred in temporary help services (+107,000). Architectural and engineering services (+14,000), business support services (+13,000), and computer systems design and related services (+13,000) also added jobs over the month. Employment in professional and business services is 1.5 million below its February level.
Employment in leisure and hospitality increased by 174,000 in August, with about three-fourths of the gain occurring in food services and drinking places (+134,000). Despite job gains totaling 3.6 million over the last 4 months, employment in food services and drinking places is down by 2.5 million since February.
Employment in education and health services increased by 147,000 but is 1.5 million below February’s level. Health care employment increased by 75,000 over the month, with gains in offices of physicians (+27,000), offices of dentists (+22,000), hospitals (+14,000), and home health care services (+12,000). Elsewhere in health care, job losses continued in nursing and residential care facilities (-14,000). Employment in private education rose by 57,000 over the month.
Employment in transportation and warehousing rose by 78,000 in August, with gains in warehousing and storage (+34,000), transit and ground passenger transportation (+11,000), and truck transportation (+10,000). Employment in transportation and warehousing is down by 381,000 since February.
The other services industry added 74,000 jobs in August, reflecting gains in membership associations and organizations (+31,000), repair and maintenance (+29,000), and personal and laundry services (+14,000). Employment in other services is 531,000 lower than in February.
Financial activities added 36,000 jobs in August, with most of the growth in real estate and rental and leasing (+23,000). Employment in financial activities is down by 191,000 since February.
Manufacturing employment rose by 29,000, with gains concentrated in the nondurable goods component (+27,000). Despite gains in recent months, employment in manufacturing is 720,000 below February’s level.
Employment in wholesale trade increased by 14,000 in August, reflecting an increase of 9,000 in the nondurable goods component. Wholesale trade employment has declined by 328,000 since February.
Employment was changed little in mining, construction, and information.
The August payrolls report also provided some curious supplementary data, as follows:
In August, 24.3 percent of employed persons teleworked because of the coronavirus pandemic, down
from 26.4 percent in July.
In August, 24.2 million persons reported that they had been unable to work because their employer closed or lost business due to the pandemic–that is, they did not work at all or worked fewer hours at some point in the last 4 weeks due to the pandemic. This measure is down from 31.3 million in July. Among those who reported in August that they were unable to work because of pandemic-related closures or lost business, 11.6 percent received at least some pay from their employer for the hours not worked.
About 5.2 million persons not in the labor force in August were prevented from looking for work due to the pandemic. This is down from 6.5 million in July. (To be counted as unemployed, by definition, individuals must either be actively looking for work or on temporary layoff.)
The bottom line, as Tony Bedikian, head of global markets at Citizens Bank, summarized: “We are still moving in the right direction and the pace of the jobs recovery seems to have picked up, but it still looks like it will take a while and likely a vaccine before we get back close to where we were at the beginning of this year. We continue to be optimistic that the economy has turned a corner and that we’ll continue to see steady progress.”
The report was certainly enough for Trump to declare that it was a “Great Jobs Numbers!” one which “broke the 10% level faster and deeper than thought possible.”
Great Jobs Numbers! 1.37 Million Jobs Added In August. Unemployment Rate Falls To 8.4% (Wow, much better than expected!). Broke the 10% level faster and deeper than thought possible.
Even so, employment remains 11.5 million below pre-pandemic levels and the level of long-term and permanent unemployment is rising. Much hinges on fiscal stimulus for states and companies from the government in months ahead.
In terms of market impact, Bloomberg speculates that “the lower unemployment rate is likely to force Fed officials to rethink their most pessimistic forecasts for employment and other economic projections.”
via ZeroHedge News https://ift.tt/3bvqx2K Tyler Durden
Has there ever been a time in your life when you haven’t had enough food to make it through the week? If you have never experienced this, you are extremely fortunate. Even during the best of times, millions of Americans struggle with hunger, and these definitely are not the best of times. Because of all the crazy things that have happened so far in 2020, large numbers of people have been forced into dramatic lifestyle changes. Many Americans have deeply cut their food budgets due to a lack of income, others are now only eating one or two meals a day, and we are seeing more demand at food banks around the country than we ever have before.
It is quite obvious that massive numbers of people are really hurting, and Bloomberg is reporting that it is being projected that the number of Americans that are “fighting hunger” will rise to “more than 50 million” by the end of this calendar year…
The ranks of Americans fighting hunger are projected to swell some 45% this year to more than 50 million.
To me, that is an absolutely staggering figure.
Right now, the U.S. has a total population of about 328 million people, and so that figure that Bloomberg quoted represents a sizable chunk of the country.
And we certainly don’t have to wait until the end of the year for the numbers to get really, really bad. In fact, it is being reported that one recent survey found that approximately one-tenth of all U.S. households “haven’t had enough food in a given week”…
During the pandemic, about a 10th of American households reported they haven’t had enough food in a given week. That’s a shocking figure for the world’s richest country. It’s more than double pre-Covid figures and the highest since comparable government data starts in 1995.
I feel especially bad for the children that are going hungry.
Can you imagine how bad parents must feel when their children tell them that they are hungry and the parents have nothing to provide?
And this is just the beginning. Food prices are going to continue skyrocketing over the coming year, and that is just going to stretch family budgets even more.
A few days ago, I strongly urged my readers to stockpile food for the chaotic times that are ahead. Food prices are only going to go higher, and economic conditions are going to continue to deteriorate.
In fact, some more major job cuts were just announced. For example, Ford just announced that it will be eliminating “1,400 white collar jobs”…
Ford is looking to cut 1,400 white collar jobs in a cost-savings move.
The automaker sent out letters to employees Wednesday saying that salaried staff eligible for retirement would be getting early retirement offers next week. Those who take the offer by October 23 would be leaving the company by the end of the year.
With no air travel rebound or new federal help in sight, United Airlines says it will furlough about 20% of its frontline employees in less than a month’s time.
In a new memo to its employees, United (UAL) says that 16,370 employees will be furloughed when payroll restrictions attached to a federal bailout expire October 1.
Because most Americans live paycheck to paycheck, a job loss can plunge a family into dire straits very rapidly. All over the U.S., we are seeing long lines of people driving very nice vehicles waiting for up to six hours to get food at local food banks.
Over the past 23 weeks, more than 58 million Americans have filed initial claims for unemployment benefits, and many of them have “suddenly” found themselves in need of food. For a lot of them, it is the first time something like this has ever happened to them.
And so many people that I talk to believe that what we have experienced so far is just the tip of the iceberg and that much worse is coming. There is such a sense of urgency in the air, and gun sales just keep setting record after record. In fact, we just learned that gun sales during the month of August were 57 percent higher than last year…
The Washington Free Beacon reported Tuesday that the U.S. saw more gun sales in August 2020 than any other August since the FBI has been logging data on the subject. According to the outlet’s analysis of FBI background check data, there were at least 1.6 million firearm purchases during the past month, a 57% increase compared to August of last year.
Other Americans are responding to our current circumstances by wallowing in depression and despair. According to the Daily Mail, the number of Americans reporting symptoms of depression has “tripled over the last eight months”…
Researchers found that the percentage of US adults reporting mild, moderate or severe symptoms tripled over the last eight months.
And as things get even worse, a ton of people out there simply are not going to be able to handle what is happening.
That is why I really wanted my new book to be a book of hope. Yes, we are entering a chapter of history that is going to be far more horrible than most people would dare to imagine. But I believe that there is hope in understanding what is happening, there is hope in getting prepared, and there is hope in trusting that God has everything in His hands.
So many people out there still have so much faith in the system, but when things really get crazy the government is not going to be delivering big baskets of food to your door for you and your family.
Tonight, millions upon millions of American families do not have enough food to eat, and more jobs are being lost with each passing day.
You might think that your job is safe, and hopefully that is true, but millions of others also thought their jobs were secure right before they were let go.
Recently, I have had a lot of people ask me about gold and silver, and I have always thought very highly of precious metals.
But you can’t eat gold or silver. Before you ever focus on precious metals, make sure that you have enough food stored up for yourself, your family, your friends and your neighbors, because having enough food is going to be absolutely critical during the times that we are moving into.
via ZeroHedge News https://ift.tt/2Fa3VZa Tyler Durden
Crippled Supertanker Off Sri Lanka Could ‘Explode Due To Fire’ Tyler Durden
Fri, 09/04/2020 – 09:05
New Diamond, a very large crude carrier (VLCC) measuring 333 meters, is engulfed in flames about 20 nautical miles off the east coast of Sri Lanka, Refinitiv data showed.
The supertanker is fully loaded with about 2 million barrels of oil.
The Sri Lanka Air Force took pictures and videos showing the extent of the damage.
The Sri Lankan Navy is assisting the crippled supertanker.
Fire spreads to the vessel’s bridge.
Video shows Sri Lanka Air Force dropping water on the fire via a helicopter water bucket.
🔥 Un incendie fait rage depuis hier à bord du pétrolier New Diamond situé au large de la côte sud-est du Sri Lanka après une explosion dans la salle des machines. Un marin philippin est décédé et les 22 autres membres d’équipage ont été secourus pic.twitter.com/NmJY94olja
Reuters quoted Commander Ranjith Rajapaksa, who said the military sent aircraft and several ships to help contain the fire. He said one of the vessel’s crew members perished when an explosion was seen in the engine room.
“The fire is still raging there,” Sri Lankan Navy spokesperson Indika Silva said Friday, adding the fire has yet to spread into the oil storage part of the ship.
The tanker is powerless, drifting off the Sri Lankan coast at a speed of 0.7 nautical miles per hour and could arrive onshore by Sunday, Terney Pradeep, general manager of the Sri Lanka Marine Environment Protection Authority, said on local television.
“If an oil spill happens after it reaches near the coast, there could be massive damage on the beach.
“The damage could rise further if the ship explodes due to the fire. If that happens, there could be huge damage,” Terney warned.
A statement by the vessel’s insurer, West of England, seen by Bloomberg, said: “We can confirm that these two vessels are entered in the West of England. The Club is liaising closely with our members and the relevant authorities, and it would be inappropriate to comment further at this time.”
Readers may recall the second vessel referred to is Gulf Livestock 1, a specialized cargo ship measuring 139 meters, currently capsized off the coast of Okinawa, a Japanese island in the East China Sea between Taiwan and Mainland Japan.
via ZeroHedge News https://ift.tt/331fyu5 Tyler Durden
In a coordinated development which signals more than meets the eye, the Bank of England and London Bullion Market Association (LBMA) have together moved to begin reporting gold and silver vault holdings data on a 1 month lagged basis instead of the 3 month lagged basis under which they had been previously reporting vault stocks since 2017.
London Vault Reporting – As Clear as Mud
In addition to the Bank of England’s gold vaults in London, LBMA vault reporting applies to commercial precious metals vaults in London operated by the LBMA bullion banks HSBC, JP Morgan and ICBC Standard Bank, and vaults operated by the LBMA security providers Brinks, Malca-Amit, Loomis and G4S.
Under these new vault reporting changes, it for example now means that as of the end of August, the Bank of England and LBMA have reported claimed gold bar holdings in the London vaults for month-end July (a 1-month lag) instead of for month-end May (a 3-month lag).
The LBMA has also made the same reporting change (from a 3-month to a 1-month lag) for Good Delivery silver bar inventories claimed to be in the LBMA London vaults. Note that while the Bank of England London vaults hold gold bars in custody storage for central bank and bullion bank clients, the Bank of England does not store silver, so the silver data reported by the LBMA applies to just the other seven vault operators listed above.
Putting aside for a moment as to why gold and silver vault stocks in London are not already reported at the end of each and every business day as happens in the COMEX precious metals vaults in New York, this London vault reporting change is suspicious in that the reason stated from both the LBMA and Bank of England is that its an altruistic move to improve gold market transparency. Furthermore, both parties claim that they are following a recommendation (for improved transparency) set out in the UK regulators’ Fair and Effective Market Review (FEMR).
The trouble with this claim is that the FEMR’s final report (of which the Bank of England was one of the authors) was published over 5 years ago in June 2015, so the explanation now being pitched by the LBMA and Bank of England is both hard to fathom as difficult to swallow. That card had already been played by the LBMA in 2017 so the real motive is something else.
Convincing the world that the London gold and silver vault inventories are healthy may be part of the strategy, but not in the way you might think. The real agenda in my opinion is to prepare the London vaults for COMEX gold and silver contract delivery by giving a more recent glimpse into vault stocks but without giving COMEX like visibility. How could a one month lag meet COMEX vault approval requirements you might ask? By bending the rules would be the answer. Whether this plays out the way I think it will, we will have to wait and see.
Gold in the Vaults but already Owned
The London gold stocks as of July month-end now total a claimed 8,790 tonnes. Of this total, 5,342 tonnes is claimed to be stored at the Bank of England, meaning that 3,448 tonnes are claimed to be stored in the LBMA London commercial vaults. Subtracting the 2,588 tonnes of ETF gold held in the LBMA London commercial vaults at the end of July, this leaves just 861 tonnes of gold not at the Bank of England and not in ETFs. This 861 tonnes represents gold held by other allocated holders such as institutions, sovereign wealth funds, family offices and ultra high net worth individuals. The bullion banks gold and silver floats then have to compete with these entities to get their fill as well as by raiding GLD and by borrowing gold from central bank clients at the Bank of England.
Total gold stocks CLAIMED to be held in the London vaults as of the July month-end, Bank of England, LBMA vaults, and ETFs. Source: www.GoldChartsRUs.com
“The Bank of England will now publish gold holding data with a one-month lag. The reduction from a three-month lag will increase transparency around gold holdings, in line with the Fair and Effective Market Review’s goal to increase transparency in the gold market.”
“In a move towards greater transparency, LBMA, the Bank of England and the commercial vaults announced earlier today that they will now publish the gold and silver holdings of the vaults in London with just a one month lag (instead of the earlier three-month delay)”
Logically, the LBMA can’t shift its reporting lag from 3 months to 1 month without the Bank following suit and vice-versa, as the two entities and their vault reporting are embedded into each other. So when one moves the other has to also.
Bizarrely, in a second press release on the same day, this one titled “Latest LBMA Data – Clearing and Vault data”, the LBMA self-referentially welcomes its own move, stating that “we welcome the announcement to reduce the time lag for publication of London vault holdings”. Since it was the LBMA itself which actually made both the announcement and the data publication change, you can see that corporate spin is alive and well in London.
As well as trying to justify the change based on the FEMR report which was published more than 5 years ago by three of the tentacles of the City of London financial octopus (Bank of England, HM Treasury and Financial Conduct Authority), this sudden ‘Road to Damascus’ impulse by the Bank of England and LBMA to ‘improve transparency’ around London precious metals vault inventories doesn’t cut the mustard because both parties said the exact same thing back in 2017 when first reporting London precious metals vault holdings.
Additionally, as one of the very authors of the FEMR report in 2015, its rich of the Bank of England, five years later, to now claim its reporting change is based on a recommendation it made to itself five years ago.
As a leading custodian of gold, with one of the largest vaults in the world, the Bank of England’s decision is highly significant. Not only will it enhance the transparency of the Bank’s own gold operations; it will also support the drive towards greater transparency across the gold market.
“These figures provide an important insight into London’s durability and reinforce the underlying strength of the physical OTC Market.”
“LBMA is therefore very pleased to be able to offer this information on a more timely basis”
At that time, the LBMA also quoted FEMR’s recommendation as follows:
“Transparency
According to the Fair and Effective Markets Review …in markets where OTC trading remains the preferred model, authorities and market participants should continue to explore the scope for improving transparency, in ways that also enhance effectiveness.”
Some questions for the Media
Fast forward to today, more than 3 years later, and its déjà vu all over again with the LBMA and Bank of England now going through the same motions, with the exact same language about transparency, and with the exact same claims. This throws up a number of interesting questions such as:
With the LBMA now trying to claim that the current move to reporting 1 month lagged vault data is in the interests of transparency, this begs the question as to what exactly was the 3 month lagged data, a mere partial demystifying of London’s gold and silver vault holdings?
Why does the LBMA now feel the need to again “reinforce the underlying strength of the physical OTC Market” by moving to a 1 month reporting lag? Could it be that the underlying strength of the physical OTC market is not so strong?
Why was this precious metals vault data not provided on a more timely basis over 3 years ago when the LBMA began vault reporting in 2017?
Why did the FEMR committee not pull up the LBMA and the Bank of England back in 2017 to direct them to report vault data on a 1 month basis instead of on a 3 month lag?
Why is this move now happening more than 3 years after the initial reporting, and more than 5 years after the FEMR’s final report was published in June 2015?
Why are the mainstream financial media not asking these simple questions to the Bank of England and the LBMA?
Why are the mainstream financial media not covering the recent move by COMEX to ‘mass approve’ for COMEX contract delivery, all LBMA gold and silver refiner bar brands, both on the current and former London Good Delivery Lists?
2,587 tonnes – Total gold held in gold backed Exchange Traded Funds (ETFs) in London as of month-end July 2020. Source: www.GoldChartsRUs.com
Fair and Effective Markets? Pull the other one
Nor is it wise for the LBMA and the Bank to have raised the word FEMR, for as in the old adage, they should have let sleeping dogs lie. When it was launched in June 2014, the remit of the Fair and Effective Markets Review (FEMR) was to investigate the Fixed Income, Currency and Commodities (FICC) markets in the wake of massive benchmark manipulation scandals that had taken place in LIBOR, in the London Gold Fix, and in Foreign Exchange indexes. Its final report (the FEMR report) published in June 2015 was a summary of these investigations as well as recommendations (recommended with a straight face) to improve market trading standards and to crack down on market abuse.
Hilariously, while one of the outcomes of the FEMR recommendations was the 2017 implementation of the LBMA Global Precious Metals Code, a Code of Conduct which all LBMA members had to sign and commit to, manipulation in the precious metals markets continued apace for years after the FEMR report was published, with LBMA heavy weights such as JP Morgan and Scotia being progressively involved in bigger and bigger gold and silver price manipulations since then. See Scotia misconduct here in 2020 and JP Morgan here in 2019.
The LBMA also had to contend with the embarrassment that one of the LBMA Board members, Michael Nowak of JP Morgan fame, was charged in 2019 by the US Department of Justice (DoJ)for engaging in a racketeering conspiracy under the “Racketeer Influenced and Corrupt Organizations Act, or RICO, as well as other federal crimes in connection with manipulating precious metals futures markets.“
A further outcome of the FEMR report was that the LBMA Gold Price auction (i.e. the re-disguised former London Gold Fix auction launched in March 2015 by the LBMA bullion banks) became a Regulated Benchmark under which manipulation is now a criminal offence. However, this too turns out to have been nothing more than a sham because for example, as recently as last week on 27 August 2020, as the COMEX gold price was being slammed, the afternoon LBMA Gold Price auction took 33 rounds to settle over 21 minutes, while the 12 direct participants (all LBMA members and mainly LBMA bullion banks) collectively first held the bid volume unchanged for 16 rounds, then after round 17 when the price had fallen by $28, then held the ask volume unchanged until round 33. More on that auction in due course.
In the auction, as COMEX price was being slammed, LBMA banks (which control the auction) held bid volume at 73,298 for 16 rounds even as price dropped from $1940.5 to $1912. Bid volume only changed in round 17. LBMA banks then held the ask volume at 108,511 for another 16 rounds. pic.twitter.com/9jFsJmKE2Y
Turning to the most recent vault data now available following the LBMA – Bank reporting change, there is also nothing obvious in the data that would explain a rationale for the Bank and LBMA making move at this time. Granted, the LBMA claims the London gold vault stocks are at an all time high.
However, with most of that gold held by long term holders and at least some of it claimed by multiple parties, a record gold vault stock in itself doesn’t mean much. Changing from a 3-month to a 1-month reporting window for a one hit wonder record claim would be like firing all your ammo for little or no effect. While the new data itself doesn’t justify the change, its worth highlighting all the same.
Before this week’s change, the LBMA and Bank of England would have, at the end of August, been reporting vault holdings as of May month end. With the move to a 1-month reporting lag, the LBMA and Bank of England have now reported three month end vault holdings totals at the same time, up until July month end. from next month they will just report one month’s data with a 1 month lag.
5,342 tonnes – Total gold CLAIMED to be held in the Bank of England vaults on behalf of central bank and commercial bank customers. July month-end 2020. Source: www.GoldChartsRUs.com
Note that the Bank of England reports its gold vault data separately, while the LBMA vault data figures include all the London vaults, both commercial vaults and the Bank of England vaults. As such the Bank of England data is a subset of the overall totals. Looking first at the Bank of England (BoE) gold vault data, the BoE vaults lost a net 59.9 tonnes in May, lost a net 29.4 tonnes in June, and lost another net 33.1 tonnes in July. In total over the three months from April month-end to July month-end the BoE vaults saw a net outflow of 122.4 tonnes of gold from 5464.4 tonnes at the end of April to 5342 tonnes of gold at the end of July.
Could this be central bank gold sales or withdrawals from the Bank of England vaults? Possibly. However, the more intriguing possibility is that these outflows are SPDR Gold Trust (GLD) gold bar holdings that had been allocated to the GLD over April to June using the Bank of England as gold sub-custodian, and that over May to July were being transferred out of the Bank of England vaults to the HSBC vault in London. This possibility was covered in the BullionStar article a few weeks ago titled “GLD continues to source gold at the Bank of England, at an escalating rate“.
The reason that this is possible is that using GLD SEC filings and GLD daily gold holdings changes, the SPDR Gold Trust could have transferred out up to 110 tonnes of gold over May and June. GLD was also was also still holding 40 tonnes of gold in the Bank of England at month end. The majority of this too could have been transferred out of the Bank of England vaults in July. For more details see the screenshot below.
Looking at the overall London vault data for gold (including the Bank of England vaults) the overall figure claims a net addition of 308 tonnes of gold between the end of April and the end of July, comprising a net 2.3 tonnes in May, a 184 tonnes net inflow in June, and a 121.7 tonnes net inflow in July.
Given the 122.4 tonnes outflows from the Bank of England vaults over that time, this means that the other vaults (excluding the BoE) together saw a net 430.4 tonnes increase over the May to July period, which comprised 62.2 tonnes in May, 213.3 tonnes in June, and 154.9 tonnes in July.
LBMA claims to have 34,011 tonnes of silver stored in London vaults, of which an estimated 20,761 tonnes is held in silver-backed ETFs. Source: www.GoldChartsRUs.com
Turning to silver, which is not held at the Bank of England vaults, the LBMA vaults claim that between the end of April and the end of July, the amount of silver held in the London commercial vaults fell from 35,667.8 tonnes to 34,011.9 tonnes, for a net outflow of 1,655.9 tonnes. The bulk of those net silver outflows were in June and July, with the vaults recording a net withdrawal of 915 tonnes of silver in June and 690 tonnes in July, with a residual 51 tonne net outflow in May. With 1600 tonnes of silver leaving the London vaults over June and July, that may be a story for Bloomberg to follow up on.
Bullion bankers review proposal on delivering COMEX gold using London vaults
Conclusion – A More Compelling Reason
On first principles, the LBMA and Bank of England want their vault holdings a) to appear more transparent and b) to create a perception that total metal stocks are deep, and healthy.
But the new claims about transparency and the FEMR report are risible. There is nothing transparent about the London gold and silver markets. Unlike the equity and bond markets, there is no reporting of transactions and trades in the OTC London gold and silver markets. There is no data whatsoever about positions and transactions in the London gold lending market, no data on which commercial banks hold gold accounts at the Bank of England, no data on the identities of central bank gold custody customers of the Bank of England, no data on the size of the enormous unallocated gold and silver liabilities of the bullion banks, no published data on the location of the London commercial vaults, and no published audits of the claimed gold and silver inventories in the LBMA and Bank of England vaults. And that’s just a flavour.
In short, the LBMA bullion banks and Bank of England couldn’t care less gold and silver market transparency. What they do care about though is projecting the illusion of transparency. No more so than when COMEX soon moves to allow gold and silver in the LBMA London vaults to be delivered against the COMEX GC 100 and SI 5000 gold and silver futures contracts.
Last week here I covered the recent move by the COMEX to mass approve all of the gold and silver refiner bar brands of the LBMA (both those on the current and on the former London Good Delivery lists for gold and silver), which is a prelude to facilitating London gold and silver inventories delivery against the COMEX flagship GC 100 oz gold and Si 5000 oz silver futures contarcts . See “LBMA-COMEX collusion intensifies as CME approves 267 LBMA gold and silver bar brands” for details.
As the CME rule wording for the GC 100 contract will probably be when its made: “The depository for gold deliverable against the Gold futures (GC) contract must qualify and be designated a weighmaster and must be located within a 150-mile radius of the City of New York or in London, UK.”
Anyone familiar with the approved COMEX vaults in New York and environs will knows that these vaults publish daily end of day inventory totals of the amount of gold and silver held in each of the vaults, e.g. the New York vaults of HSBC, JP Morgan and Brinks.
In early July when highlighting the recently launched COMEX (Enhanced Delivery) 400 oz contract (4GC), which was a trail balloon for London vault delivery, a Bloomberg article spelled out these requirements:
“Exchange rules require vaults to report daily inventory levels even when metal isn’t marked for delivery. “When London vault applications are submitted and approved, they will follow the same guidelines as those of all exchange-approved facilities for metals,” a CME spokesperson said.
…The same rules will apply to storage facilities in London, potentially bringing more transparency if vaults apply to hold inventory backing the contract.”
My contention however, is that it’s a bridge too far for the secretive and sensitive LBMA vaults in London (HSBC, JP Morgan, Brinks Radius Park, Malca-Amit etc) to allow daily publications of the amount of gold and silver in these commercial vaults. Powerful holders would not want the veil lifted. Hence, to railroad through the London vault delivery into COMEX contracts, a compromise has been reached between the bullion banks and regulators via upcoming CME and CFTC rule changes. After all, as a Scotia or JP Morgan bullion bank trader might say “Rules are made to be broken”.
Thus with this new shift from a 3 month to a 1 month vault reporting lag, the COMEX-LBMA gold pool tag team can, with a bit of spin, hold up a copy of the FEMR report and claim that the London vaults have made a Herculean transparency effort, indeed one that has the blessing of regulators, and successfully ‘lobby’ for a COMEX rule change to allow the London vaults a derogation to only report to COMEX on a 1 month lagged basis instead of the daily end of day requirement of their New York brethren.
Are you ready for this week’s absurdity? Here’s our Friday roll-up of the most ridiculous stories from around the world that are threats to your liberty, risks to your prosperity… and on occasion, inspiring poetic justice.
Mark Zuckerberg predicts civil unrest in November
File this one away under “No sh*t, Sherlock…” In a yet-to-be aired interview with Axios HBO, Mark Zuckerberg states the obvious that, come election night in the Land of the Free, there most likely won’t be a winner declared because it will take days, if not weeks, to count all the mail-in ballots.
Moreover, says Zuckerberg, there is “a heightened risk of civil unrest” especially between the end of voting and the time the results are announced.
(And to be even more obvious, depending on who wins the Presidency, we believe the resulting civil unrest will make all the rioting we’ve seen so far in 2020 look like a picnic in the park… but that’s another story.)
Disney cancels “Zip-a-dee-doo-dah” song
There may be no other large corporation that’s more woke than Disney. The media giant has changed everything– its shows, movies, rides, and attractions, to conform to the Twitter mob.
Disney has now opted to remove the song “Zip-a-dee-doo-dah” from its Disneyland theme park.
Zip-a-dee-doo-dah was released as part of Disney’s 1946 film Song of the South… and as you can probably imagine, Song of the South didn’t handle the issue of race as delicately as it would be treated today.
(I mean, the movie title has the word ‘south’ in it, so it is automatically offensive to the Twitter mob.)
OK great. So the movie offends the Twitter mob. But Disney is cancelling a SONG that was part of the movie’s original soundtrack. WHY?
According to Disney’s official response, “The removal of the song from Downtown Disney’s background music is part of a continuous process to deliver an environment that features stories that are relevant and inclusive.”
What exactly are the lyrics of Zip-a-dee-doo-dah that make it so inflammatory?
“My oh my what a wonderful day / plenty of sunshine headin’ my way.”
University creates tech to scan Twitter for misogynist Tweets
An Australian University is developing a technology that can identify misogynist and sexist Tweets.
Currently, Tweets have to be reported before they are deleted, which the team sees as a problem.
This technology will make it easier to censor the Tweets automatically– or at least send the Twitter mob after fresh victims.
Think of this as a way to automate the thought police, so that no stone goes unturned in identifying microaggressions. And in the future, it can be expanded to any woke principles that the Twitter mob sees fit.
Of course, the algorithm is only partially accurate. So the misidentified will just have to take one for the team.
German man fined €1,500 for flipping off speed camera
For driving 9 km/h over the speed limit (about 5 mph) Germany usually issues a €20 ticket.
But when the automatic traffic cameras flashed to take a picture of the minor infraction, one man decided to flip it the bird.
The picture of him with his middle finger up made it to the German authorities. And they decided to fine him €1,500 ($1,775) instead, for the crime of being offensive.
Pregnant Australian woman arrested for social media post about COVID
Police in Victoria, Australia entered a pregnant woman’s home, handcuffed, and arrested her in front of her two young children.
It was all because of a post she made encouraging people to attend an anti-lockdown protest.
The woman was also served with a search warrant for her electronics.
The encounter was recorded until police apparently turned off the recording in order to seize the cell phone it was being filmed on. “Any device in the house, we’re taking,” the officer in the video says.
The woman was taken into custody, and charged with incitement.
It is a breach of law, under Covid rules, to gather in large groups. And encouraging people to break that law is also illegal.
It’s absolute insanity that this is where we are at.
The government can do whatever it wants to restrict the freedom of its citizens– right up to shackling and caging a pregnant woman, in front of her kids, over a Facebook post.
“All these tiny little bubbles, brewing up trouble…”
Going to keep the Porridge short this morning as we ponder what’s occurring in stock markets, and what’s likely to happen today and over the weekend.
Yesterday was an “ouch” moment for markets as Richter Force 5 slip hit Tech Stocks. Did it herald the Big One or was it just another tremblor? Will it prove the long-fear “Minsky Moment” many market-bears have been waiting for; when the bubblicious bull market wakes up to the reality that easy money isn’t the same as a strong economy? Or is it likely to be a more selective correction to the crazy valuations on the growth/tech sector?
Or might it just be another Friday morning storm in a tea-cup? (No – I doubt it.)
Yesterday’s “crash” looks tiny compared to the pace and slope of the recovery in stock prices since March. However, September is often a cruel month for markets (as is October) and the degree of disbelief at record prices, stratospheric valuations and little tangible evidence to back them up seems to have tipped the balance from buy to sell.
I should have known a correction was coming – I had proof!
One of my chums bought a 3x levered Short FAANG ETF earlier this week. He’s a lovely and market-smart fellow – but let’s just say he’s made his money by trading lucky rather than being intellectual about markets! A number of my chartist friends were also saying a crisis was upon us.
As usual.. I ignored the evidence… Silly me.
The key issue about whether the current wobbling bull run is sustainable is going to be liquidity. All that money that’s been pumped into bond markets creating zero returns has had the effect of making Equities the only upside game in town. Now, the costs of the pandemic are coming due – the trillions that have been splurged on bailouts, furloughs and the QEI are largely spent.
Can Governments slow the slide by promising more?
In terms of the Pandemic economic damage we are hearing less about “whatever-it-takes” which means we worry more about the unspoken reality: “we can’t save everyone.” In the absence of further significant stimulus – there are bound to be market doubts about how to justify current record valuations. It’s another tip to the scales.
Stimulus and liquidity will be much talked about this weekend. Timing isn’t great. The US is closed Monday – which may mean deeper panic, or more time for a scramble as Central Banks put market dampners in place, and for governments to scrape together agreement on further stimulus measures to avoid the ultimate embarrassment of an “emperors new-clothes moment”: a real market crash accompanying the looming Pandemic depression.
Expect to see Trump tweet about how stupid the Fed is. It will be their fault. Its always someone else’s fault.
Papers are full this morning of parallels with the Dot.Com crash of 2000. This is not the same. The FAANGs and others are profitable firms making good money – the stocks to be really concerned about are different.
The Tech Firms making no money, no profits, and producing few goods, but trading at 4-digit or infinity P/Es.
Stocks in sectors at risk from the pandemic.
Banks as NPLs get set to soar.
Zombie firms addled by debt, which have seen their stock price pulled higher by expectation the tech stock rises will lift all stocks in its wake.
If this is it, then it’s going to be a fundamentals-quake.. It’s not a repeat of the 2000 Dot.Com Slide. There is lots in the press about options and the effects of financially-illiterate retail driving a logic-defying rise in VIX alongside rising markets. Happens. Get over it.
A big issue to further rattle markets on the back of a slide will be the US election. Trump was looking better as he reset the election on to the battleground of his choosing: Law and Order, and making Biden appear weak on social unrest. (I reckon the moment Biden “took the knee” was laudable, but may have cost him the election as conservative US voters who might have preferred him to Trump were shocked.)
If this correction deepens, the electoral focus will switch back to Trump and his foolish notion a strong stock market represents a strong economy.. Everything still to play for.
Final thought: interest rate repression via ZIRP and QEI on bonds means returns from defensive assets will remain improbably low. That still favours strong equity fundamentals for the economic recovery that is and will occur post-Pandemic. Place your bets accordingly.
via ZeroHedge News https://ift.tt/31ZCMRT Tyler Durden
Futures Rebound From Furious Selloff But Tech Slide Continues Tyler Durden
Fri, 09/04/2020 – 07:35
Futures tracking the S&P 500 and Dow indexes bounced on Friday – if not so much the Nasdaq – after Wall Street’s worst session since June, with attention now turning to the crucial jobs report that is likely to show a faltering recovery in the labor market. S&P 500 contracts gained as much as 0.6% ahead of the U.S. open although the bounce appeared to lose power, while Nasdaq 100 Index futures resumes their slide after an attempt to rebound failed.
Despite the recovery in spoos, Nasdaq futures were deep in the red, as shares of Apple and Tesla – the poster children for the furious August ramp – resumed their slide in early premarket trading, suggesting that momentum from the rout may still be present.
After climbing to record highs on the back of historic stimulus and a rally in technology stocks, the S&P 500 and Nasdaq suffered their worst day in nearly three months on Friday as investors booked gains.
Elsewhere, there was a muted reaction to the tech-driven plunge in U.S. markets on Thursday, with European bank stocks rallying after news that Spain’s CaixaBank SA and Bankia SA are exploring a 14 billion-euro merger. Europe’s Stoxx 600 erased opening losses of as much as 1% to trade in the green as investors piled into cyclicals, selling off defensive sectors. Banks led gains, up 1.8%, with an extra boost from deal activity among Spanish lenders. Miners, autos and travel also outperformed, while real estate, tech and food-and-drink stocks fell the most.
Earlier in the session, Asian shares dropped led by health care and communications, with Australia’s benchmark recording the biggest decline since May. The Topix declined 0.9%, with Elematec and GMO Payment Gateway falling the most. The Shanghai Composite Index retreated 0.9%, with Henglin Furnishings and Cfmoto Power posting the biggest slides
As previewed previously, this morning’s job report is expected to show 1.40 million U.S. jobs created last month, down from 1.76 million in July, as the government’s coronavirus aid ran out and companies from transportation to industrials announced layoffs or furloughs.
The data, expected at 8:30 a.m. ET could add pressure on the White House and Congress to restart stalled negotiations over the next coronavirus relief package, especially with stocks showing notable cracks.
Of course, attention will remain on tech companies. While the industry is generating blockbuster profits, there’s also been an explosion of speculative options among retail investors. For some investors, that’s clear evidence that tech stocks have become overheated according to Bloomberg.
“This is unlikely to be a repeat of the tech wreck of the late 1990s, given how much the market and sector have changed,” said JPMorgan Asset Management strategist Kerry Craig. While valuations are elevated, “we are also mindful of the earnings and revenue potential in the coming years from areas like cloud computing and artificial intelligence.”
In rates, Treasuries were under modest pressure in early U.S. trading with losses led by long end, although the price action was relatively subdued ahead of August employment report. Yields were cheaper by 0.5bp to 2bp across the curve with 2s10s spread steeper by ~1bp, 5s30s by ~1.7bp; 10-year yields around 0.65%, lagging bunds by ~1bp on the day while gilts keep pace. European bonds were little changed, outperforming Treasuries.
In FX, the U.S. dollar consolidated gains on Friday but was set for its biggest weekly rise since mid-June as an overnight drop in high-flying U.S. technology stocks fuelled a bout of risk aversion in global markets. The dollar’s bounce this week comes after weeks of losses which saw the greenback fall to a April 2018 low of 91.74 on Tuesday after the U.S. central bank overhauled its policy framework last week, which would allow it to keep rates lower for longer periods, a negative for the dollar.
“The dollar’s loss-making momentum has stopped a little bit and the recent ECB comments on the euro has also helped but the broader direction of monetary policy making will be a key factor going ahead,” said Ulrich Leuchtmann, analyst at Commerzbank.
Against a basket of currencies the dollar was trading at 92.774 in early London trading. On a weekly basis, it was up 0.6%, its biggest weekly rise since mid-May. “Near-term, if this correction in big tech continues, it will impact overall risk and fuel further demand for the dollar,” Mizuho strategists said in a note. Most currencies held in tight ranges before payrolls; Norway’s krone led gains, while the Australian dollar shrugged off an early dip to climb, after the country recommitted to opening the economy by December
In commodities, oil held above $44 a barrel on Friday and was on course for its biggest weekly decline since June as weak demand figures added to concern over a slow recovery from the COVID-19 pandemic. A U.S. government report showed that domestic gasoline demand fell in the latest week. Middle distillates inventories at Asia’s oil hub Singapore have soared above a nine-year high, official data showed. Elsewhere, spot gold and silver remain contained within tight ranges around 1935/oz and 28.80/oz respectively as the precious metals mirror Dollar action. In terms of base metals, Shanghai copper saw a session of losses as it tracked the performance in Chinese markets, whilst Dalian iron futures also tracked lower.
To the day ahead now, and as mentioned the US jobs report will likely provide the main highlight. Otherwise, we’ll also get German retail sales for July, the August construction PMIs from Germany and the UK, and the Canadian jobs report for August. Meanwhile, central bank speakers include the ECB’s Lane and Villeroy, along with the BoE’s Saunders.
Market Snapshot
S&P 500 futures up 0.4% to 3,476.00
STOXX Europe 600 up 0.5% to 368.06
MXAP down 1.2% to 171.58
MXAPJ down 1.3% to 566.34
Nikkei down 1.1% to 23,205.43
Topix down 0.9% to 1,616.60
Hang Seng Index down 1.3% to 24,695.45
Shanghai Composite down 0.9% to 3,355.37
Sensex down 1% to 38,602.63
Australia S&P/ASX 200 down 3.1% to 5,925.51
Kospi down 1.2% to 2,368.25
Brent futures up 0.4% to $44.25/bbl
Gold spot up 0.2% to $1,934.36
U.S. Dollar Index little changed at 92.70
German 10Y yield rose 1.3 bps to -0.475%
Euro down 0.09% to $1.1841
Italian 10Y yield rose 0.3 bps to 0.849%
Spanish 10Y yield rose 0.9 bps to 0.335%
Top Overnight News from Bloomberg
U.S. House Speaker Nancy Pelosi and Treasury Secretary Steven Mnuchin have agreed to work to avoid a government shutdown just before the November election, and to not let the battle over stimulus funding delay a stopgap bill
Coronavirus cases surpassed 26 million worldwide, while deaths exceeded 868,000
Australia’s Prime Minister Scott Morrison announced that most state and territory leaders were committed to reopening the country’s economy by December in an attempt to bring it out of its first recession in decades
The Bank of England is likely to have to ease monetary policy further to help combat the economic impact of the coronavirus, according to central bank official Michael Saunders
Boris Johnson’s government said it will be able to avoid border chaos when the U.K. completes its split from the European Union despite stark warnings from industry over its lack of readiness
A quick look at global markets courtesy of NewsSquawk
APAC stocks declined across the board as the region reacted to the bloodbath on Wall St where markets slipped aggressively from record levels and the DJIA fell over 800 points and Nasdaq shed over 5% amid a tech rout, as well as the paring of risk heading into the NFP jobs data and US holiday weekend. ASX 200 (-3.0%) and Nikkei 225 (-1.1%) were heavily pressured in the face of the tech-related headwinds which resulted to hefty losses for the sector in Australia and dragged the index beneath the 6,000 level, while sentiment in Tokyo also deteriorated as exporters suffered the ill-effects of a firmer currency. Elsewhere, Hang Seng (-1.3%) and Shanghai Comp. (-0.9%) conformed to the broad losses in the region which followed a substantial net liquidity drain of CNY 470bln by the PBoC this week, and as tensions lingered with Chinese President Xi suggesting China will never accept foreign interference and with Global Times stating China will further cut holdings of US bonds due to concerns about a US crackdown and risks of ballooning US deficit although the reports cited economist and not government officials. Finally, 10yr JGBs traded flat as prices failed to benefit from the stock rout and the BoJ’s presence in the market, which was for a relatively reserved JPY 520bln of JGBs heavily focused on 5yr-10yr maturities.
Top Asian News
Sri Lanka’s President Seeks to Restore Sweeping Executive Powers
Chinese Banks Plan $29 Billion in Bond Sales to Replenish Capital
Turkey Warns West It Will Continue to Shop Around for Missiles
Yum China Is Said to Raise $2.2 Billion in Hong Kong Listing
European equity markets have staged somewhat of a recovery since the cash open (Euro Stoxx 50 +0.5%) after erasing losses of some 0.9% following a downbeat APAC session – with gains lead by the periphery, namely the IBEX (+1.6%) propped up by source reports that Bankia (+30%) and Caixabank (+15%) are working on a merger, with a deal to be closed in the next few days. Thus, the European financial sector is outperforming with the FTSE MIB (+0.6%) also benefitting given its large exposure to banks. Overall sectors present a cyclical/value tilt, whilst IT clambered its way from the bottom after initial pressure from Wall Street’s tech rout. The breakdown also sees a firm performance amongst Travel & Leisure names, underpinned by the recovery in sentiment alongside relief as Greece and Portugal were not added to UK’s travel quarantine list despite speculation. In term of individual movers, Telecom Italia (+0.2%) remains subdued after the Italian Industry Ministry stated that the Co. may not have a majority stake in Italy’s future single broadband network operator, thus providing impetus to Mediaset (+8.1%). Finally, Imperial Brands (+2.9%) remains underpinned by a positive broker move.
Top European News
Russia Rate Cut in Question After Novichok Claim Hits Ruble
London’s Housing Market Lures Hong Kongers Seeking Safe Haven
Bank of England Rate Cuts Aren’t Lowering Mortgage Costs
One in Seven U.K. Homes Are Selling in a Week After Tax Cut
In FX, the Dollar looks laboured ahead of NFP and Monday’s US market holiday, or simply fatigued after its recovery exertions that culminated in the DXY reaching 93.074 before petering out. Pre-NFP caution and consolidation has curtailed price action with major pairings restrained within narrow ranges, exemplified by the index sticking to tight confines just below the round number (92.887-658). US Treasuries are back in bear-steepening mode to offer the Greenback support, while stocks are attempting to draw a line under yesterday’s rout awaiting further direction from the aforementioned jobs data.
CAD/AUD/GBP/NZD – All marginally firmer vs the Buck, but mainly in corrective trade following heavy recent losses as the Loonie rebounds from 1.3140 to 1.3100+ ahead of Canada’s labour report with some traction from a stabilisation in crude prices, the Aussie bounces from around 0.7250 despite a slender miss vs consensus in July retail sales and the Pound also finds some support near a half round number to revisit the 1.3300 handle irrespective of a slowdown in the UK construction PMI or dovish sounding comments from BoE’s Saunders. Meanwhile, the Kiwi is pivoting 0.6700 and assessing the NZ COVID-19 situation following the first death and PM Adern’s review of current restrictions on September 14.
EUR/JPY/CHF – Even more tightly bound against the US Dollar, with the Euro capped by the 200 HMA (1.1866) and heavily flanked by option expiries stretching from 1.1780-90 right up to 1.2000 (for full details see the headline feed at 6.57BST). Similarly, the Yen sits between decent expiry interest from 106.00 to 106.70-80 if it ventures beyond the 106.07-24 band that seems unlikely given little inclination amidst reports suggesting the BoJ is about to raise its assessment of the Japanese economy, and the Franc is straddling 0.9100.
SCANDI/EM – The Nok has regained a degree of composure alongside oil, but the Try remains deflated in wake of Thursday’s soft Turkish CPI data and licking wounds off fresh all time lows.
In commodities, WTI and Brent front month futures trade have recovered off worst levels to eke mild gains in early European hours, in what seems to be a sentiment-driven move in tandem with stock markets heading into this month’s US labour market report. Oil-specific news-flow has remained light with participants continuing to flag the resumptions of Gulf of Mexico supply alongside an uncertain demand outlook. WTI Oct makes headway just above USD 41.50/bbl (vs. low (40.84/bb) whilst Brent Nov extends gains above USD 44/bbl (vs. low USD 43.53/bbl). Looking ahead to next week, monthly oil import numbers from China, released on Monday, will be eyed as a gauge of demand in the nation, ahead of the EIA STEO, although the OPEC and IEA MOMRs will be released on the following week. Elsewhere, spot gold and silver remain contained within tight ranges around 1935/oz and 28.80/oz respectively as the precious metals mirror Dollar action. In terms of base metals, Shanghai copper saw a session of losses as it tracked the performance in Chinese markets, whilst Dalian iron futures also tracked lower with rising portside inventories also weighing on the metal.
US Event Calendar
8:30am: Change in Nonfarm Payrolls, est. 1.35m, prior 1.76m
8:30am: Unemployment Rate, est. 9.8%, prior 10.2%
8:30am: Average Hourly Earnings MoM, est. 0.0%, prior 0.2%; Average Hourly Earnings YoY, est. 4.5%, prior 4.8%
DB’s Jim Reid concludes the overnight wrap
Ahead of today’s all-important US jobs report, there was a rout in markets yesterday led by the tech sector. Having reached a record high just the day before, the S&P 500 fell -3.51% in its biggest one-day decline since June 11th, with the VIX volatility index spiking up 7.0pts to its highest levels since mid-July. Interestingly, the jump in volatility was across the curve and the election volatility premium remains intact even after the large spike yesterday. As mentioned big tech was the main culprit behind the losses after having continuously powered forward since March. The NASDAQ fell -4.96% in its biggest daily fall for nearly 3 months, as Apple (-8.01%), Microsoft (-6.19%) and Amazon (-4.63%) all lost ground. For context though, this move only gives up the last week of gains for the NASDAQ and it is still up +27.70% on the year and +67.01% since the March lows.
Many recent winners were particularly hard hit as profit-taking took over. Stay-at-home stocks saw pull backs with Zoom (-9.97%), Docusign (-8.73%), and Slack (-7.93%) all falling, while Tesla (-9.00%) and Apple fell for the second day after rising early in the week following their stock splits. Late in the session, news came out that the US Justice Department plans to file antitrust charges against Google (-5.00%) in the coming weeks, the news initially pushed the stock another -1.5% lower though it made much of that back by the close.
Our tech strategist Apjit Walia, who sits in my team, published “America’s Racial Gap & Big Tech’s Closing Window” on Wednesday where he discussed tech inequality but also the surprisingly low number of only 1 in 3 Americans now having a positive view on Big tech companies according to our proprietary survey. As Apjit says the window for these companies is closing and post election they are likely to see closer scrutiny whoever wins. See the note from earlier this week here. Given his long history in the tech sector and reputation it’s not impossible that his note has had some influence on markets over the last 24 hours.
The large moves yesterday were evident across an array of asset classes and countries, as there was a broader rotation out of risk assets into safe havens. European equities saw a similar reversal to the US, as they pared back their strong gains at the open for the STOXX 600 to close down -1.40%. Oil fell to their lowest levels in over a month, down over -2% at one point, before Brent settled at -0.81% and WTI -0.34%. Core sovereign bonds rallied on both sides of the Atlantic, with yields on 10yr Treasuries (-1.3bps) and bunds (-1.5bps) falling further. Over in FX meanwhile, the Swiss Franc was the top-performing G10 currency, with the dollar index slightly lower (-0.12%). Not all havens gained though with gold dropping -0.62%. Silver fell -3.14%.
Overnight in Asia markets are down but not excessively so. The Nikkei (-1.30%), Hang Seng (-1.83%), Shanghai Comp (-1.38%), Kospi (-1.56%) and Asx (-3.11%) are all lower. Futures on the S&P 500 are down a further -0.56% though while those on the Nasdaq are down -1.29% indicating that the Wall street sell off might extend into today. We’ll see how the Robinhood community, that aren’t used to markets going down, react. Elsewhere oil prices are down a further c. -1% this morning and spot gold prices are back up +0.39%.
In terms of news this morning the Global Times reported (citing experts) that China may gradually reduce its holdings of US Treasury bonds to about $800 billion from the current level of more than $1 trillion, as the ballooning US federal deficit increases default risks and the Trump administration continues its blistering attack on China. The Global Times is believed to be well connected to the Chinese Communist party but it is not clear whether the article was official. For context China’s holdings of US bonds had dropped by c. -3.4% yoy as of the end of June. Another story worth highlighting is that the House Speaker Nancy Pelosi and Treasury Secretary Mnuchin have agreed to work to avoid a government shutdown in October right before the election, and not let the stalemate over virus-relief legislation hold up a vital stopgap spending bill.
In other overnight news, the UK government said that its “Eat Out to Help Out” initiative, which ended on August 31, has already led to GBP 522mn being committed versus the estimated GBP 500mn. The figure will increase further as the establishments have until the end of September to claim the money back. While we are on this its worth highlighting our CoTD from yesterday (link here) which showed how the initiative led to jump in restaurant reservations in the UK in August and has been very useful at shaping behaviour habits in a country more badly hit by the virus than many others.
On the coronavirus, there were further concerning trends yesterday, with the UK reporting the most cases (1,757) since early June yesterday. The French Health Ministry acknowledged that increased testing does not fully explain the recent rise of French cases as the weekly caseload is now the highest of the pandemic. Elsewhere Israel is planning on imposing lockdowns on 30 towns that have the highest infection rates in the country in one of the stricter recent reactions to new outbreaks. Under the lockdown, businesses and the majority of schools will be closed with residents required to be within 500 meters of their homes. Separately in the US, Dr Fauci warned that 7 states were at risk of a surge, including Illinois and Indiana. Governor Cuomo of New York reopened malls in the state, but is still unsure on indoor dining in New York City creating issues for the service industry into the winter. Meanwhile as cases are surging on school campuses, a New York state university sent students home for the semester and Indiana University warned of “uncontrolled spread” at fraternities and sororities.
As the dust settles from yesterday’s swings, attention today will turn to the US jobs report for August, which will be the first release since the enhanced unemployment benefits lapsed at the end of July. Our US economists here at DB are looking for a +1.2m increase in nonfarm payrolls, which should push the unemployment rate down to 9.7% (vs. 10.2% at present). If realised, that would bring the total gains in nonfarm payrolls since April to +10.5m, but even then it would still mean that less than half of the -22m jobs lost in March and April had been recovered, so this is likely to be a long journey yet. Today’s jobs report is also the penultimate one before the presidential election in less than 2 months’ time, so is also likely to take on a good deal of political significance, as President Trump and the Republicans look to claim credit for the economic rebound taking place.
Ahead of that later, we got the weekly initial jobless claims yesterday for the week through August 29th, which showed a decline to a post-pandemic low of 881k. That said, it’s worth bearing in mind that changes in the seasonal adjustments mean this number isn’t directly comparable to last week’s, and that the unadjusted number actually showed an increase in claims of 7,591 up to 833,352. The other main release came from the services and composite PMIs, where the Euro Area composite PMI was revised up to 51.9 (vs. flash 51.6), and the German reading also saw an upward revision to 54.4 (vs. flash 53.7). Finally, the ISM services index in the US came in at 56.9 (vs. 57.0 expected), though the employment index only rose to 47.9, so still remaining in contractionary territory. Prices paid though jumped to 64.2 vs 57.6, the highest since November 2018.
To the day ahead now, and as mentioned the US jobs report will likely provide the main highlight. Otherwise, we’ll also get German retail sales for July, the August construction PMIs from Germany and the UK, and the Canadian jobs report for August. Meanwhile, central bank speakers include the ECB’s Lane and Villeroy, along with the BoE’s Saunders.
via ZeroHedge News https://ift.tt/3lOaUbl Tyler Durden
Democrats Introduce Legislation To Declare Racism A Public Health Crisis Tyler Durden
Fri, 09/04/2020 – 07:00
A bill introduced on Thursday by Democratic lawmakers would classify racism as a nationwide public health crisis – requiring two wings within the Centers for Disease Control (CDC) to address it, according to The Hill.
The bill – Anti-Racism in Public Health Act – was crafted by Sen. Elizabeth Warren (D-MA) and House Reps. Barbara Lee (D-CA) and Ayanna Pressley (D-MA). It is co-sponsored by Sens. Mazie Hirono (D-HI), Ed Markey (D-MA), Jeff Merkley (D-OR) and Tina Smith (D-MN).
Possibly manipulated photo of Elizabeth Warren
“It is time we start treating structural racism like we would treat any other public health problem or disease: investing in research into its symptoms and causes and finding ways to mitigate its effects,” said Warren, who masqueraded as a different race for decades – potentially depriving actual Native Americans positions at liberal institutions.
“My bill with Representatives Lee and Pressley is a first step to create anti-racist federal health policy that studies and addresses disparities in health outcomes at their roots,” she added.
Anti-racism street sign, via PBS News Hour – “The signs are meant as a recognition of the public’s participation in unequal systems” and has nothing to do with Warren’s bill.
The proposal comes after the American Public Health Association declared systemic racism a public health crisis at the beginning of June — shortly after Minneapolis police killed George Floyd, a Black man.
Since then, Michigan, Wisconsin and Colorado have done the same. At a local level, municipalities in over 19 states have also made the designation. –The Hill
Coronavirus and racism?
Reps. Pressley and Lee claim that COVID-19 has exacerbated public health inequities among people of color, as Black and Latino Americans have a much higher chance of dying from the disease vs. Whites.
An August report from the National Urban League, partly based on data from Johns Hopkins University, revealed that Black Americans are more than two times more likely to die from COVID-19 than White or Latino Americans. Latino Americans have the the highest infection rate — 73 cases per 10,000 people — out of the three demographics, but Black Americans still are nearly three times as likely to get sick from the virus than White Americans, who have the lowest infection rate.
The CDC acknowledges this fact on its website, saying “long-standing systemic health and social inequities have put many people from racial and ethnic minority groups at increased risk of getting sick and dying from COVID-19.” –The Hill
For those wondering how the CDC thinks COVID-19 affects racial and ethnic minority groups, see below (via the CDC):
* * *
Factors that contribute to increased risk
Some of the many inequities in social determinants of health that put racial and ethnic minority groups at increased risk of getting sick and dying from COVID-19 include:
Discrimination: Unfortunately, discrimination exists in systems meant to protect well-being or health. Examples of such systems include health care, housing, education, criminal justice, and finance. Discrimination, which includes racism, can lead to chronic and toxic stress and shapes social and economic factors that put some people from racial and ethnic minority groups at increased risk for COVID-19.
Healthcare access and utilization: People from some racial and ethnic minority groups are more likely to be uninsured than non-Hispanic whites. Healthcare access can also be limited for these groups by many other factors, such as lack of transportation, child care, or ability to take time off of work; communication and language barriers; cultural differences between patients and providers; and historical and current discrimination in healthcare systems. Some people from racial and ethnic minority groups may hesitate to seek care because they distrust the government and healthcare systems responsible for inequities in treatmentand historical events such as the Tuskegee Study of Untreated Syphilis in the African American Male and sterilization without people’s permission.
Occupation: People from some racial and ethnic minority groups are disproportionately represented in essential work settings such as healthcare facilities, farms, factories, grocery stores, and public transportation. Some people who work in these settings have more chances to be exposed to the virus that causes COVID-19 due to several factors, such as close contact with the public or other workers, not being able to work from home, and not having paid sick days.
Educational, income, and wealth gaps: Inequities in access to high-quality education for some racial and ethnic minority groups can lead to lower high school completion rates and barriers to college entrance. This may limit future job options and lead to lower paying or less stable jobs. People with limited job options likely have less flexibility to leave jobs that may put them at a higher risk of exposure to the virus that causes COVID-19. People in these situations often cannot afford to miss work, even if they’re sick, because they do not have enough money saved up for essential items like food and other important living needs.
Housing: Some people from racial and ethnic minority groups live in crowded conditions that make it more challenging to follow prevention strategies. In some cultures, it is common for family members of many generations to live in one household. In addition, growing and disproportionate unemployment rates for some racial and ethnic minority groups during the COVID-19 pandemic may lead to greater risk of eviction and homelessness or sharing of housing.
* * *
And there you have it.
via ZeroHedge News https://ift.tt/3bqr6uw Tyler Durden
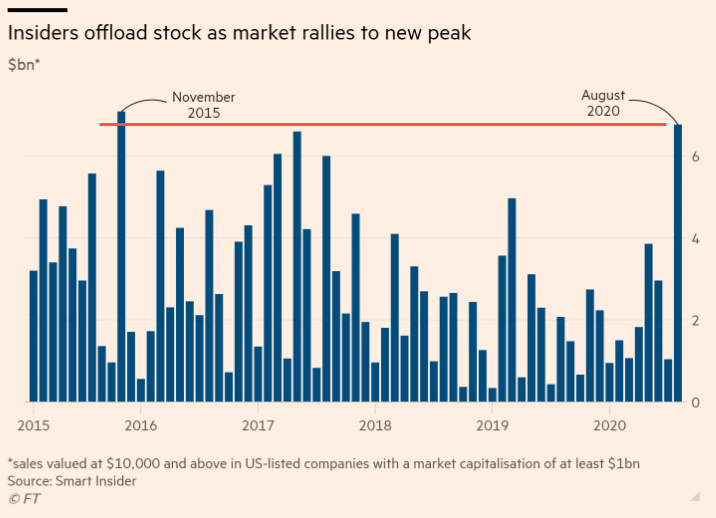

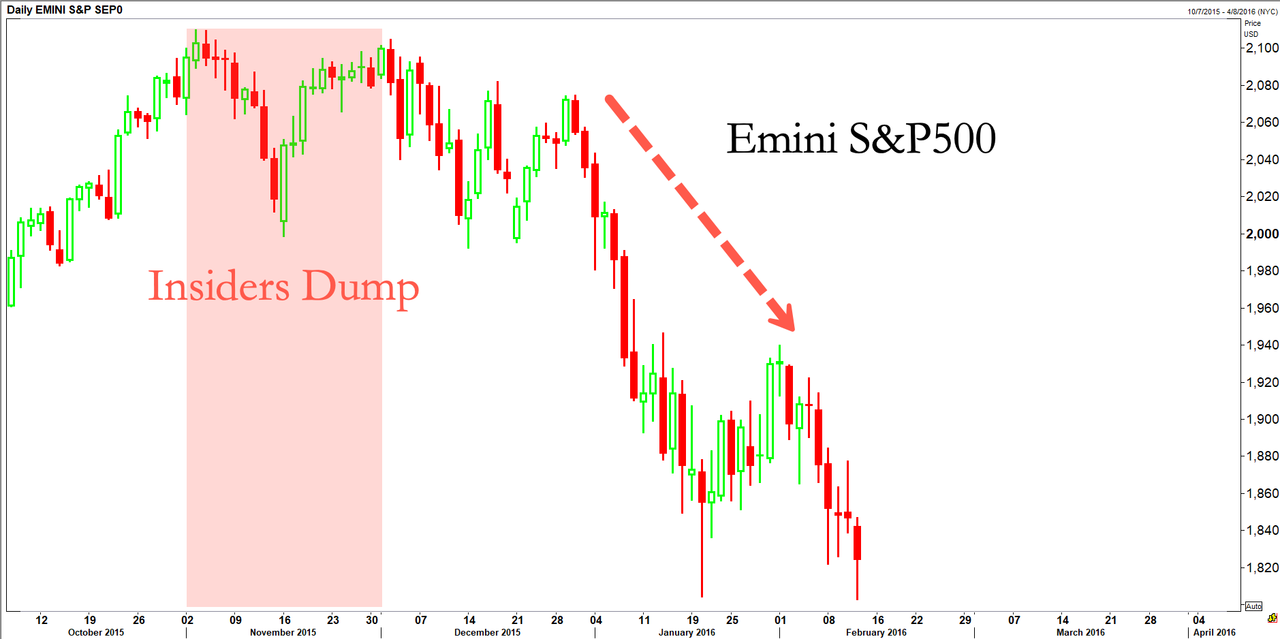
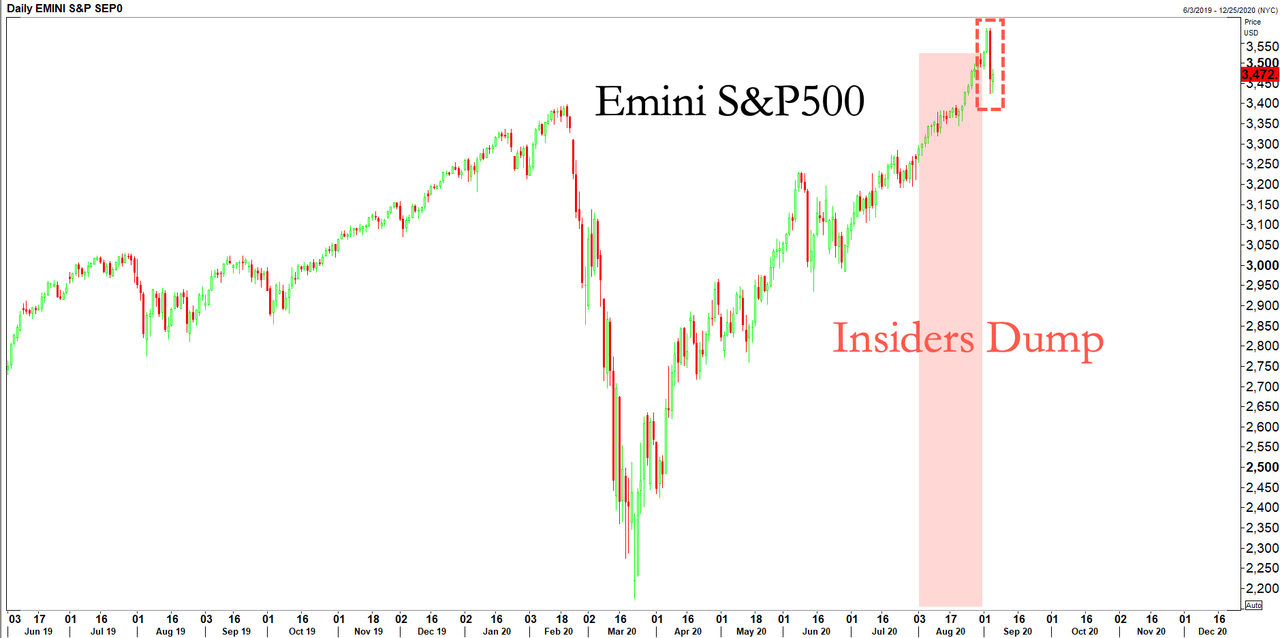


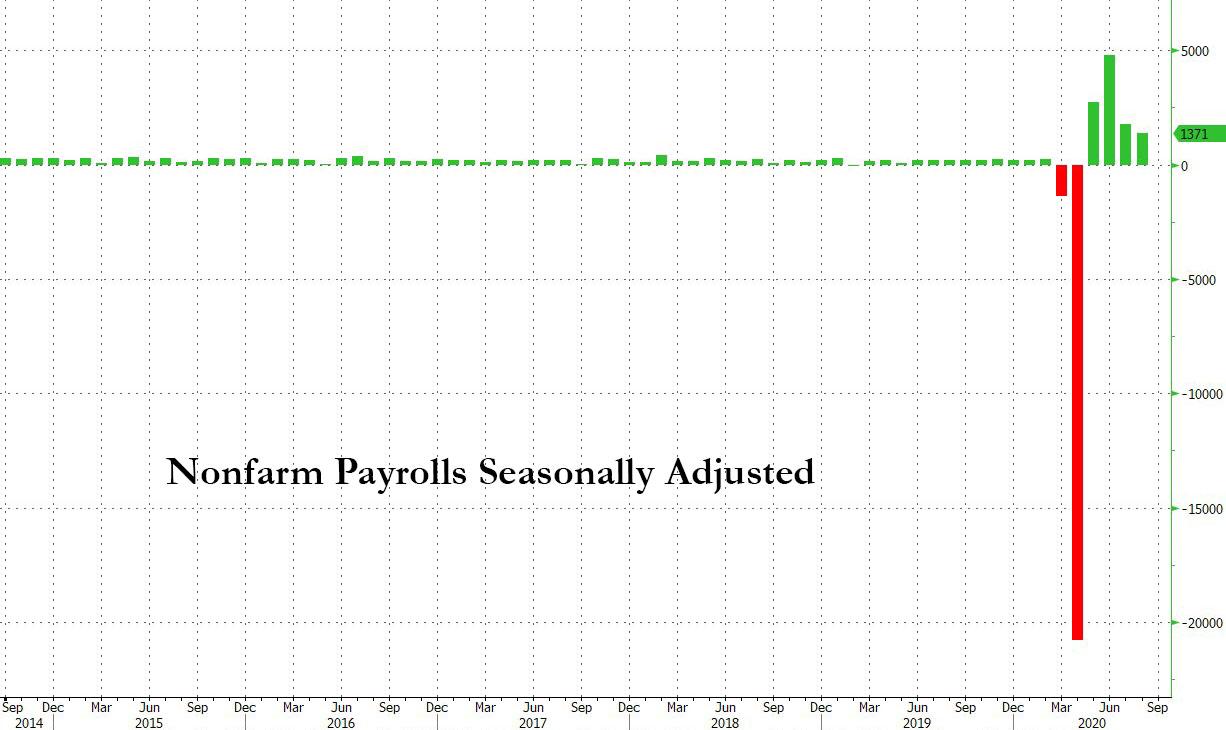
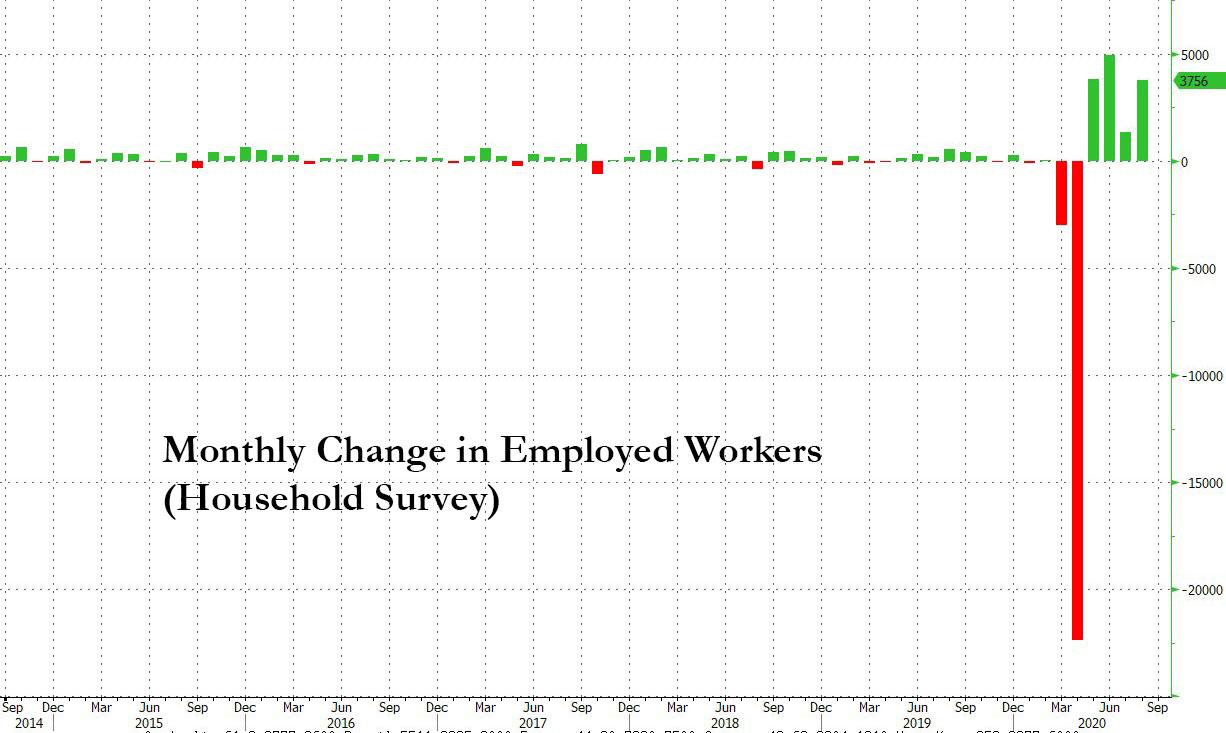
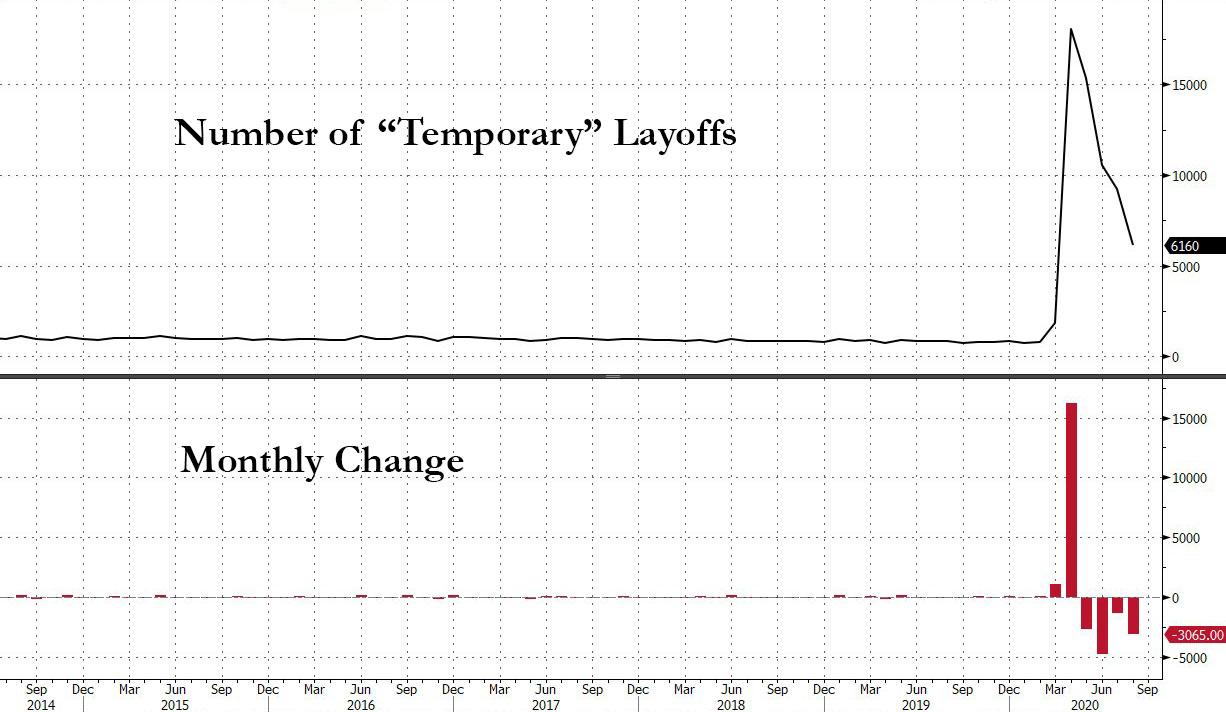
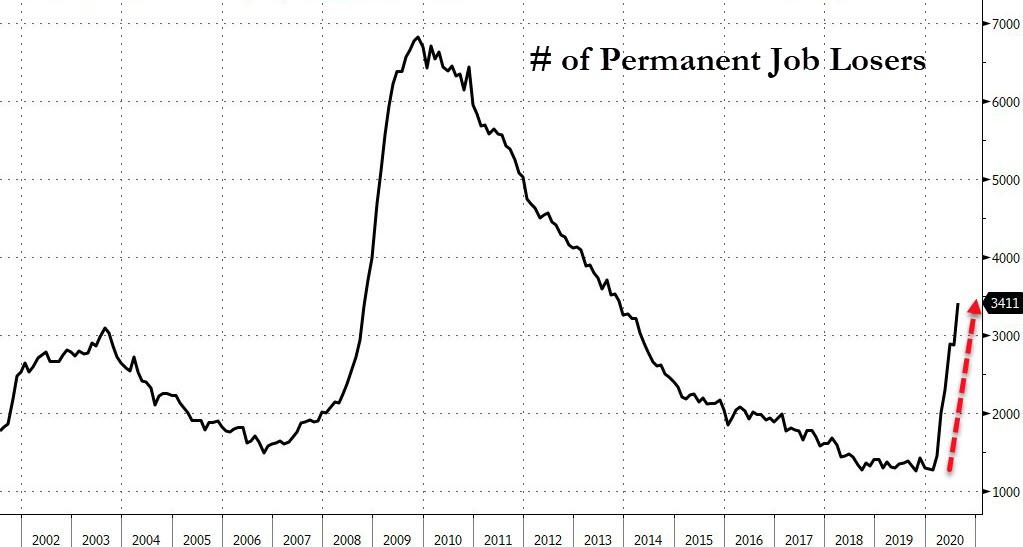


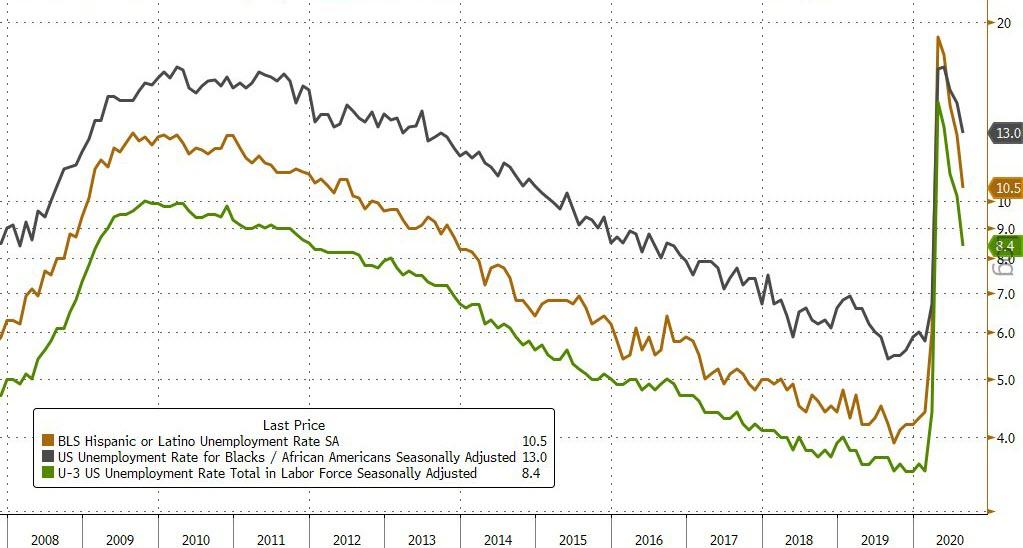


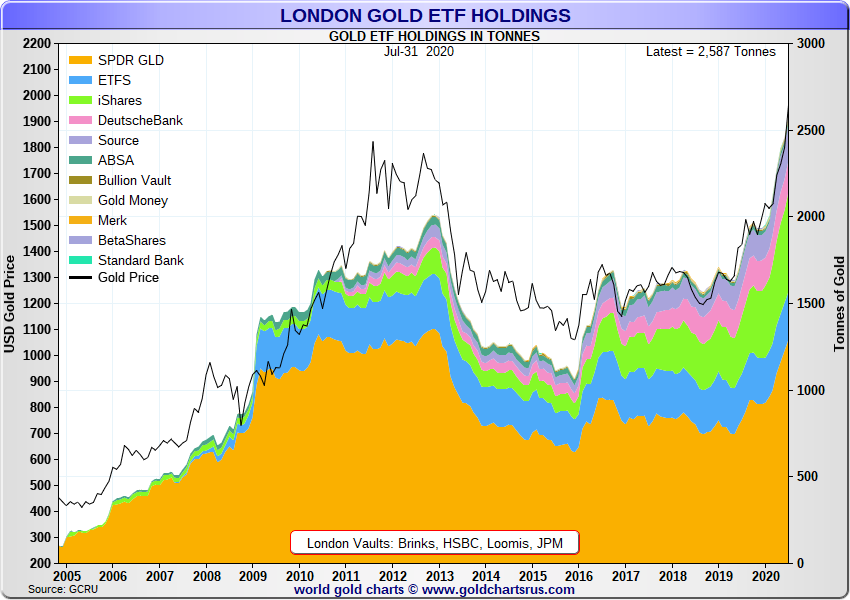
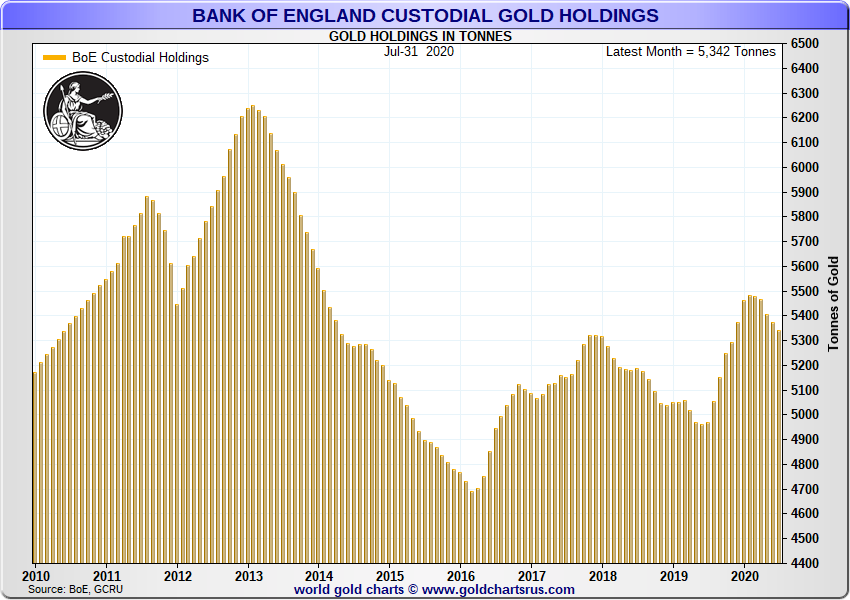
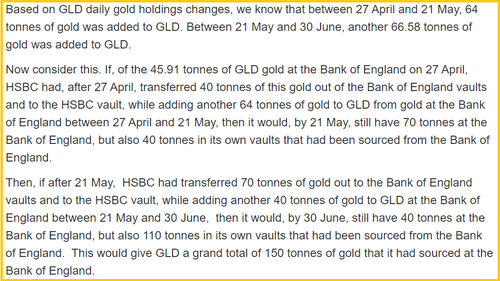
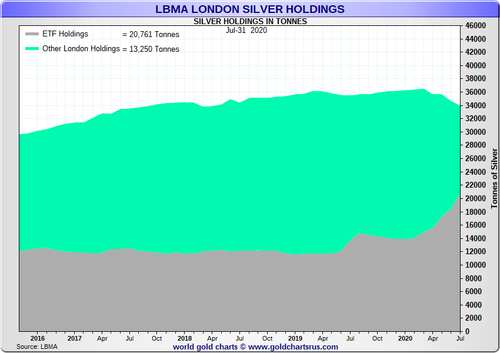


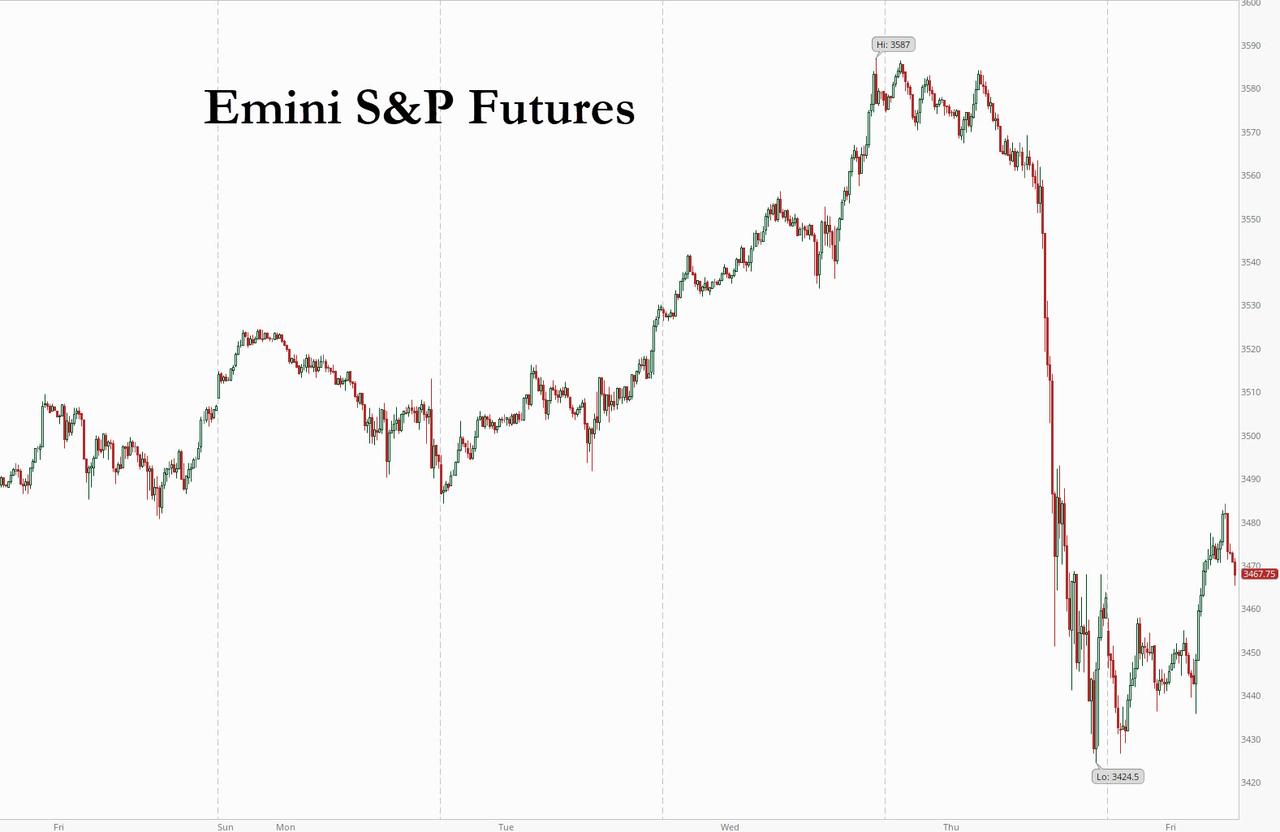

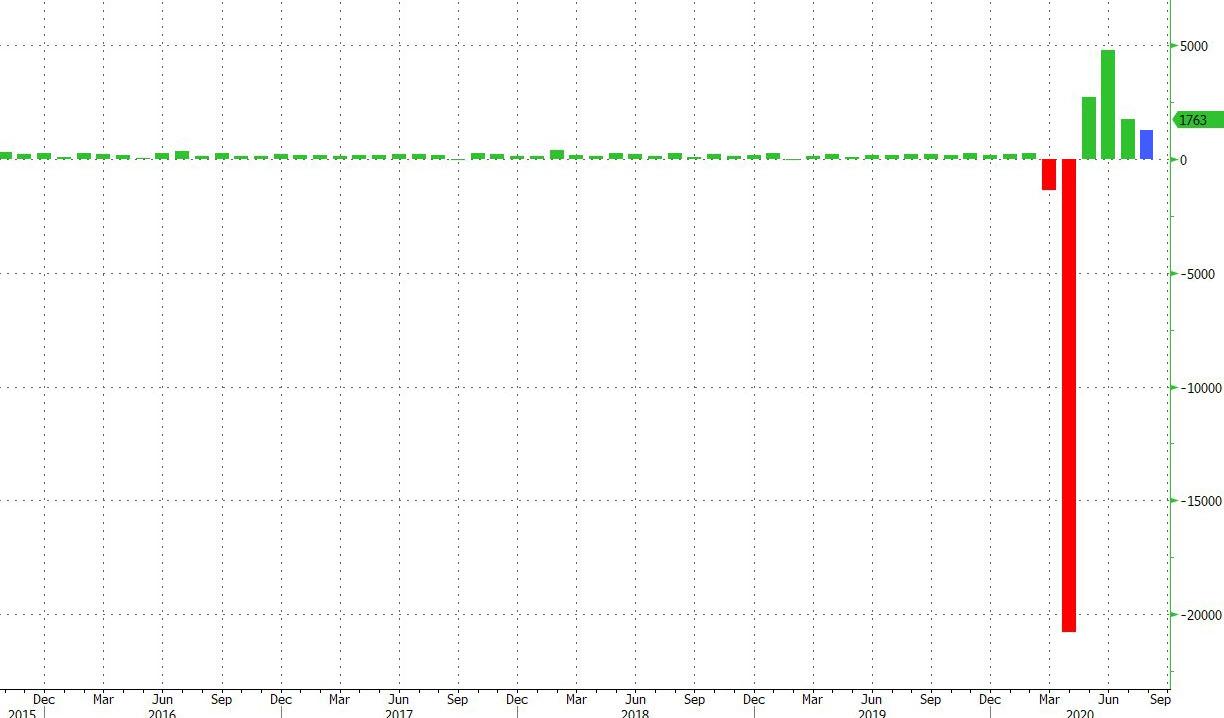


