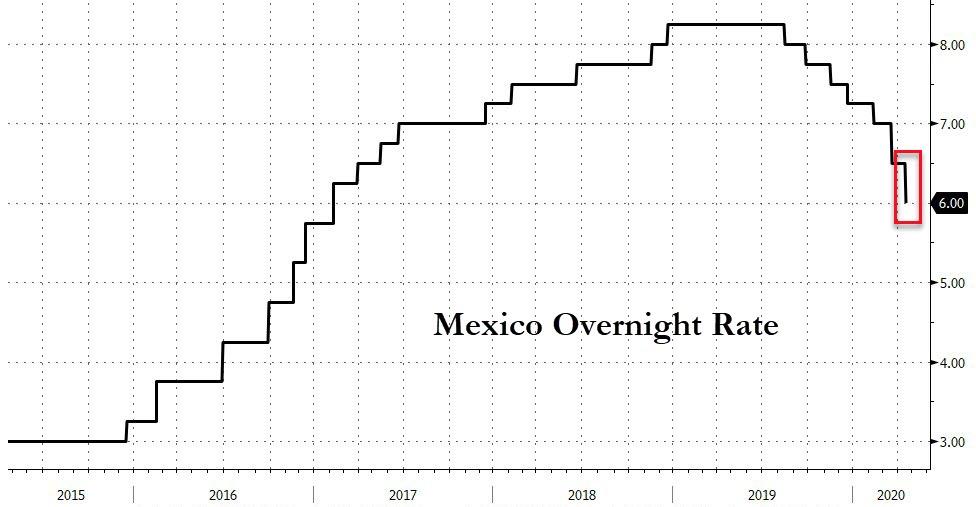
Mexico Cuts Rates 50bps In Surprise Move, Warns Of GDP Plunge
In a unanimous decision, Banxico’s board surprised the market and lowered the reference rate by 50bps to 6% in the face of a widely-expected recession in the country this year (which it now expects to be a 1H 2020 drop of more than 5% YoY).
“It is estimated that the negative effects on domestic economic activity resulting from the pandemic may lead to an important contraction of economic activity in Mexico during the first half of the year. Although the magnitude and duration of the effects of the pandemic are still unknown, and since available information is still limited, initial estimates suggest that during the first half of 2020 GDP could fall more than 5% as compared to the same period of the previous year. It is clear that slack conditions are widening considerably, in a context in which the balance of risks for growth is significantly biased to the downside
“Considering the risks resulting from the COVID-19 pandemic for inflation, economic activity and financial markets, major challenges arise for monetary policy and for the economy in general.”
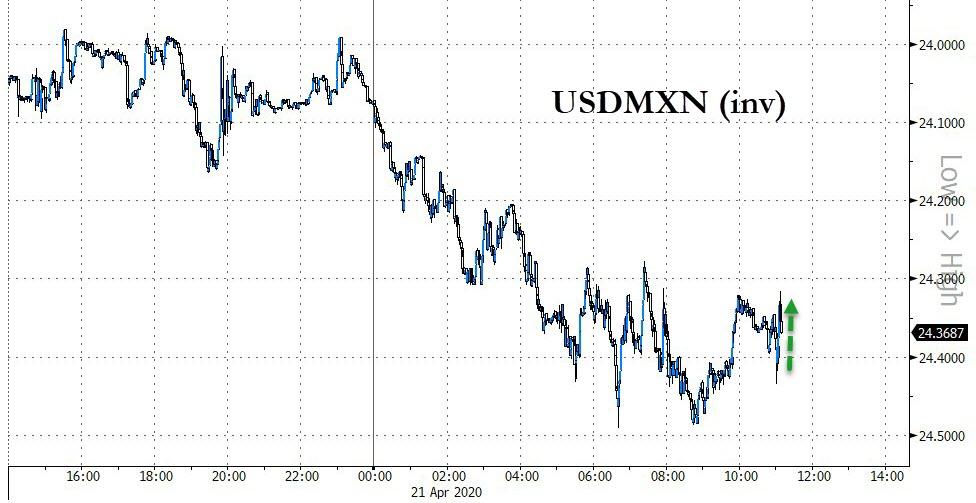
Very little reaction for now in the peso…
Though warnings of “implementing additional measures for orderly markets” may prompt some more selling soon…
“The Governing Board also decided to implement additional measures to foster an orderly behavior of financial markets, strengthen the credit channels and provide liquidity for the sound development of the financial system.”
After Billions In Losses, Michael Hasenstab Finally Closes His Treasury Short
There is a saying that bull markets make geniuses out of the biggest idiots, and when it comes one of the world’s most famous “traders”, we just saw that saying in action.
Last October, two months after we reported that Templeton’s “investing wudnerkind” Michael Hasenstab, who for nearly a decade during the most artificial bull market in history had a knack of investing in the crappiest bonds around the globe and betting they would get bailed out by one or more central banks – which is precisely what happened… until last summer, lost $3 billion in the third quarter as two of its biggest investments soured.
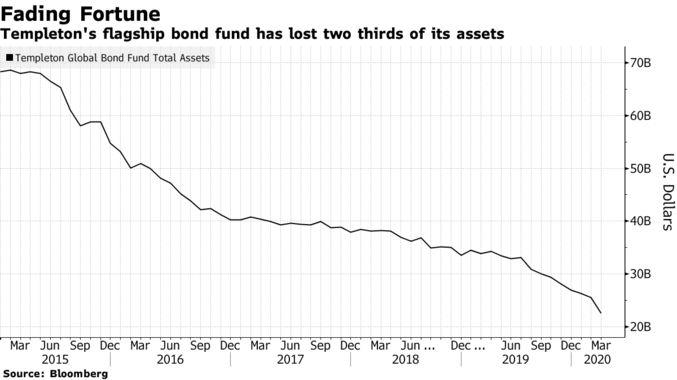
Since then it’s only gone downhill for the “famous” investor (who as we said back in 2015should be best known for either i) buying the most distressed sovereign bonds and praying for a central bank bailout or ii) doing precisely what everyone else was doing and calling it contrarian), and according to the latest Bloomberg update, the bond fund run by Hasenstab posted a $4.3 billion decline in assets in the first three months of the year, its worst quarter since 2016.
Total net assets in the Templeton Global Bond Fund slumped to $22.6 billion as of March 31, public filings show, down from $26.9 billion at the end of 2019. It was the fourth consecutive quarter of declines, taking the drop in holdings in the past year to $11 billion, and nearly $50 billion since the peak of Hasenstan’s popularity in 2015 (or right around the time we tried to warn everyone that ‘Famous’ Bond Investor Turns Out To Be Nothing More Than A Glorified BTFDer).
While Hasenstab’s career was largely built on betting that Europe would keep bailing out Greece, Italy and other insolvent nations again and again, he turned out to be a one-trick pony when he applied the same investing thesis to Argentina and other nations, losing billions on last year’s Argentina bond crash. But his biggest fiasco was going short Treasurys years ago, which cost the fund billions and billions – to quote Trump – until Hasenstab finally threw in the towel.
As Bloomberg also reports, after suffering catastrophic losses, Hasenstab has ended his “painful” Treasury short, betting that yields are bound to rise, a trade which every Wall Street macrotourist like Hasenstab had put on each year from 2010 through 2019 and got crushed on.
Filings this week showed that the Templeton Global Bond Fund’s average duration – a measure of its sensitivity to interest rates – turned positive for the first time since 2017 in the last three months. A person familiar with the matter who asked not to be identified confirmed the fund has tactically unwound its short position on Treasuries. -Bloomberg
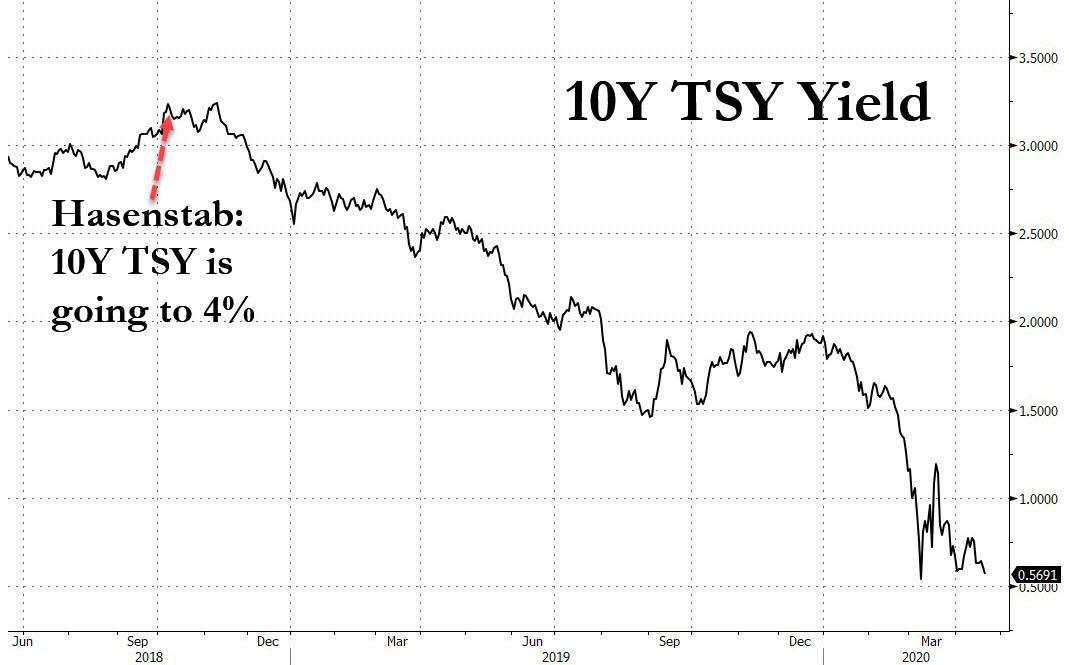
This is perhaps the most prominent capitulation for Hasenstab, who had argued a few years ago that Treasury yields would climb above 4% given rising deficit spending and inflation pressures. While that bet looked “promising” in 2018, before the Federal Reserve embarked on a new cycle of rate cuts, yields have since crashed to record lows as stimulus measures to fight the fallout meant the Fed would rollout unlimited QE forcing Powell to purchase record amounts of Treasury debt, and steamrolling all the Treasury bears.
While Hasenstab’s short Treasury position started off small in 2017 – using mostly interest-rate swaps – it grew steadily until the middle of last year, when it became the biggest such bet of any major global bond fund. In October 2018 Hasenstab said in a podcast 10-year Treasury yields “could easily” get above 4%. Just a few days later the benchmark yield touched a high of about 3.2% before starting a relentless drop decline that has been exacerbated by stimulus to counter the impact of the pandemic. On Tuesday the yield was well below 0.6%.
In the process Templeton has suffered billions in losses, putting even the Argentina fiasco to shame.
Once a top-performer with triple the current assets, Hasenstab’s Global Bond Fund has become a laughing joke, losing 7.6% in the past year compared with a double-digit return for Treasuries. Morningstar meanwhile mainstains its top analyst rating for the fund in October and said in a February note the “often contrarian approach” tends to pay off in the long run. Newsflash here, maybe, for Morningstar but you can’t be a contrarian when you had a position that lost billions and you unwound it. That’s called just being a plain terrible investor.
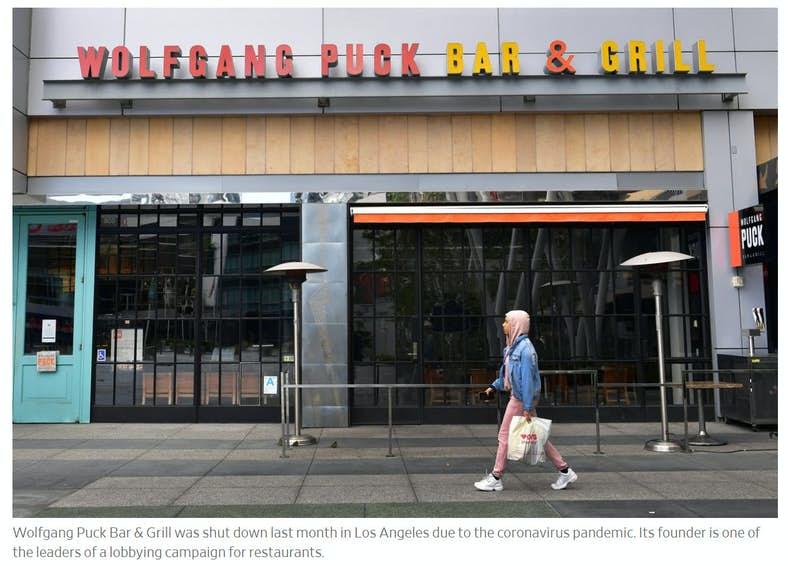
Restaurants and their allies are lobbying President Trump and Congress to press insurance companies to cover “business interruption” claims stemming from the coronavirus, even where restaurants have policies that exclude losses from pandemics.
While insurers do offer coverage, those policies are significantly more expensive than standard business-interruption policies, and few restaurants carry them, industry representatives said. But restaurants and some U.S. lawmakers say the business-shutdown orders in states and cities should constitute business interruptions under their existing policies.
Insurers are pushing back hard with the help of some Republican senators and conservative groups, saying retroactive changes to coverage policies and threats of lawsuits from restaurants could undermine the nation’s insurance system.
“Big” Bedfellows
Cheatsheet reports Celebrity chef Wolfgang Puck has joined fellow renowned chefs Thomas Keller, Daniel Boulud, Jean-Georges Vongerichten, and Dominique Crenn to form BIG, (Business Interruption Group), a new national legal, political, and communications campaign launched in partnership with an industry-savvy insurance attorney.
The group has spoken by phone to President Trump for his assistance in communicating with insurance companies, who have, for the most part, denied restaurants assistance during the pandemic. Specifically, they are requesting the U.S. president to step in on their behalf. And it looks like Mr. Trump is sympathetic.
Puck said, “We were encouraged by our conversation with the president about the urgent need to help the restaurant industry. All of us paid business interruption insurance for years to protect the livelihood of our employees. If the restaurant industry collapses, it has a massive effect on the entire economy. . .”
Understanding the Legal Battle
Those with no business interruption policy have no claim.
Restaurants that do have business interruption policies ought to be covered unless the policy specifically excludes pandemics.
Policies cannot be changed after the fact by Congress or anyone else, except by universal agreement of all of those who the policy covers.
The disagreement is whether the shutdown is pandemic-related or government-related.
Lobbyists have taken sides.
I believe this should be up to a court of law with the decision depending on specific policy language.
It should not be up to Congress to interpret law, nor to make businesses whole for those companies with inadequate insurance, nor insurance companies who go burnt by offering pandemic insurance.
SBA Exposes Private Information Of 8,000 Small Businesses In ‘Accidental’ Website Leak
Never forget that the government is one giant DMV (it’s one of many reasons why so many millions of Americans are wary of universal health care).
Minutes ago, CNBC reported that the private and “personally identifiable information” of as many as 8,000 small business loan applicants may have been leaked during the chaotic rollout of the federal paycheck protection program – or ‘PPP’.
CNBC’s Kate Rogers said the issues arose on the SBA side via the EIDL application process. The nearly 8,000 businesses impacted by the leak have been notified, per the SBA. The ‘impacted portion’ of the site was “immediately disabled.”
We’ve learned of some new issues with the SBA’s #EIDL application process:
-The SBA has notified nearly 8K businesses that their information may have been potentially exposed to other businesses in the application portal
– SBA immediately disabled the impacted portion of the site
Sr. Admin official adds:
-the issue has been addressed, application portal relaunched
-Businesses notified and offered a year of free credit monitoring
-Discovery was made March 25th
-This impacts EIDL ONLY, not PPP #EIDLhttps://t.co/UxkcborvtW
The leak was purportedly a problem with the website – meaning it was very likely self-inflicted. Not exactly a vote of confidence in the federal government’s ability to manage the task of handing out hundreds of billions of dollars of loans to every beauty salon, restaurant and pro shop in the country (plus thousands of other businesses).
Morgan Stanley’s Oracle Turns Bearish Again: “Stocks Are Now Overbought… A Correction Will Begin Soon”
For much of 2019, Morgan Stanley’s chief equity strategist Michael Wilson issued a weekly sermon of fire and brimstone in his Monday Morning market takes, which contrasted with the generally euphoric pronouncements by his peers at other banks – most notably Goldman, which in December hilariously declared that the US economy is “structurally less recession-prone today” (oops) earning him the moniker of Wall Street’s biggest bear (a few permabearish exceptions such as Albert Edwards were excluded from the tally), not to mention quite a few angry clients.
But then, in November, just as the melt up phase of the post “Not QE” market was kicking in sending stocks to all time highs every single day, Wilson got the proverbial tap on the shoulder and threw in the towel raising his S&P “bull case” price target to 3,250, however not without a slew of warnings that the most likely outcome was another retest in stocks lower.
In retrospect, Wilson should have held fast to his bearish conviction as the unprecedented March market crisis confirmed he was spot on (even if for different reasons).
Yet even then Wilson made it clear he had been on the fence, and was only forced into the bullish camp due to the the aggressive central bank intervention launched in late 2019. Little did he know what was coming, and that’s also why when most of his formerly uber-bullish colleagues were issuing one downgrade after another, Wilson threw all caution to the wind and officially became the biggest Wall Street bull shortly after the March 23 lows, when just a few days later he said that “we are buyers of dips” and recommending that – because most stocks have been in a bear market for two years or longer (most stocks except for the Top 5 that techs that matter) investors should “start buying stocks now because we cannot be sure if the next pull back will lead to lowers lows or not given we already experienced forced liquidation. Bottom line, we believe 2400-2600 on the S&P 500 will prove to be very good entry points for those with a time horizon of 6-12 months.“
This time Wilson timed his call almost perfectly, with the S&P surging since his bullish reversal, with his declaration that 2400-2600 in the S&P will be a market floor so far proving correct.
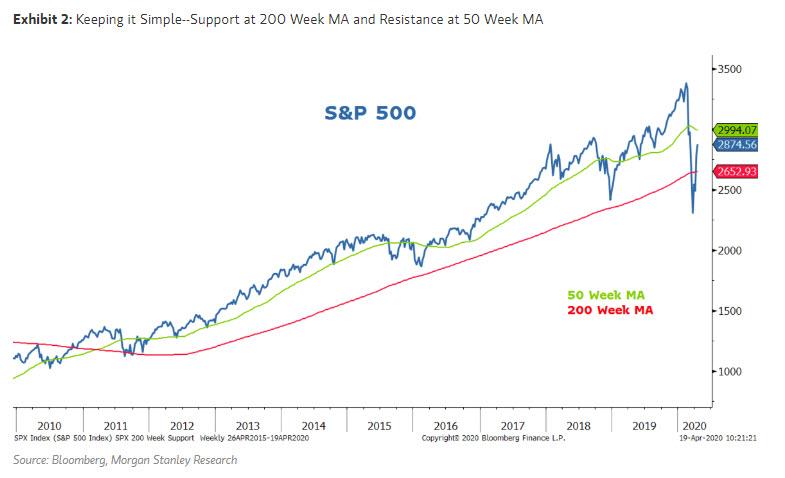
But with stocks having soared to just shy of 2,900 last week, is Wilson still bullish? According to his latest note, the answer is “not any more” and in fact he is now expecting a sharp pullback, to wit “with risk assets now overbought, the chance for a correction has increased.” In S&P 500 terms, Wilson sees stocks as continuing to trade in a range between 2,600 and 300, noting that the S&P “will find strong support at the 200 week moving average, or 2650″ and should markets continue to look through the near term bad news on earning, “it should face resistance at the 50 week moving average, or 2995.”
Here are some more details that justify Wilson’s latest U-turn:
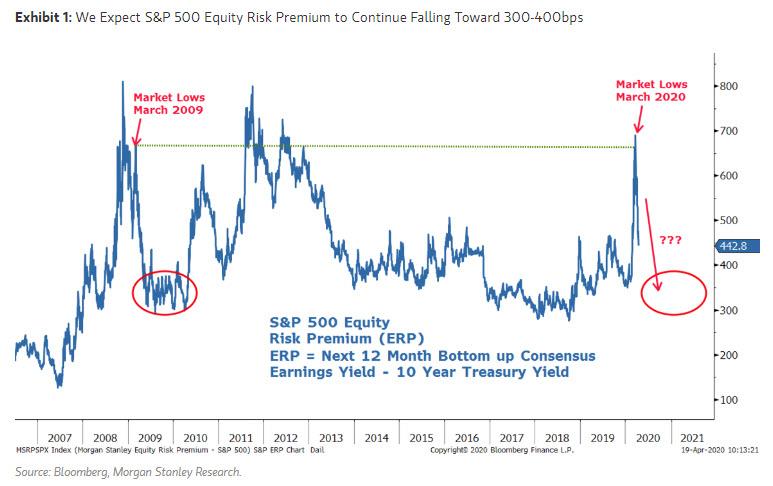
Our over arching view continues to be that the equity market bottomed in March on what amounted to a forced liquidation. The monetary policy response has been effective in stabilizing credit spreads and equity risk premiums which reached the same level observed at the lows of the Great Financial Crisis in March, 2009 (Exhibit 1). Therefore, it is unlikely we will approach such levels again any time soon. Meanwhile, fiscal programs appear to be getting the money to their desired destinations after a slow start which should support both consumers and small businesses until the economy can get reopened. In fact, the PPP program has already run out of money with increases now being debated in Washington.
And so, with many risk assets now overbought, Wilson says he would “not be surprised if a correction in US equities begins soon.” The reasons for this are that in addition to what is likely to be a partisan debate on more fiscal stimulus, the MS strategist expects more bad news from companies on earnings results as well as their outlooks for 2020.
As previously stated, the market is looking past this year as a write off and is trying to calculate what 2021 will look like, in some cases pricing earnings off of 2022 forecasts which, as we have said previously, will be dead wrong. Wilson agrees with our skepticism, saying that while 2021 will likely be better than 2020 (unless a depression has begun in which case it won’t “it’s also hard to have much precision or confidence about the magnitude of the snap back we should expect.”
Wilson also suspects that company guidance will portray similar uncertainty which could weigh on asset prices over the next few weeks. Furthermore, that uncertainty should weigh greatest on those stocks which are still under-discounting the magnitude of the declines in 2020. In short, ‘high expectation’ stocks are the most vulnerable to a near term correction. And, as noted above, Wilson expects the index to find very strong support at the 200 week moving average, or 2650. Likewise, should markets continue to look through the near term bad news, it should face resistance at the 50 week moving average, or 2995.
The accumulating death toll from Covid-19 can be seen minute-by-minute on cable news channels. But there’s another death toll few seem to care much about: the number of poverty-related deaths being set in motion by deliberately plunging millions of Americans into poverty and despair.
In the first three weeks since governors began shutting down commerce in their states, 17 million Americans filed for unemployment, and according to one survey, one quarter of Americans have lost their jobs or watched their paychecks cut.Goldman Sachs predicts that the economy will shrink 34 percent in the second quarter, with unemployment leaping to 15 percent.
Until the Covid-19 economic shut-down, the poverty rate in the United States had dropped to its lowest in 17 years. What does that mean for public health? A 2011 Columbia University study funded by the National Institutes of Health estimated that 4.5 percent of all deaths in the United States are related to poverty. Over the last four years, 2.47 million Americans had been lifted out of that condition, meaning 7,700 fewer poverty-related deaths each year.
It’s a good bet these gains have been completely wiped out, and it’s anyone’s guess how many tens of millions of Americans will have been pushed below the poverty line as governments destroy their livelihoods. It’s also a good bet the resulting deaths won’t get the same attention.
And that doesn’t count an unknown number of Americans whose medical appointments have been postponed indefinitely while hospitals keep beds open for Covid-19 patients.
How many of the 1.8 million new cancers each year in the United States will go undetected for months because routine screenings and appointments have been postponed? How many heart, kidney, liver, and pulmonary illnesses will fester while people’s lives are on hold? How many suicides or domestic homicides will occur as families watch their livelihoods evaporate before their eyes? How many drug and alcohol deaths can we expect as Americans stew in their homes under police-enforced indefinite home detention orders? How many new cases of obesity-related diabetes and heart disease will emerge as Americans are banished from outdoor recreation and instead spend their idle days within a few steps of the refrigerator?
I have participated in many discussions among top policymakers in Congress and the Administration over the last few weeks. Such considerations are rarely raised and always ignored. Instead, policymakers fixate on epidemiological models that have already been dramatically disproven by actual data.
On March 30, Drs. Deborah Birx and Anthony Fauci gave their best-case projection that between 100,000 and 200,000 Americans will perish of Covid-19 “if we do things almost perfectly.” As appalling as their prediction seems, it is a far cry from the 200,000 to 1.7 million deaths the CDC projected in the United States just a few weeks before. And even their down-sized predictions look increasingly exaggerated as we see actual data.
Sometimes the experts are just wrong. In 2014, the CDC projected up to 1.4 million infections from African Ebola. There were 28,000.
Life is precious and every death is a tragedy. Yet last year, 38,800 Americans died in automobile accidents and no one has suggested saving all those lives by forbidding people from driving – though surely we could.
In 1957, the Asian flu pandemic killed 116,000 Americans, the equivalent of 220,000 in today’s population. The Eisenhower generation didn’t strip grocery shelves of toilet paper, confine the entire population to their homes or lay waste to the economy. They coped and got through. Today we remember Sputnik – but not the Asian flu.
It’s fair to ask how many of those lives might have been saved then by the extreme measures taken today. The fact that the Covid-19 mortality curves show little difference between the governments that have ravaged their economies and those that haven’t, suggests not many.
The medical experts who are advising us are doing their jobs – to warn us of possible dangers and what actions we can take to mitigate and manage them. The job of policymakers is to weigh those recommendations against the costs and benefits they impose. Medicine’s highest maxim offers good advice to policymakers: Primum non nocere — first, do no harm.
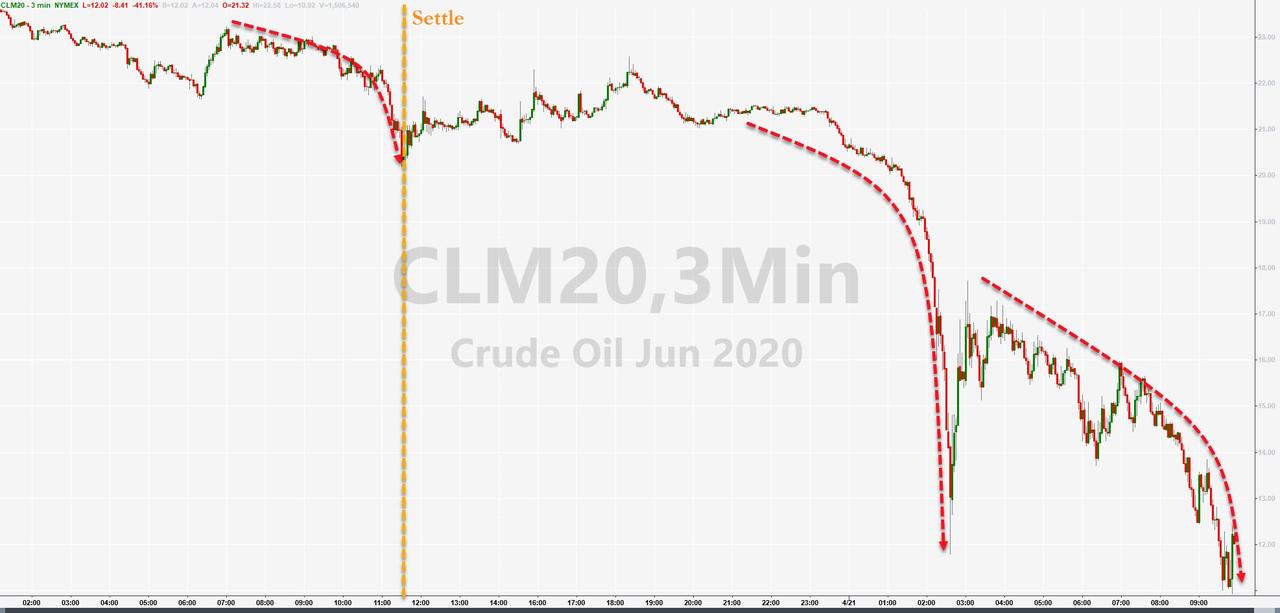
June WTI Futures Crash 45% To $10 Handle In Repeat Of Monday Massacre
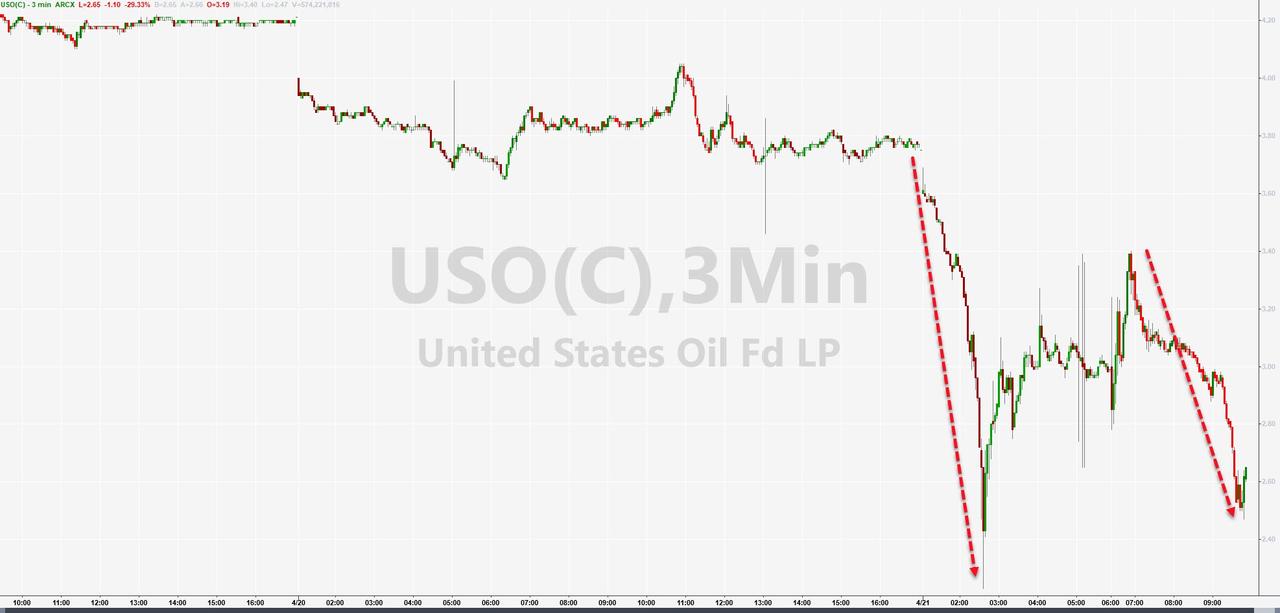
Forget Turnaround Tuesday, paper oil markets are collapsing once again with USO halted numerous times, OIL liquidated, and June futures puking hard in a repeat of yesterday’s May contract bloodbath…
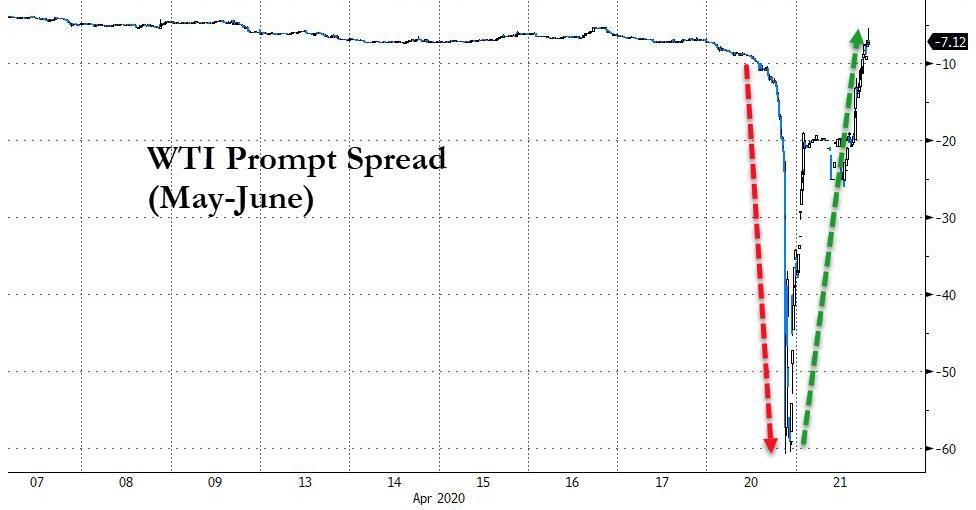
May is rallying here as June crashes… (we suspect more ETF rolls)…
Sending the prompt spread soaring back…
But June is now down a shocking 45% to a $10 handle… and there is still 90 minutes until settlement.
Yesterday, the break of $10 was what sparked the waterfall in the May contract.
USO is down 30%…
Here are five analysts’ views on what’s happening in the world’s largest oil ETF…
Dave Lutz, macro strategist at JonesTrading:
“Retail investors should have a way to trade the price of oil, but USO has such problems with the roll effect that I’m not sure that’s the best vehicle. Problem is, it’s really the only one,” he said. In addition, “the fact that creations are suspended means that this is no longer going to track properly.”
Joseph Saluzzi, Themis Trading LLC partner and co-head of equity trading:
“Some ETFs are not exactly what you think they are — the rule for any investor is to know what you own. Some folks may have thought that USO was simply a proxy for the current oil price, and they didn’t really understand the mechanics of the oil futures market.”
Matt Maley, equity strategist at Miller Tabak + Co.:
“There is no question that this is a tool for investors of all sizes to bet on the price of oil. Many of these investors — again, of all sizes — have tried to pick the bottom in oil several times over the past week or two and they’ve all gotten burned. This has caused these buyers on weakness to become forced sellers. When the dust settles, it’s going to create an unbelievable opportunity for buyers. Until we get a better feeling of when the demand side of the supply/demand equation is going to improve, it tells me that the risks are still much too high compared to the potential rewards,” said Maley.
“I worry that it’s going to have a negative impact on liquidity in the oil markets, and thus have a negative impact on confidence in that market.”
Jeremy Senderowicz, a partner at law firm Dechert:
“Once creations are suspended then the arbitrage process cannot work as normal, as new shares cannot be created to meet increased demand,” he said.
“The 8-K says they are suspending creations because they’ve used up all the shares they’ve registered (they filed yesterday to register more shares but the SEC needs to declare it effective and they haven’t done so yet). That indicates that demand for the shares was quite high. If that demand continues, then until new shares can be created you can fill in the blank as to what might happen in trading…(which may be why they had the trading halt). That seems like the big takeaway to me.”
Dan Genter, CEO of RNC Genter Capital Management:
“The ETFs that are dealing with the contracts in the commodities are never going to take physical delivery, they can’t take it. There’s not a doubt the oil ETFs distorted the market. It was across the board but the ETFs, in our opinion, were the biggest problem,” he said. “The panic is because there are people invested in that commodity and in the contracts that not only have no intention of taking delivery, they have no capacity for taking delivery. All of a sudden, you’re up against a wall. They call it a contract for a reason.”
But, don;t worry, because President Trump will take the pain way… right?
In early March, before the impact of the COVID-19 was fully understood, I penned an article suggesting that both corporate profits and S&P 500 earnings were suggesting the “bear market wasn’t over.” To wit:
“Profit margins are probably the most mean-reverting series in finance, and if profit margins do not mean-revert, then something has gone badly wrong with capitalism. If high profits do not attract competition, there is something wrong with the system, and it is not functioning properly.” – Jeremy Grantham
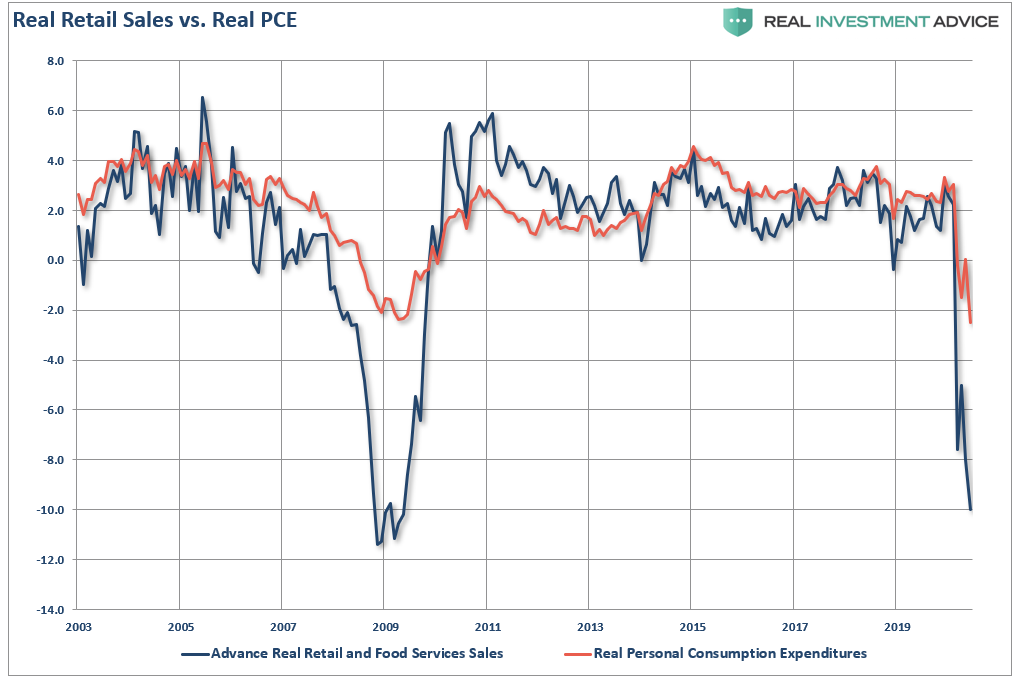
At that time, the impending recession, and consumption freeze, was only starting and we had no data to suggest just how bad it was going to get. Since then, we have had epic declines in manufacturing, surging unemployment, and plunging retail sales. To wit:
“From the decline of 8.7% in retail sales, 40% of PCE, we can extrapolate the decline into expectations for PCE growth. Again, since PCE comprises almost 70% of the economy, this is why expectations are for a drop of 10%, or more, in GDP in the second quarter.”
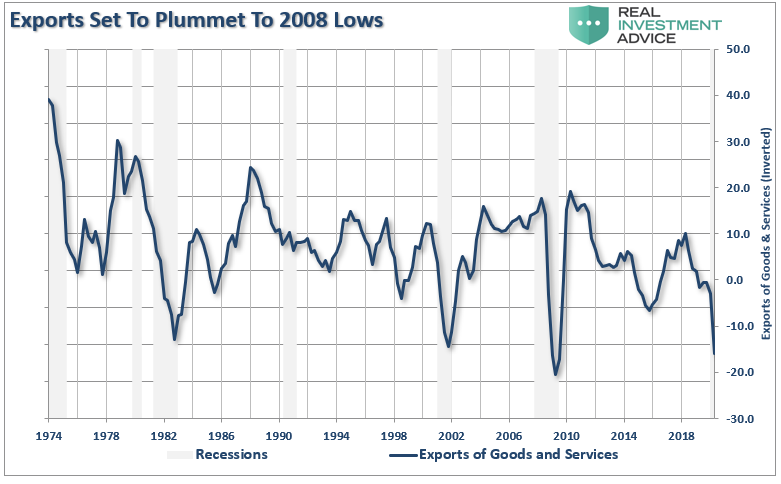
But it isn’t just retail sales. It is also exports which account for about 40% of corporate profits overall, which are seen sliding dramatically in March.
This all suggests dramatically lower corporate profits and earnings per share for the S&P 500 index.
Earnings Estimates Still Too High
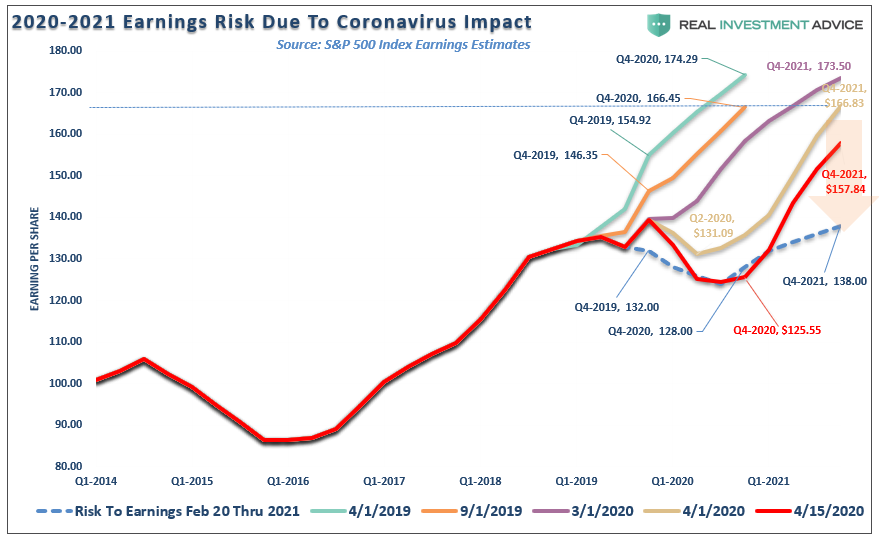
In “Reward Doesn’t Justify The Risk,”I noted that while estimates have indeed been lowered by Standard & Poors (latest update was April 19th), the earnings revisions are a long way from reflecting what earnings will look like over the next couple of quarters.
“To analyze the reality of current expectations, we need to review the history of the estimates for the S&P 500 from when 2021 estimates were first published by Standard & Poors in April 2019. The chart shows the progression in estimates April to September 2019, and March and April of 2020. (The dotted blue line is my original, unrevised estimate of the impact to earnings in February of this year.)”
(NOTE: Chart has been updated to include the last update to estimates.)
Importantly, note that Standard & Poors finally caught up with our original estimate from February for the second and third quarters. However, as I stated at that time, “my estimates are likely overly optimistic” as the virus was still a relatively unknown and unaccounted for threat.
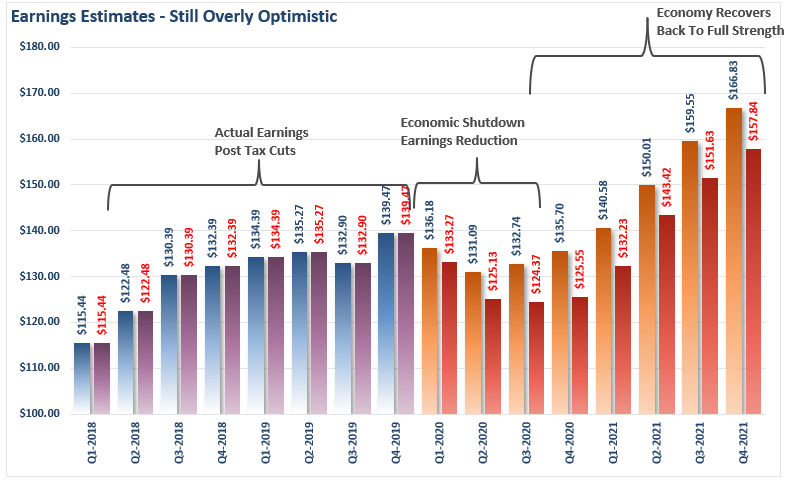
More importantly, the chart below shows the comparison of the original, and latest estimates for April. In our first analysis, earnings were expected to decline from Q4-2019 levels of $139.47 to $136.18 and $131.09, respectively in Q1 and Q2 of 2020. That is a decline of -2.3% in Q1 and a total decline of -6% in Q2.
Those numbers have now been revised for a decline of -4.4% in Q1, and a total decline of 10.2% in Q2.
So, with the entire U.S. economy shut down, 15-20% unemployment, and -20% GDP, earnings are only expected to decline by 10%?
History suggests this is not likely to be the case.
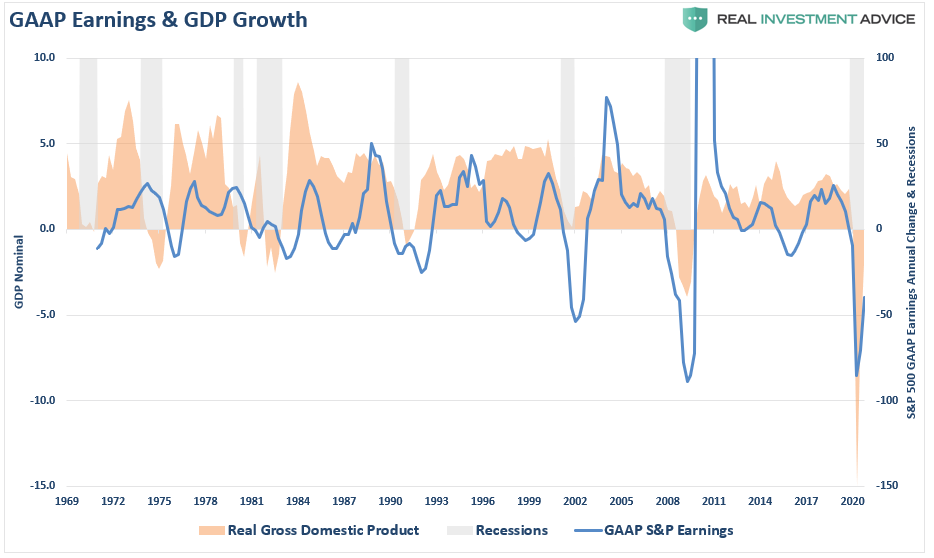
First, let’s review GAAP Earnings (actual real earnings) as compared to GDP. Not surprisingly, since “stocks are not the economy,” there is a higher correlation between economic growth and corporate earnings. This is because, without economic growth, consumers don’t have paychecks with which to consume, which is where corporate earnings are derived from.
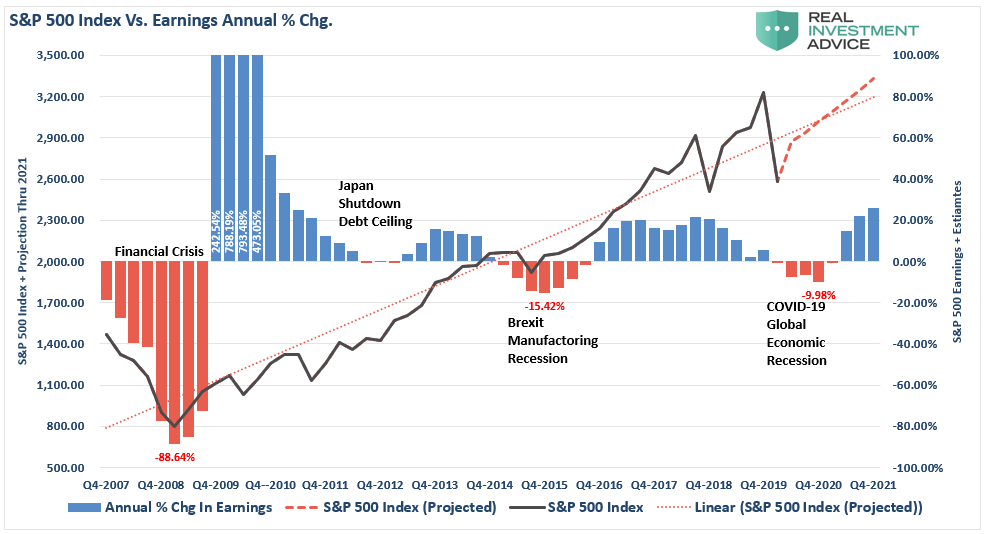
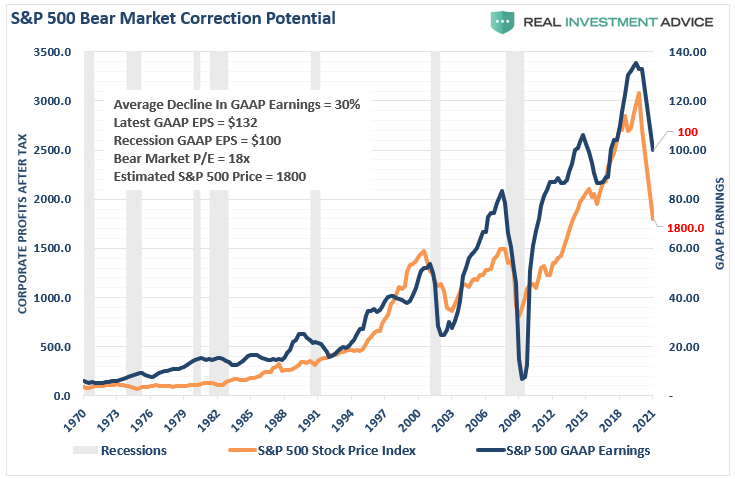
Assuming a 15% decline in GDP (some estimates run as high as 30%), the suggestion of only a 10% decline in earnings seems laughable. The chart below looks at S&P’s estimates (as reported) going back to 2008, versus the S&P 500, and expectations for a “V-sharped” market recovery.
In 2008, during the “Financial crisis,”which did NOT shut down the economy, the annual change in earnings fell by 89%. Even during the Brexit/Manufacturing recession of 2015-2016, earnings fell by 15%.
Again I ask you, “Does it seem realistic that with a decline in economic growth not seen since the “Depression,” earnings would only decline by 10%?”
But if you are chasing the market currently, this is what you are “buying into.”
Valuations Are An Issue
“I would say basically we’re like the captain of a ship when the worst typhoon that’s ever happened comes. We just want to get through the typhoon, and we’d rather come out of it with a whole lot of liquidity. We’re not playing, ‘Oh goody, goody, everything’s going to hell, let’s plunge 100% of the reserves [into buying businesses].’
Nobody in America’s ever seen anything else like this. This thing is different. Everybody talks as if they know what’s going to happen, and nobody knows what’s going to happen.” – Charlie Munger.
I quoted Charlie in this past weekend’s newsletter as it is the basis of our views on capital preservation and risk management.
“While it may seem silly, we believe the process of investing is not about ‘guessing,’ but rather ‘knowing,’ what you are buying.”
Currently, the “race to chase the bottom” has gotten investors to once again vastly overpay for assets which portends poor future returns. More importantly, they have jumped into “buying risk,” at a point where that “risk,” or rather the opportunity to lose capital, can not be calculated.
But if you think I am overly bearish on my estimates, I assure you I am not.
“Credit Suisse, JPMorgan and Goldman all point out the schizophrenia in being bullish in a time when corporate profits are set for the biggest – and longest – drop since the Great Depression, late last week two more banks joined the bandwagon with Citi warning that ‘equities fall the same as EPS in a recession… and reflect that equity markets are currently not reflecting the expected decline of 50% in global EPS in 2020.” – Zerohedge
If any of these numbers come to fruition, which there is more than a decent probability they will, then investors are currently paying higher valuations now than they were at the peak of the market in February.
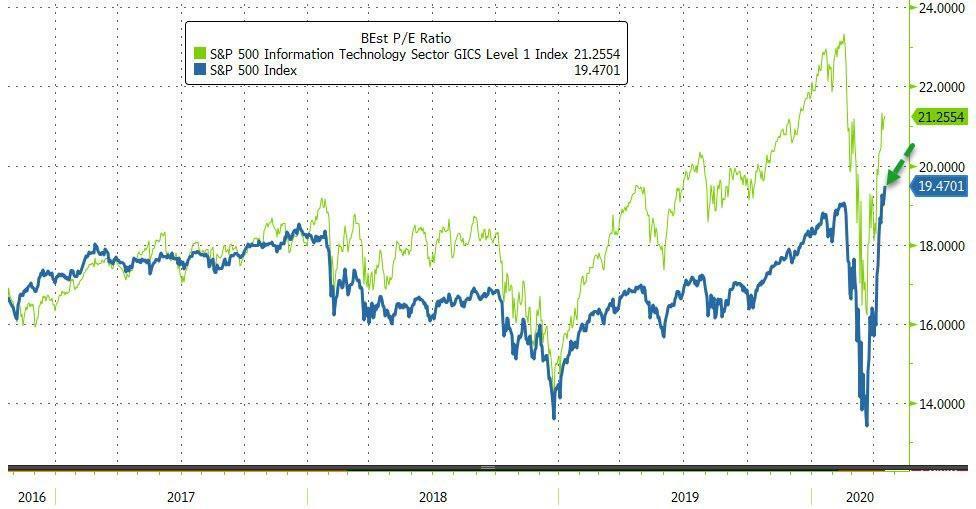
“Bank of America’s Savita Subramanian has also done the math and concludes that as ‘stocks have rallied, bottom-up consensus estimates for 2020 have fallen’, which in turn has pushed the S&P 500’s forward P/E ratio from March’s low of 13.0x to 19.5x, higher than mid-Feb’s peak P/E of 18.9x.” – Zerohedge
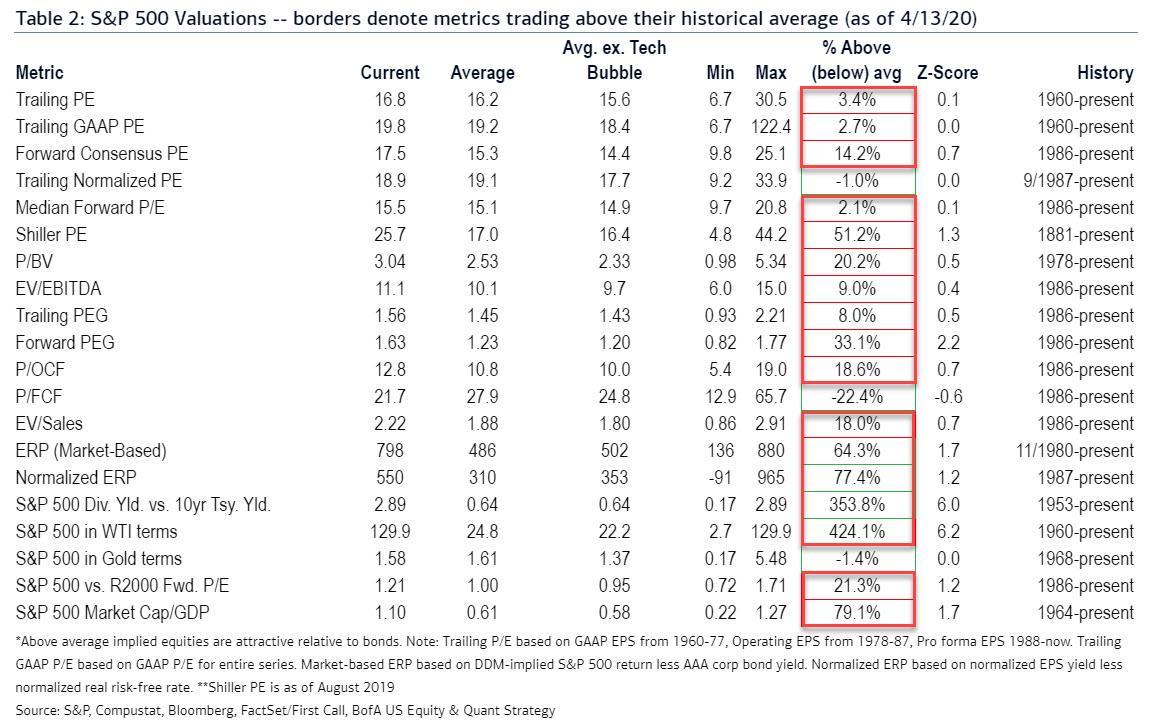
Using BofA’s valuation table of 20 different metrics, it is hard to suggest that buying stocks today will have a positive outcome over the next few years, much less the next few months.
Importantly, this isn’t “bullish” or “bearish,” this is just math.
The Bear Market Isn’t Over
“The smoothed CAPE multiple at 25.9x in April — expanding from 24.9x in March! — which compares with 24.0x in January 2008, the first month of the Great Recession twelve years ago. We had a 26.0x multiple on our hands, as an example, back at the end of 2015. You see, that is a multiple you can pay if you are assured that the economy will be expanding, as it did then and the next year at a 2% pace. But that is not the case today. And you can’t simply say ignore 2020 earnings so conveniently when the hole future profits trajectory has been semi-permanently impaired.
We are into an epic 40% down quarter on GDP and with no visibility, which is why a growing list of firms are pulling their guidance. The CAPE multiple peaked in January at 31.0x, shrunk to 24.9x in March, and is back to 25.9x. Let me just say, for the record, that we have never seen a bear market end with a smoothed P/E multiple as rich as 24.9x — the highest trough multiple was 21.2x back in that 2000-2003 tech wreck bear market. The average trough in the 8-recessionary bear markets back to 1960 is 12.8x and the median is 13.5x.” – David Rosenberg
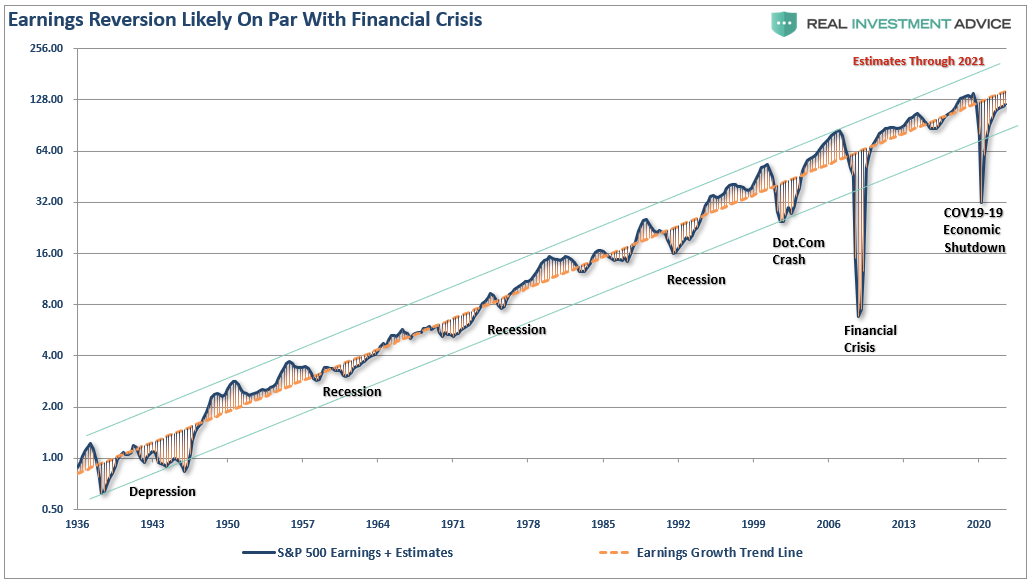
Throughout history, earnings are very predictable. Using the analysis above, we can “guesstimate” the decline in earnings, as well as the potential decline in stock prices to align valuations. The chart below is the long-term log trend of earnings versus its exponential growth trend.
In early March, as the viral impact was just setting in, we made an early assumption of the impact on earnings. Needless to say, we were overly optimistic. To wit:
“Using that historical context, we can project a recession will reduce earnings to roughly 100/share. The resulting decline asset prices to revert valuations to a level of 18x (still high) trailing earnings would suggest a level of $1800 for the S&P 500 index.”
Again, I am not “overly dramatic” or “super bearish.” I am also not saying the index is going to 1800.
What I am saying is there is a good bit of data to support the thesis that a much larger earnings decline is in process, and markets will have to adjust to bring valuations in line with earnings.
That is just how markets work both with, and without, the Fed.
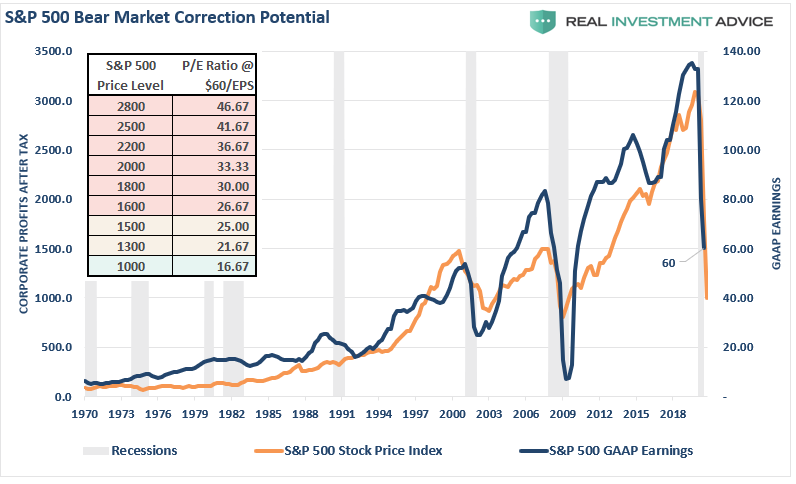
However, given the horrific data we now have coming in, we already know our previous estimates of $100/share were too high. A more realistic, and still overly optimistic of a 50-60% decline in earnings, makes current valuations even more difficult to support. (Using the chart and table below, you can pick your price and valuation level.)
Whether its corporate profits, earnings, or GDP, no matter how you analyze the data, it suggests the outlook for stocks going into the summer is not favorable.
While it certainly seems to be a simple formula that as long as the Fed remains active in supporting asset prices, the deviation between fundamentals and fantasy doesn’t matter. It has been a hard point to argue as of late..
However, what has started, and has yet to complete, is the historical “mean reversion” process which has always followed bull markets. This should not be a surprise to anyone, as asset prices eventually reflect the underlying reality of corporate profitability and earnings.
“Fed Can’t Print Gold”: BofA Calls Gold “Ultimate Store Of Value”, Raises Price Target To $3,000
Back in April 2011, just before gold exploded to a record above $1,900 following the US credit rating downgrade, we first said – and Kyle Bass echoed – that the main reason behind our long-running, bullish view on gold is that the Fed can’t print gold , unlike every other asset.
Today, with a 9 year delay, Bank of America has caught up with where we were at the start of the decade, and repeating virtually everything we have said – consistently each day for over 11 years – says that while “the size of major central bank balance sheets has been stable at 21 to 28% of GDP in the past decade just like the gold price” things are changing rapidly and “as central banks & governments double their balance sheets & fiscal deficits we up our 18m gold target from $2000 to $3000/oz.” And while it’s not all smooth sailing, with the bank warning that “a strong USD backdrop, falling equity market volatility, and weak jewelry demand in India & China may remain headwinds”, it is now clear that even Wall Street’s agenda is aligned with that of all those who have been calling that the biggest beneficiary of central bank lunacy will be the “barbarous relic”, one which according to the most clueless person of the 21st century only had value because it was “tradition.” And yet here we are, when one of the biggest US banks just said that gold is the “ultimate store of value.“
Who to believe: a pathological liar (i.e., a central banker) or someone who finally sees the light?
Incidentally, the name of the BofA report was “The Fed can’t print gold”, which was a delightful flashback to what we said some nine years ago.
Here are the key highlights from the report:
Gold prices have performed well in the recent period
As the ultimate store of value, gold prices have performed well during the past 15 months, posting a rally of over 10% since the Federal Reserve did a monetary policy U-turn in January 2019. Gold has also delivered a strong performance against other asset classes YTD. Of course, it has not been a straight line up, and gold did sell off hard for a brief period in March. The swing in gold prices mirrored the down and then up move in real interest rates. Now our CTA models suggest gold positioning is light, likely because of the spike in volatility and the mechanical drop in the gold Sharpe ratio. But this constraint could change as volatility keeps falling quickly across financial markets.
Now, significant monetary, fiscal easing around the world…
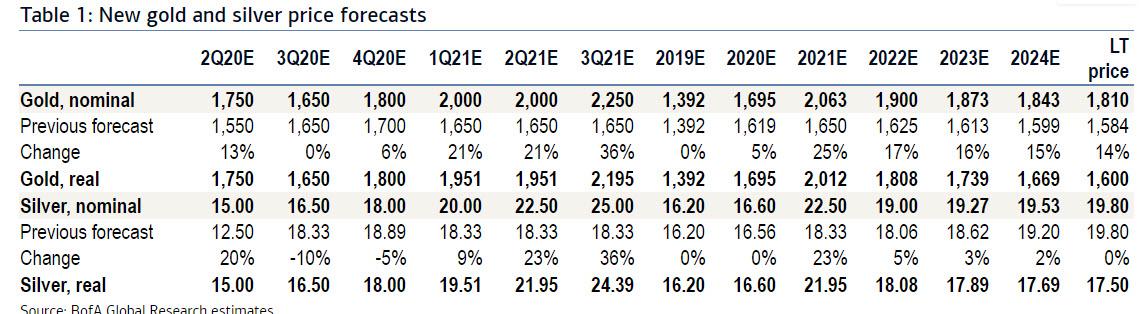
Due to the Covid-19 lockdowns, US GDP could go down by 30% YoY in 2Q20, the steepest drop in modern history. Other countries like Japan will likely experience a 21.8% decline in output in 2Q20, while China just reported a contraction of 6.8% in 1Q20. As central banks rush to expand their balance sheets and backstop asset values and consumer prices, a lot of risks could end up being socialized. The size of major central bank balance sheets has been stable at around 25% of GDP for the last decade or so, just like the gold price. As economic output contracts sharply, fiscal outlays surge, and central bank balance sheets double, fiat currencies could come under pressure. And investors will aim for gold. Hence, we mark-to-market our forecasts and now project an average gold price of $1,695/oz in 2020 and $2,063/oz in 2021.
…lifts our 18m gold target from $2000/oz to $3000/oz
True, a strong USD backdrop, reduced financial market volatility, and lower jewelry demand in India and China could remain headwinds for gold. But beyond traditional gold supply and demand fundamentals, financial repression is back on an extraordinary scale. Rates in the US and most G-10 economies will likely be at or below zero for a very long period of time as central banks attempt to push inflation back above their targets. Beyond real rates, variables such as nominal GDP, central bank balance sheets, or official gold reserves will remain the key determinants of gold prices, in our view. As central banks and governments double their balance sheets and fiscal deficits respectively, we have also decided to up our 18m gold target from $2,000 to $3,000/oz.
And with that let’s dig deeper into “The Fed can’t print gold” and why BofA thinks that gold will have a 3-handle in 18 months time:
Gold prices have performed well during the recent period…
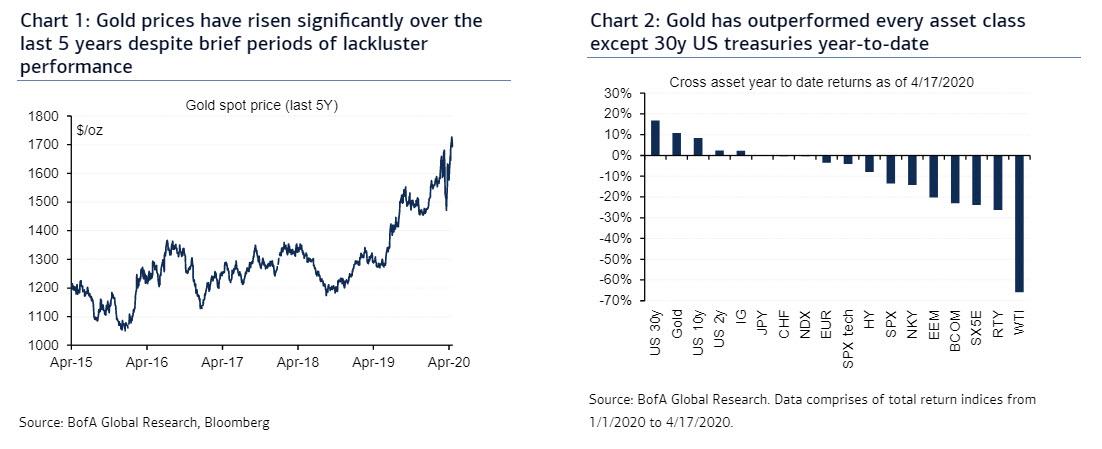
As the ultimate store of value, gold prices have performed well during the past 15 months, posting a rally of 12% since the Federal Reserve did a monetary policy U-turn in January 2019 (Chart 1). More recently, gold prices have continued to post a robust run, with returns broadly outpacing other major asset classes year-to-date (Chart 2). Only long duration bonds and high quality tech stocks have delivered comparable performance, with 30 year Treasury yields posting 16.9% and the S&P Tech Sector delivering flat returns YTD.
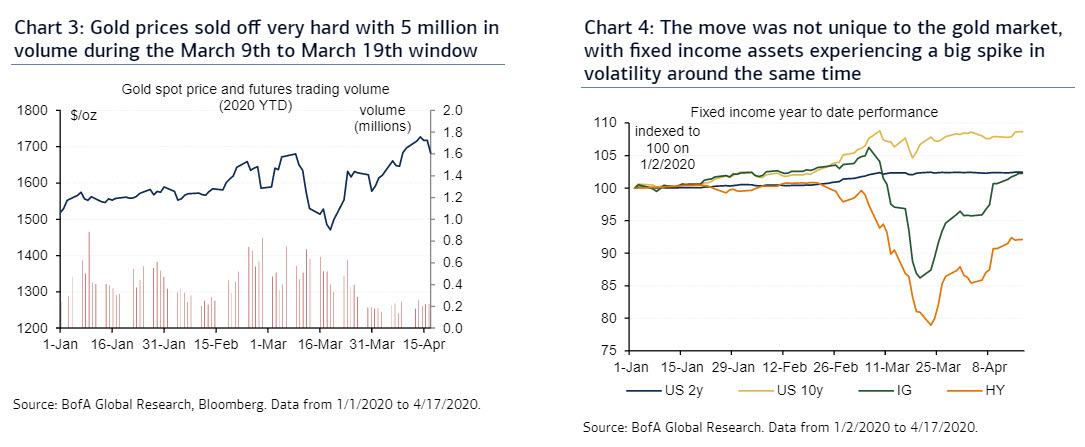
…except over a brief window where liquidation occurred
Of course, it has not been a straight line up for the yellow metal. In fact, gold prices sold off very hard with close to 5 million futures trading volume during the March 9th to March 19th window (Chart 3) on the back of a major liquidity crunch. The move was not unique to the gold market, with fixed income assets also experiencing a big spike in volatility around that time (Chart 4). The pre-March 19 peak to trough decline for gold was 12% compared to an 8% drop in the US Treasury Inflation Protected Securities (TIPS) ETF or a 22% decline in investment grade ETF values such as LQD.
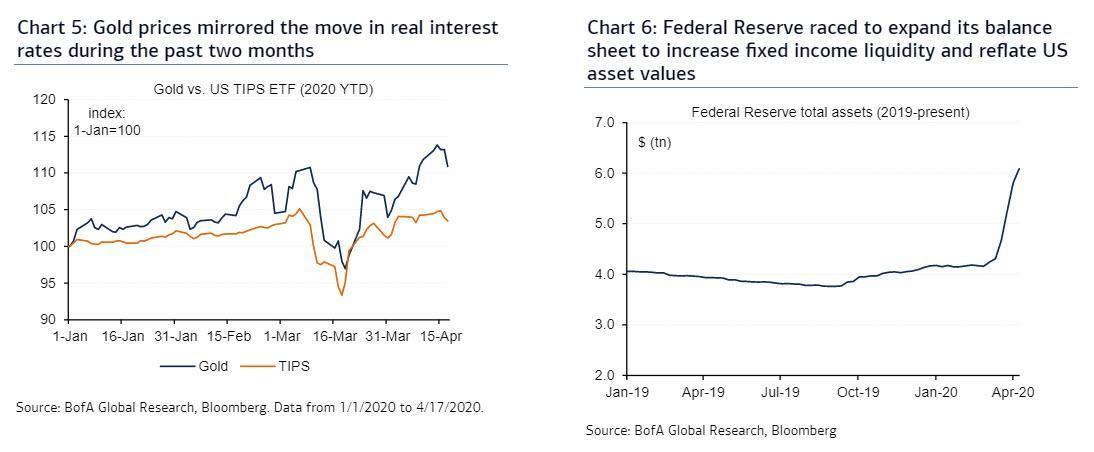
The sell-off in gold prices mirrored the move in real rates
It is worth noting too that the drop in gold prices mirrored the move in real interest rates during the past two months (Chart 5). As investors feared the extension of the China lockdown to the US and the rest of the world economy, asset values and consumer price expectations collapsed faster than nominal interest rates, triggering fears of an economic depression. Having learned the lessons of the Global Financial Crisis (GFC), the Federal Reserve raced to expand its balance sheet to increase fixed income liquidity and reflate US asset values, ultimately supporting a sharp recovery in gold prices (Chart 6).
Gold is a function on real rates, USD, commodities and risk…
As explained above, the selloff and subsequent recovery in gold prices during March was somewhat mechanical in nature. As the ultimate store of value, gold is a reflection of market movements across all major financial and physical assets. In the past we have argued that gold volatility is a function of real interest rates, USD, commodities and risk (Chart 7). Swings in these four variables alone can help explain up to 80% of variation in weekly gold price changes (Chart 8), providing an important template to understand the direction of future gold prices.
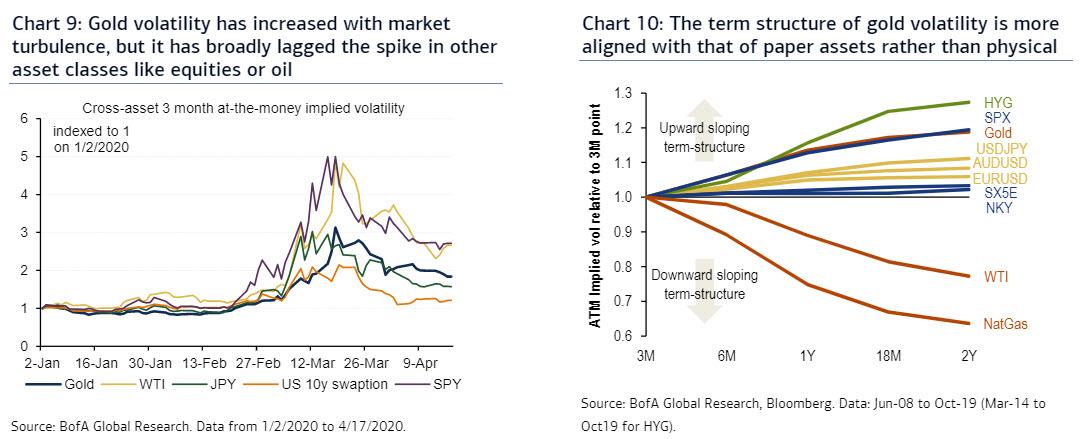
…and gold volatility tends to follow moves in other markets
Another factor to think about in precious metals is volatility. Specifically, gold volatility increased with market turbulence, but it has broadly lagged the spike in other asset classes like equities or oil (Chart 9). On our estimates, gold volatility more or less tracked G10 currency vol in the past two months, particularly mirroring perceived safe haven currencies like JPY and CHF. Unlike other commodity markets, the term structure of gold volatility is more aligned with that of paper assets (Chart 10). In contrast to oil or natural gas, gold is not constrained by storage dynamics and its price is not necessarily mean-reverting to the marginal cost of production over the long run.
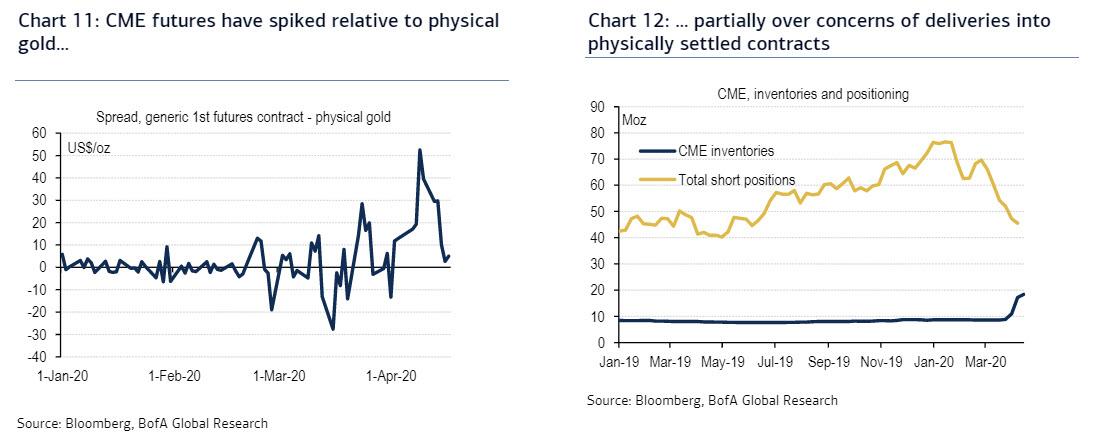
Covid-19 has also triggered physical market dislocations…
Still, the physical settlement of paper contracts means that gold has unique features compared to other perceived safe havens. In normal times, when the CME delivery mechanism functions smoothly, differences between gold futures and the physical gold market are usually quite small. Yet the margin between futures and physical prices has blown out as of late (Chart 11). In part, there have been concerns over disruptions of shipments to the US over recent travel restrictions, as the London market typically provides liquidity to New York. While futures contracts are relatively rarely held to expiry, Chart 12 shows that inventory levels in CME warehouses are well below open interest.
…leading to the launch of a new CME gold futures contract
Also, the CME contract trades in 100koz, while a London Good Delivery Bar is 400koz. This matters because around one-third of global refining capacity has been shuttered over Covid-19, which made the conversion of bars into shapes suitable for delivery into the CME challenging. Tackling these issues, CME has since launched new futures, which also accept 400oz bars. This should ultimately help alleviate liquidity concerns, although it may take some time for open interest to switch to the new contract. Beyond that, and perhaps more importantly, the Swiss refineries have been resuming operations again, while insurers now also accept charter flights to ship gold to New York, rather than just commercial connections. Not surprisingly, the differential between futures and physical gold has been narrowing.
Gold interacts with all financial markets in different ways
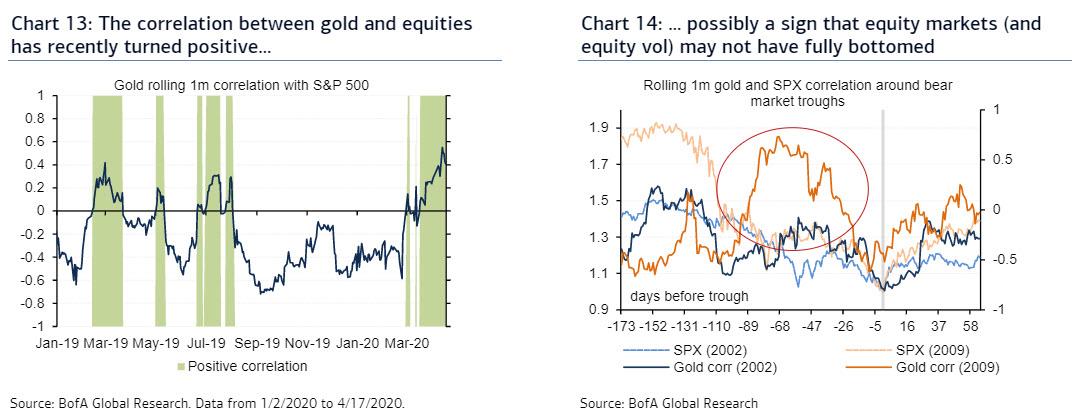
Beyond the volatility, physical and price change drivers discussed above, gold interacts with various financial markets in different ways. For instance, we recently noted that the correlation between gold and equities has recently turned positive (Chart 13). The positive equity/gold correlations are a possible sign that equity markets may not have fully bottomed (Chart 14) and that the gold market has further room to run, in our view. The trigger here could be an extension of lockdown restrictions over the next few weeks.
Despite the rally, gold positioning has been surprisingly weak
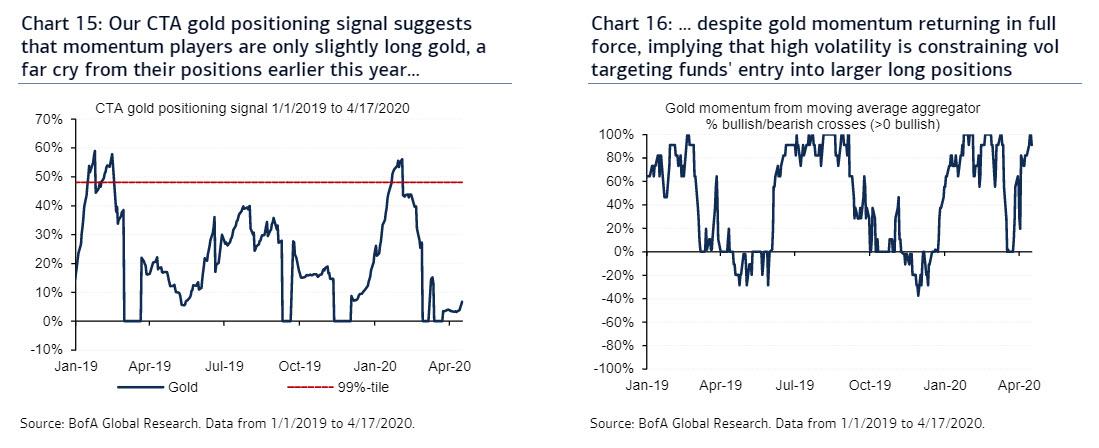
Another reason to be particularly constructive on gold is that our CTA gold positioning signal suggests that momentum players are only slightly long gold (Chart 15). Having peaked at 56% of their maximum length in the month of January, our models suggest that momentum players are currently holding 5.7% of their maximum allocations, well below the historical 99th percentile in history of 48%. While gold momentum is in full force following a brief collapse mid-March (Chart 16), our CTA model has only slowly crept into a long position due to the prevailing high volatility regime, a feature that is also likely prevalent in the broader class of vol targeting funds.
Fundamentally, EM gold demand should continue to be soft…
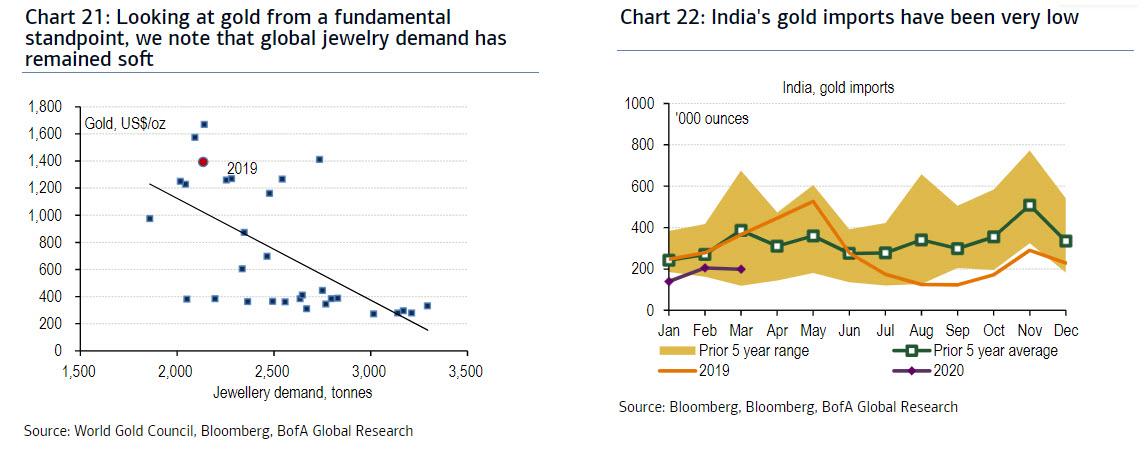
Also, jewelry demand usually declines when prices rally (Chart 21), as buyers in emerging markets like India often purchase on a budget. With jewelry often referencing spot market prices, this means that fewer ounces can be bought as gold rallies. Indeed, gold imports from India have been quite low (Chart 22), although this has also been influenced by low foot traffic in stores due to the recent lockdown over Covid-19.
…as purchasing power in India and China is suffering
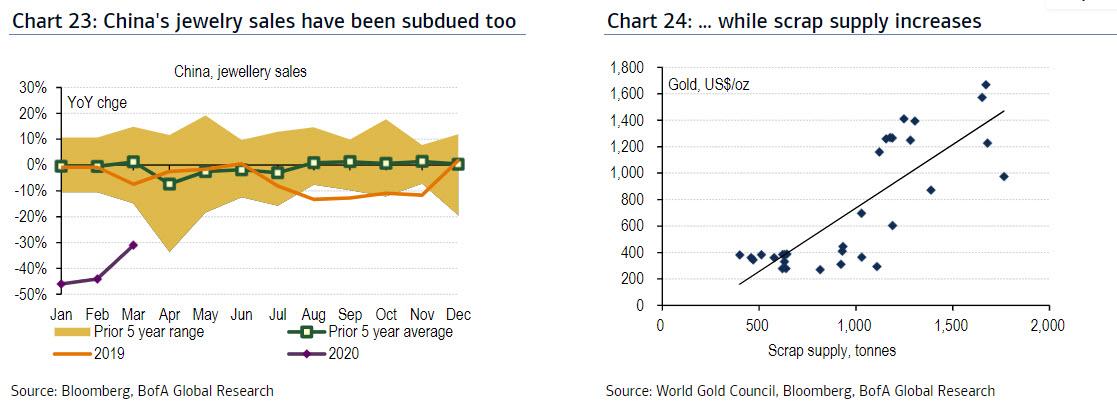
Similarly, sales of jewelry in China, the second largest physical market, have been subdued for a while, as Chart 23 suggests, on persistent headwinds to growth which have been exacerbated by the health emergency in the first quarter. Meanwhile, the scrap market correlates positively with gold quotations, with owners of old metal often incentivized to monetize the gold as prices increase (Chart 24). Of course, the dynamic in the jewelry and scrap markets highlight the importance of investors: as the yellow metal rallies, non-commercial market participants need to pick up more ounces just to keep further price upside intact.
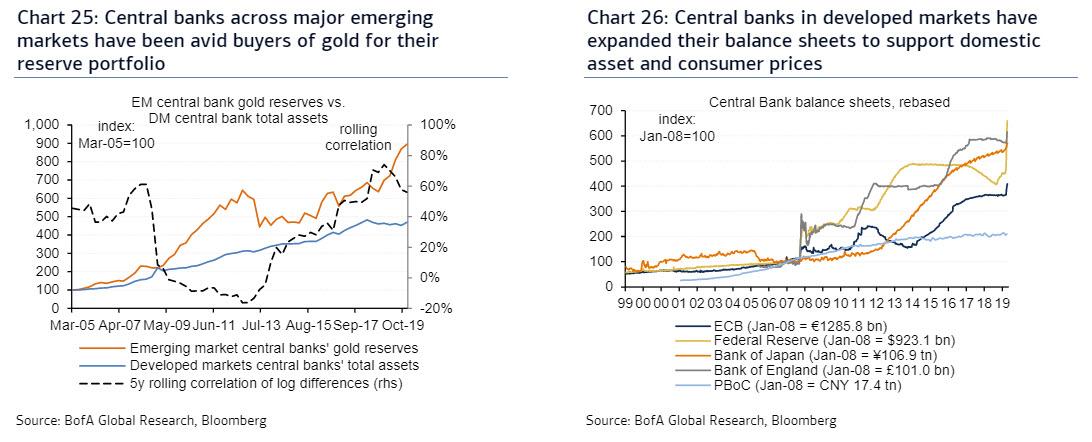
…although we expect central banks to buy some gold bars
So physical demand in traditional gold markets like jewelry looks soft and could be a drag on precious metals prices. However, central banks across major emerging markets have been avid buyers of gold for their reserve portfolio (Chart 25). As central banks in developed markets have expanded their balance sheets to support domestic asset and consumer prices (Chart 26), some EM central banks have become more proactive buyers of precious metals. In particular, Russia, China and India have opted to increase gold holdings in the past 5 years to diversify away from G-10 sovereign bond positions.
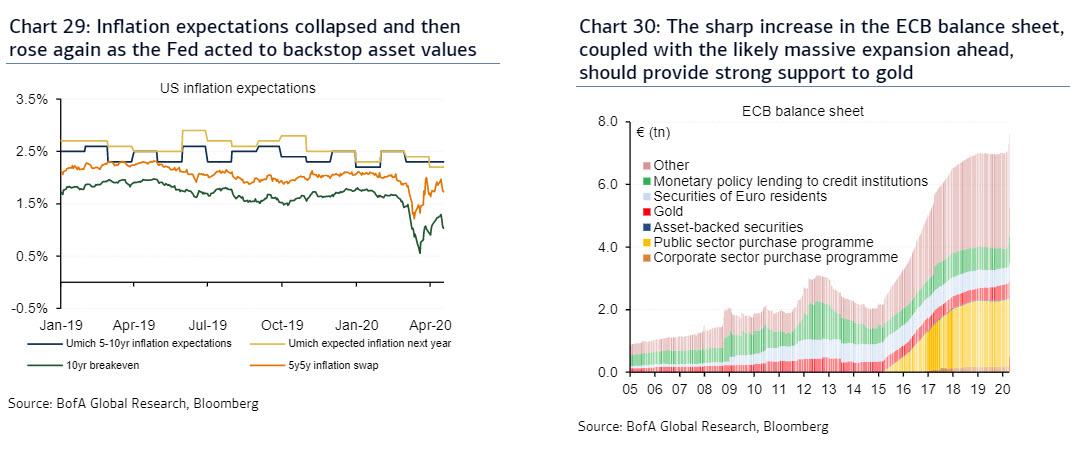
Gold may take comfort on rising inflation expectations…
We have previously argued that inflation expectations embedded in US TIPS collapsed and then rose again as the Fed acted to backstop fixed income asset values (Chart 29) and consumer prices. Now, with the Fed committing to do whatever it takes to prevent widespread bankruptcies across the US, Congress injecting a $2tn fiscal stimulus plan, and economic growth on standstill until there is a cure or a vaccine, inflation could rise even if GDP does not. This backdrop should prove very positive for gold, in our view. Similarly, the sharp increase in the ECB balance sheet in recent years, coupled with the likely massive expansion ahead, should provide strong support to gold (Chart 30).
…driven by massive monetary easing plans around the world…
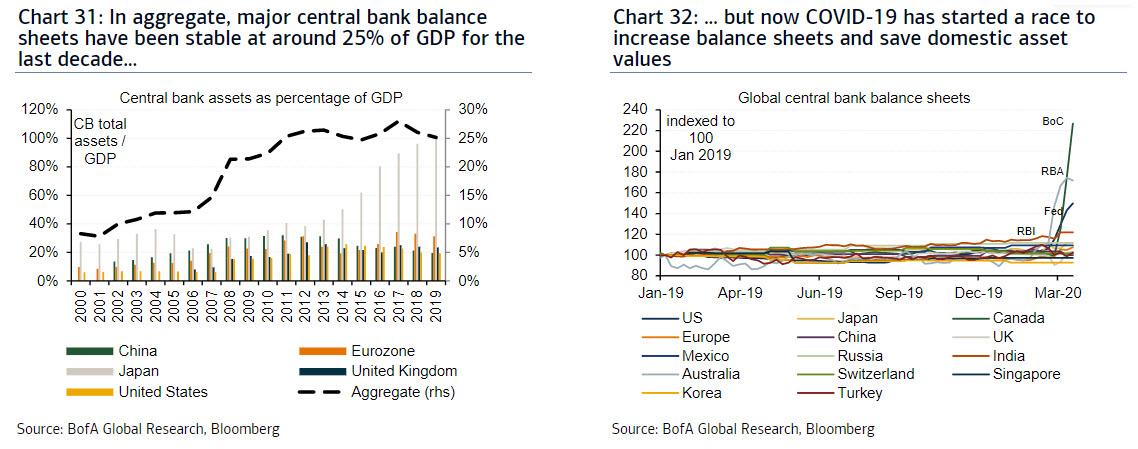
One of the most intriguing developments ahead is that US GDP could drop by 30% YoY in 2Q20, the steepest collapse ever in modern history. Other countries like Japan will likely experience a 21.8% decline in output, while China just reported a contraction of 6.8% in 1Q20. As central banks rush to expand their balance sheets and backstop the economy, a lot of risks could effectively be socialized, boosting the appeal of gold. In aggregate, major central bank balance sheets have been stable at around 25% of GDP for the last decade or so (Chart 31). But clearly Covid-19 has started a race to increase balance sheets and save domestic asset values (Chart 32).
…and also by unprecedented fiscal deficits and government borrowing
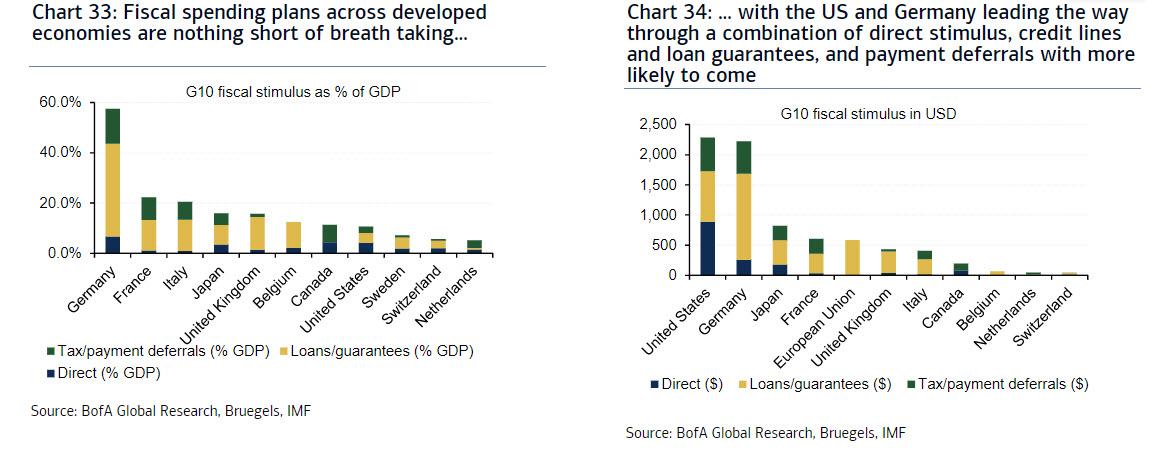
Another important point to remember is that, just as central banks are socializing risk in financial markets, governments are increasing their spending like never before during peacetime. Fiscal spending plans across developed economies are nothing short of breathtaking whether we look at them in dollar terms (Chart 34) or as a percentage of each nation’s GDP (Chart 33). Of course, emerging economies do not have the domestic savings base to attempt such an extraordinary feat, but their central banks may opt to reduce DM sovereign bonds in favor of gold.
Cross-asset portfolios should increase exposure to gold…
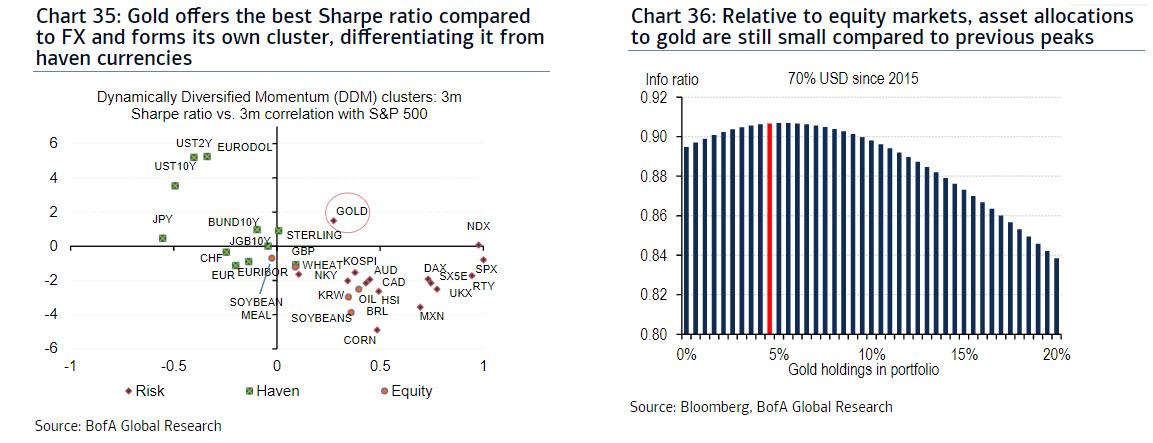
Our Dynamically Diversified Momentum portfolio allocation tool uses a combination of clustering and Sharpe ratio momentum indicators to either add or reduce exposure to a broad range of asset classes (Chart 35). This allocation technique is representative of what some systematic cross-asset portfolios would use. In DDM, gold has generally been classified in the haven cluster, but has recently switched to the equity cluster and our tool has held a long gold position since mid-March. Also, traditional equal risk contribution portfolios, whether balanced or fixed income geared, should keep adding exposure to the yellow metal over the coming months to increase efficiency (Chart 36).
…and on our estimates investors are still underweight gold
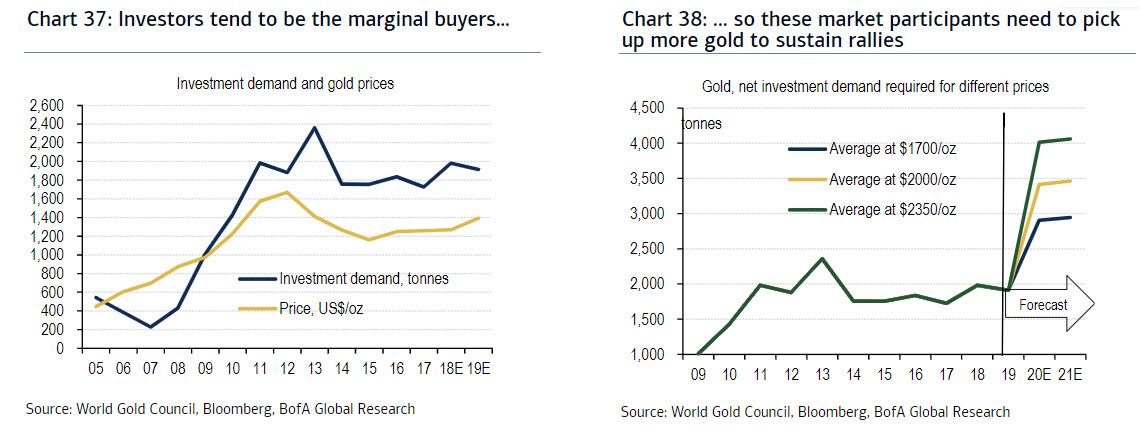
Investment demand has correlated strongly with gold prices in recent years, and we expect precisely this group of buyers to drive gold prices higher (Chart 37). In other words, different levels of non-commercial demand are required to sustain different average price levels. Indeed, for gold to average $2,000/oz next year, purchases need to rise by 73% YoY (Chart 38). Given the current macro-economic backdrop, we believe this figure is likely to be exceeded.
We increase our average gold price forecasts from 2020 on…
We have been long-term gold bulls, maintaining our constructive forecast even through the recent volatility. That said, gold has now hit our average 4Q20 price forecast at $1,700/oz, Hence, we are marking-to-market expectations, while at the same time anticipating further upside, largely because central banks underwrite fiscal stimulus and financial markets through money printing, with fundamentals justifying a rally to $2,250/oz in 2021. Still, strong USD backdrop, reduced market volatility, and lower jewelry demand will likely remain headwinds to gold.
…and we also up our 18m gold target from $2000/oz to $3000/oz
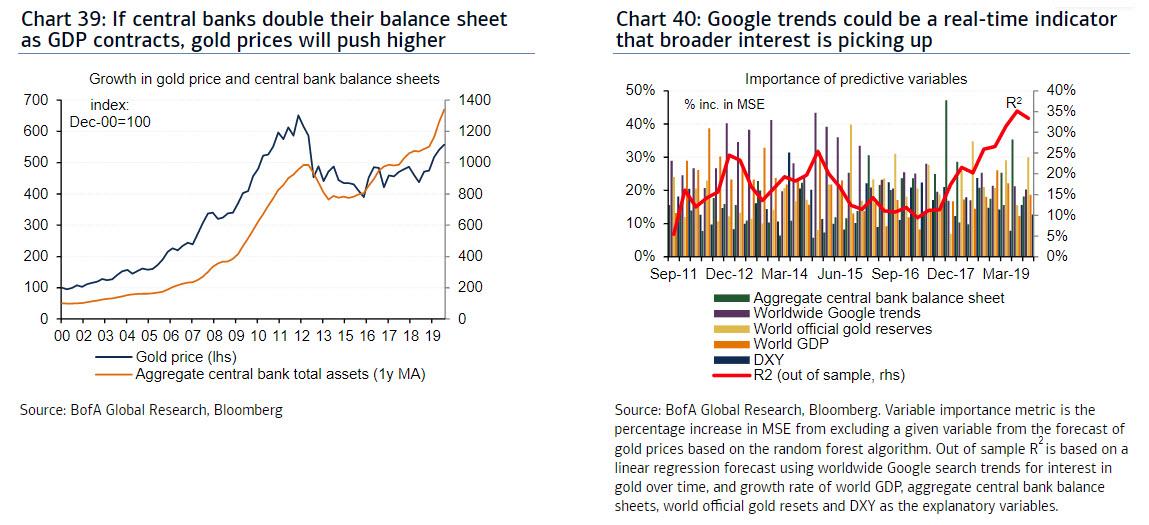
Beyond the supply/demand fundamentals, financial repression is back at an extraordinary scale. Rates in the US and most G-10 economies will likely end up at or below zero for a very long period of time, just as central banks attempt to push inflation back above their targets. Beyond flow variables such as real rates, the USD or market risk, variables such as nominal GDP, central bank balance sheets, or official gold reserves will remain key determinants of gold prices. If central banks double their balance sheet as GDP contracts, gold prices will push higher (Chart 39). Thus, we increase our 18m gold target from $2,000 to $3,000/oz. When will gold start to catch steam? Our work shows that Google trends (Chart 40) could be an early real-time indicator that broader interest is picking up.
Over the past few weeks, state governments across the Land of the Free have been feverishly proposing new legislation that will virtually guarantee the entire insurance industry is wiped out.
The root of the issue has to do with something called business interruption insurance.
Business interruption is a pretty common type of insurance that’s designed to protect business owners against a number of risks.
For example, let’s say you own a restaurant and you have a bad kitchen fire that forces you to shut down for a month.
You’d most like have a fire insurance policy to cover the direct damage of the fire. And a lot of companies would also have a business interruption policy to help them stay afloat during that one-month period while the business is closed for repairs.
But business interruption insurance has certain exclusions. It’s just like any other policy, and the insurers are very clear about what risks they do/do not cover.
A typical homeowner’s insurance policy, for example, covers your home against risks like theft, fire, and vandalism.
But most homeowner’s policies specifically exclude flooding. So any homeowner who wants to protect their homes from the risk flood damage can purchase a separate flood insurance policy.
Many insurance plans, including business interruption policies, also tend to exclude things like damage caused by war, government action, and “acts of God”.
But again, any business that wants to insure against those risks is free to seek additional coverage.
That’s the whole idea of insurance: customers are able to pick and choose which risks they want to insure against, and which risks they’re willing to take.
It’s fair to say that most business interruption policies don’t cover a worldwide pandemic that shuttered the entire global economy.
But there’s a growing trend now where state governments are proposing new legislation that would RETROACTIVELY force insurance companies to protect their policyholders against Covid.
This is totally nuts. The state governments are the ones that forced businesses to shut down.
Now they expect the insurance companies to pay for the consequences, even though the policies specifically state that they don’t cover this type of risk.
They might as well demand pay for every other uninsured hazard. Did your house flood and you didn’t have flood insurance? Well let’s retroactively force the insurance companies to pay for that too.
Pennsylvania, New York, Illinois, New Jersey, and several other states have proposed similar legislation, or threatened regulatory action.
(This trend is also picking up steam overseas; in the UK, for example, lawsuits are already pending against insurance companies for not paying out Covid-related claims.)
And given that just about EVERY business would qualify for this retroactive Covid coverage, there’s simply no way that the insurance industry would be able to afford such an indemnity.
Think about it– the federal government made $350 billion worth of loans available to small businesses earlier this month, and that money was 100% used up in about 2 weeks. And they just agreed on another $300 billion this morning.
So most insurance companies would be wiped out if this legislation passes… i.e. CUE THE GOVERNMENT BAILOUT of the insurance industry.
Just like airlines, hotels, hospitals, etc., the insurance company would be standing in line to suckle on that sweet taxpayer bailout teet, probably to the tune of another half-trillion dollars.
Of course, it goes without saying that the government doesn’t have the money for any this.
We’ve explored the government balance sheet many times in the past: Uncle Sam is already in the hole by MINUS $23 trillion according to the Treasury Department’s most recent financial statements.
And, over the last few years, even when the economy was incredibly strong, the federal government still managed to lose more than a trillion dollars a year.
Now that they have a real crisis to contend with, the deficit is going to swell to an unimaginable figure.
Frankly it doesn’t matter whether or not the insurance companies end up footing the bill.
If the insurance companies re forced to pay up, the government will likely bail them out. Otherwise the government will bail out businesses directly.
Either way, it’s pretty obvious the government is going to spend an unbelievable amount of money they don’t have… which means the central bank (Federal Reserve) will keep printing more money.
That’s how the system works: whenever the government wants to bail someone out, the Federal Reserve first conjures the bailout money out of thin air, and then ‘loans’ it to the Treasury Department.
Crazy, right?
The Federal Reserve has already printed trillions of dollars since this crisis started, and that may only be the warm-up round.
The longer this lasts, the more money they’re going to print… and the more they’ll end up debasing the currency.
We are obviously living in extraordinary times, and it’s perfectly reasonable to hope for the best.
But it would be irresponsible to willfully ignore what the government and central bank are doing here.
Conjuring infinite amounts of money out of thin air could have incredibly destructive consequences on the currency.
And that’s why, as I’ve written before, it’s definitely time to consider owning some real assets.