The Theory Of MMT Falls Flat When Faced With Reality (Part I)
Tyler Durden
Mon, 06/29/2020 – 12:35
Authored by Lance Roberts via RealInvestmentAdvice.com,
If you haven’t heard of Modern Monetary Theory, or “MMT,” you will soon. If you recently lost your job due to the economic shut down, and received a stimulus check, you are already a beneficiary. As we will discuss in Part-1 of this two-part series, MMT’s theory falls flat when faced with reality.
With economic growth sluggish, unemployment high, and the wealth gap widening, politicians will be increasing pressure to delve deeper into MMT to cure our economic woes. However, to understand more about the premise of MMT, economist Stephanie Kelton, recently produced a video explaining the concept.
The Government Isn’t A Household
“MMT starts with a simple observation, and that is that the US dollar is a simple public monopoly. In other words, the United States currency comes from the United States government; it can’t come from anywhere else. So, what that means is that the federal government is nothing like a household.
For households or private businesses to be able to spend they’ve got to come up with the money, right? And the federal government can never run out of money. It cannot face a solvency problem with bills coming due that it can’t afford to pay. It never has to worry about finding the money to be able to spend.”
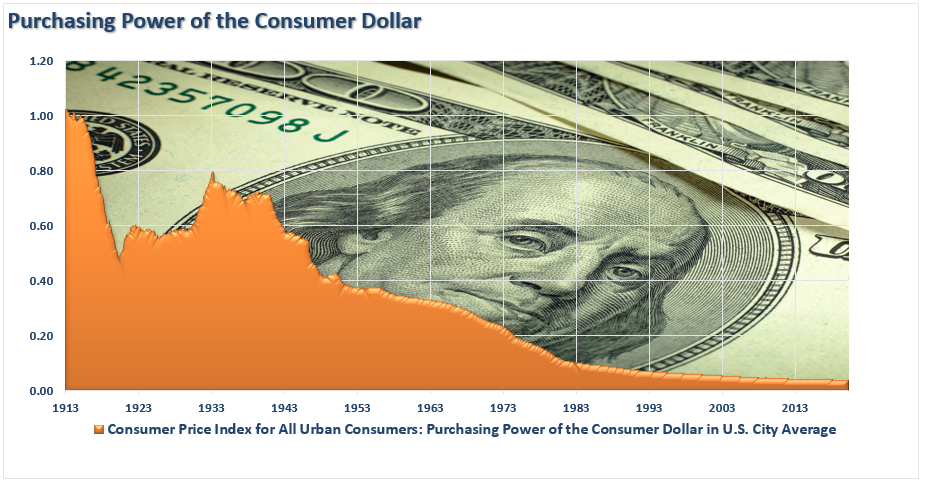
There is nothing untrue about that statement. While the Government can indeed “print money to meet all obligations,” it does NOT mean there are not consequences. The chart below really tells you all you need to know.
In reality, just like households, debt matters. When debt is used for “non-productive” purposes, the debt diverts dollars from productive purposes into servicing of the debt. The concept of “productive investments” is critically important to understanding why MMT fails the “litmus” test.
American Gridlock
Dr. Woody Brock, in American Gridlock, explained the importance of the productive use of debt. To wit:
“The word ‘deficit’ has no real meaning.
‘Country A spends $4 Trillion with receipts of $3 Trillion. This leaves Country A with a $1 Trillion deficit. To make up the difference between the spending and the income, the Treasury must issue $1 Trillion in new debt. That new debt is used to cover the excess expenditures, but generates no income leaving a future hole that must be filled.
Country B spends $4 Trillion and receives $3 Trillion income. However, the $1 Trillion of excess, which was financed by debt, was invested into projects and infrastructure that produced a positive return rate. There is no deficit as the return rate on the investment funds the ‘deficit’ over time.’
There is no disagreement about the need for government spending. The argument is with the abuse and waste of it.
For government “deficit” spending to be effective, the “payback” from investments being made through debt must yield a higher return rate than the interest rate on the debt used to fund it.
MMT’s Root Problem
For MMT, the problem is government spending has shifted away from productive investments. Instead of things like the Hoover Dam, which creates jobs (infrastructure and development), spending shifted to social welfare, defense, and debt service, which have a negative rate of return.
According to the Center On Budget & Policy Priorities, nearly 75% of every tax dollar goes to non-productive spending.
In other words, the U.S. is “Country A.”
To clarify, in 2019, the Federal Government spent $4.8 Trillion, which was equivalent to 22% of the nation’s entire nominal GDP. Of that total spending, ONLY $3.6 Trillion came from Federal revenues, the remaining$1.1 trillion came from debt.
If 75% of all expenditures go to social welfare and interest on the debt, those payments required $3.6 Trillion, or roughly 99% of the total revenue coming in.
Measuring With The Wrong Yardstick
“So, the deficit definitely matters; it’s just that it matters in ways that we’re not normally taught to understand. Normally I think people tend to hear deficit and think it’s something that we should strive to eliminate; that we shouldn’t be running budget deficits; that there is evidence of fiscal irresponsibility. And the truth is the deficit can be too big. Evidence of a deficit that’s too big would be inflation.” – Kelton
Yes, Ms. Kelton does acknowledge the deficit can be too big, and the consequence would be inflation.
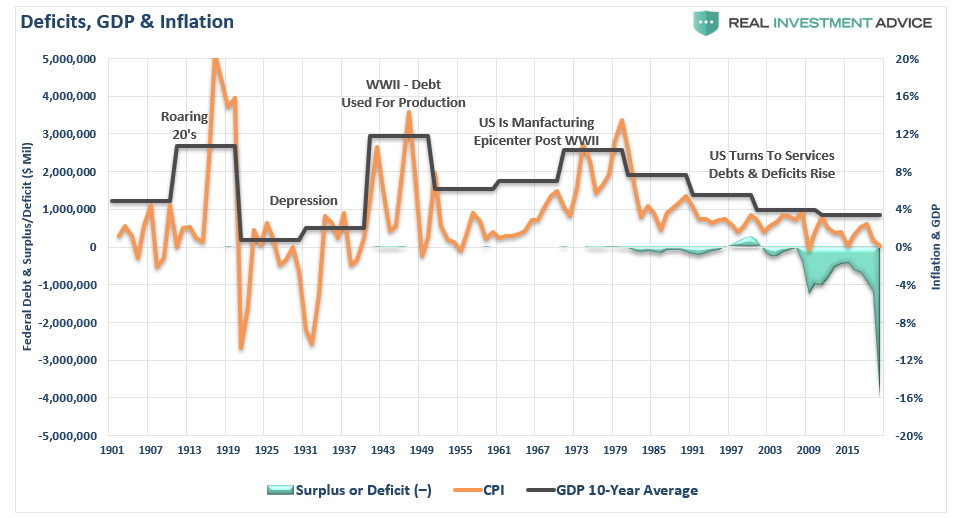
There are two problems with her argument. The first is that if the Government was running a massive deficit funding productive investments, then “inflation” would indeed be a problem. However, increasing deficits for non-productive purposes slows economic growth and is deflationary. Even a cursory glance at GDP, the deficit, and inflation show the error in MMT’s premise.
The second, and more important problem is the measure of inflation.
How Should MMT Measure Inflation?
Prior to 1998, inflation was measured on a basket of goods. However, during the Clinton Administration, the Boskin Commission was brought in to recalculate how inflation was measured. Their objective was simple – lower the rate of inflation to reduce the amount of money being paid out in Social Security.
Since then, inflation measures have been tortured, mangled, and abused to the point where it scarcely equates to the inflation that consumers deal with. For example, home prices were substituted for “homeowners equivalent rent,” which was falling at the time, and lowered inflationary pressures, despite rising house prices.
Since 1998, homeowners equivalent rent has risen 72% while house prices, as measured by the Shiller U.S. National Home Price Index has almost doubled the rate at 136%. House prices which currently comprise almost 25% of CPI has been grossly under-accounted for. In fact, since 1998, CPI has been under-reported by .40% a year on average. Considering that official CPI has run at a 2.20% annual rate since 1998, .40% is a big misrepresentation.
Innovation, technology, and the exportation of labor has lowered stated inflation rates. The chart below compares inflation today measured with both the 1990 computations and current ones.
Whether you agree with the calculations, weightings, and hedonics, the measure of inflation MUST be defined if it is the governor of economic policy.
It currently isn’t.
Deficits Are Others Surpluses
“In other words their deficits become our surpluses and so when we talk about the government having all this red ink, we have to remind ourselves that their red ink becomes our black ink and their deficits are our surpluses and the question is then should you expand fiscal policy? Should you run bigger budget deficits in order to boost growth?” – Kelton
In theory, the concept is correct; in economic reality, it hasn’t functioned that way.
If used for productive investments, debt can be a solution to stimulating economic growth in the short-term and providing a long-term benefit. The current surge in deficit spending only succeeds in giving a temporary illusion of economic growth by “pulling forward” future consumption, leaving a void to fill continually.
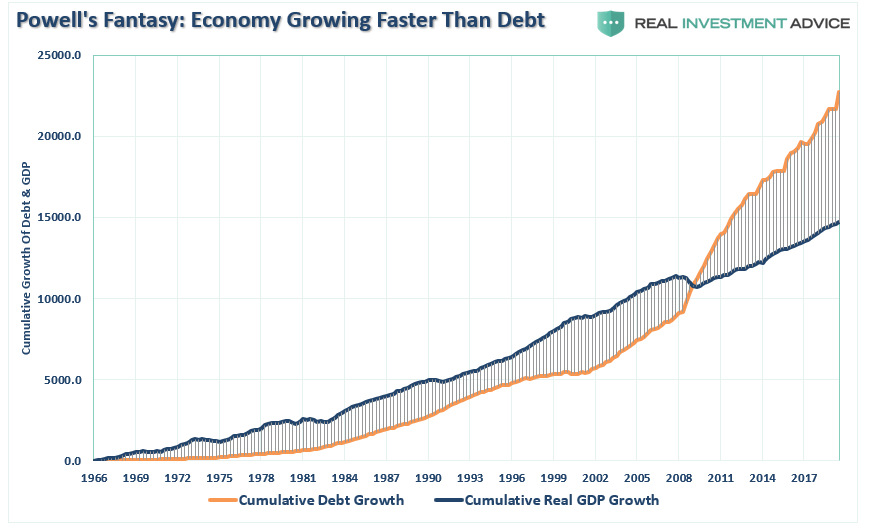
Jerome Powell previously stated the economy should grow faster than the debt. Yet, each year, the debt continues to grow faster than the economy.
Economy Can’t Grow Faster Than Debt
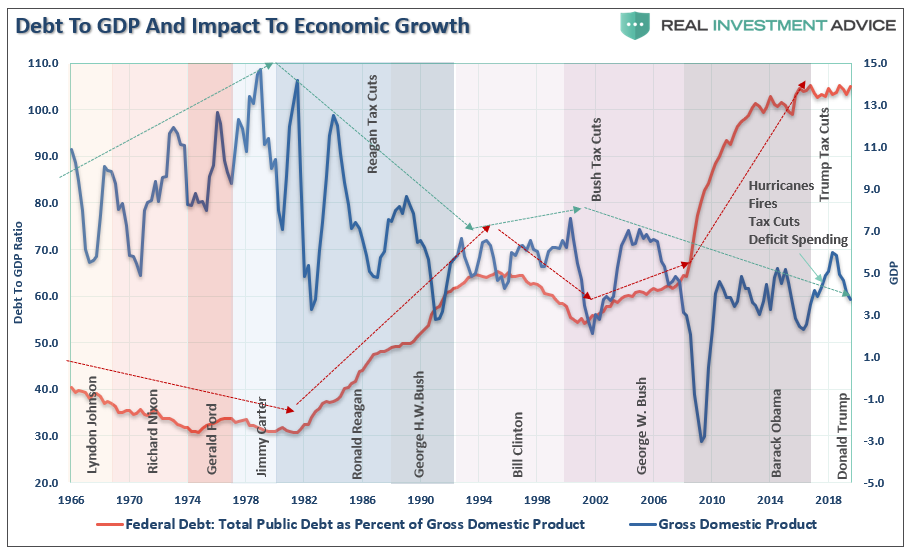
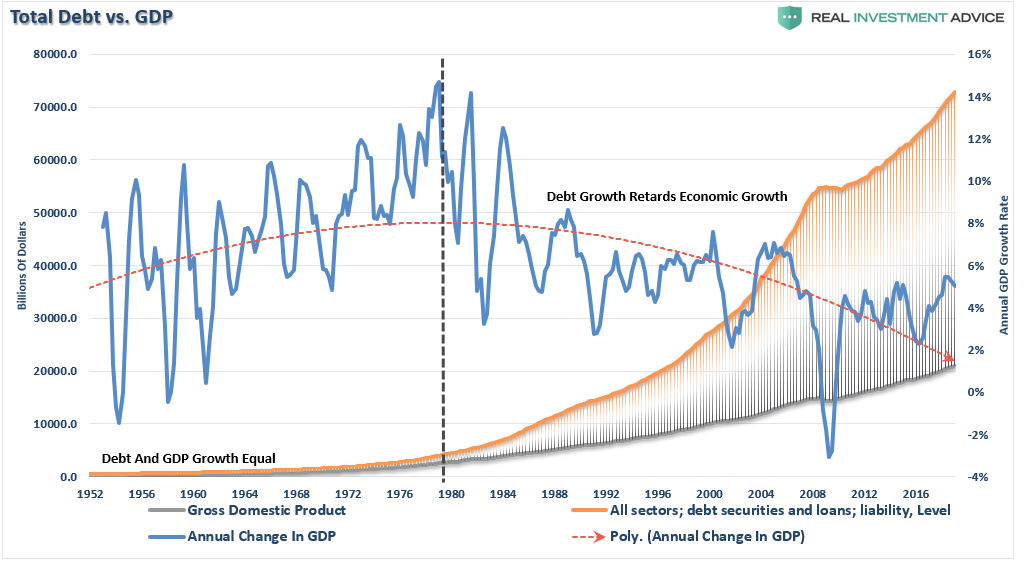
The relevance of debt growth versus economic growth is all too evident, as shown below. Since 1980, the overall increase in debt has surged to levels that currently usurp the entirety of economic growth. With economic growth rates now at the lowest levels on record, the growth in debt must continue to maintain current economic growth.
However, merely looking at Federal debt levels is misleading.
It is the total debt that weighs on the economy.
It now requires nearly $3.00 of debt to create $1 of economic growth.
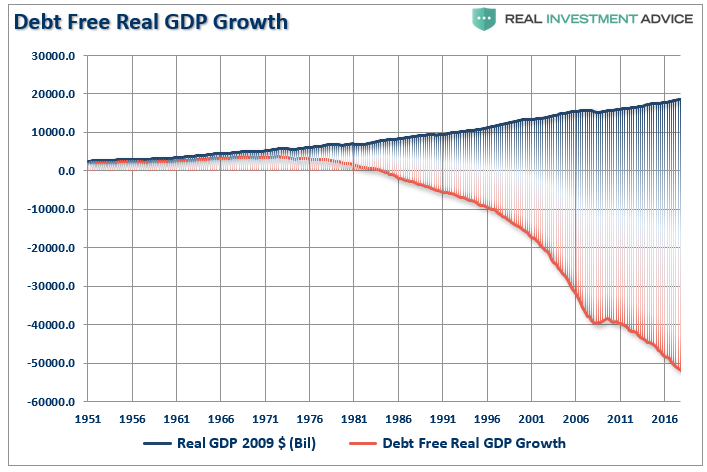
Another way to view the impact of debt on the economy is to look at what “debt-free” economic growth would be. In other words, without debt, there has actually been no organic economic growth.
The economic deficit has never been more enormous. For the 30 years from 1952 to 1982, the economic surplus fostered a rising economic growth rate, which averaged roughly 8% during that period. With the economy expected to grow below 2% over the long-term, the economic deficit has never been greater.
Such is why MMT will ultimately fails.
Interest rates and inflation MUST remain low, and debt MUST grow faster than the economy, just to keep the economy from stalling out.
The current environment is the very essence of a “liquidity trap.”
Productivity Loss
“So, what is the objective, what is the proper policy goal, and I think the right policy goal is to maintain a balanced economy where you’re at full employment. You’re guarding against an acceleration and inflation risk. And economists tend to understand that the kinds of things that you can do to boost longer term growth are investments in things like education, infrastructure, R&D. Those are the sorts of things that tend to accelerate productivity growth so that longer term real GDP growth can be higher.
So, there are ways in which the government can make investments today that increase deficits today that produce higher growth tomorrow and build in the extra capacity to absorb those higher deficits.” Kelton
There is clear evidence that increasing debts and deficits DO NOT lead to either stronger economic growth or increasing productivity. As Michael Lebowitz recently showed:
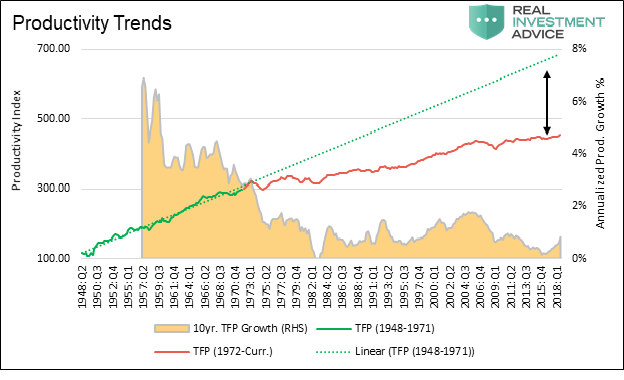
“Since 1980, the long term average growth rate of productivity has stagnated in a range of 0 to 2% annually, a sharp decline from the 30 years following WWII when productivity growth averaged 4 to 6%. While there is no exact measure of productivity, total factor productivity (TFP) is considered one of the best measures. Data for TFP can found here.
The graph below plots a simple index we created based on total factor productivity (TFP) versus the ten-year average growth rate of TFP. The TFP index line is separated into green and red segments to highlight the change in the trend of productivity growth rate that occurred in the early 1970’s. The green dotted line extrapolates the trend of the pre-1972 era forward.”
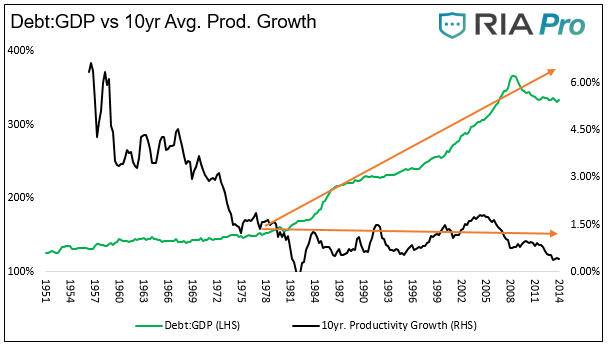
“The graph below plots 10-year average productivity growth (black line) against the ratio of total U.S. credit outstanding to GDP (green line).”
“This reinforces the message from the other debt related graphs – over the last 30 years the economy has relied more upon debt growth and less on productivity to generate economic activity.
Ill-conceived policies, like MMT, which impose an over-reliance on debt and demographics, have mostly run their course and failed.
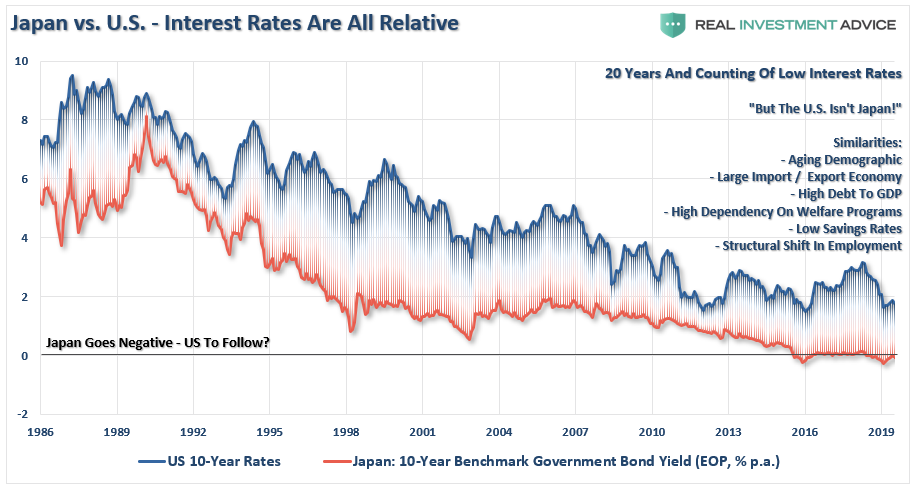
Let’s Be Like Japan
“So, it’s impossible really to put a number on it. Nobody can know how much debt is too much debt. If you look at Japan today you see a country where the debt to GDP ratio is something like 240%, orders of magnitude above where the US is today or even where the US is forecast to be in the future. And so the question is how is Japan able to sustain a debt of that size.
Wouldn’t it have an inflation problem? Would it lead to rising interest rates? Wouldn’t this be destructive in some way? The answer to all those questions as Japan has demonstrated now for years is simply, no. Japan’s debt is close to 240% of GDP, almost a quadrillion. That’s a very big number. Again, long term interest rates are very close to zero. There’s no inflation problem and so despite the size of the debt there are no negative consequences as a result. I think Japan teaches us a really import lesson.” – Kelton
Ms. Kelton is correct. Japan does indeed teach us that running massive debts and deficits have not fostered stronger economic growth, beneficial inflation, or prosperity.
There Is More To The Story
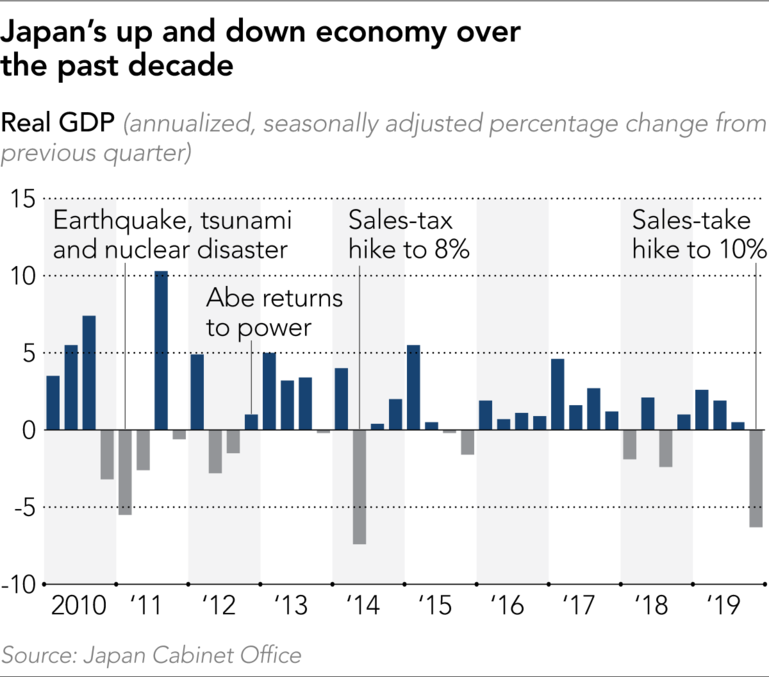
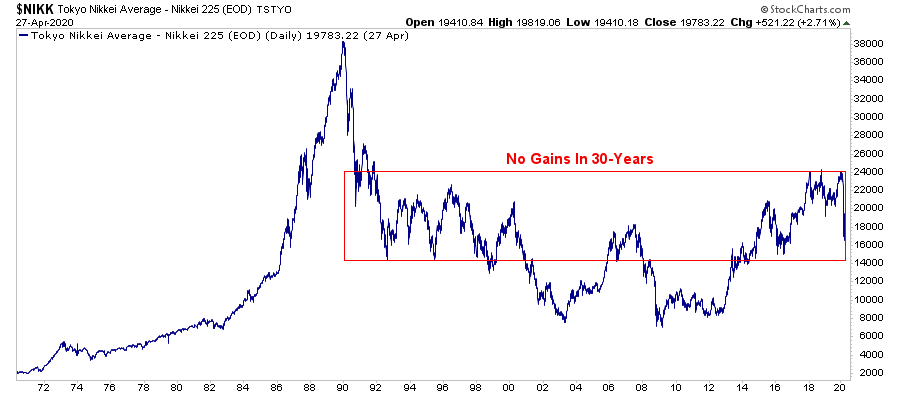
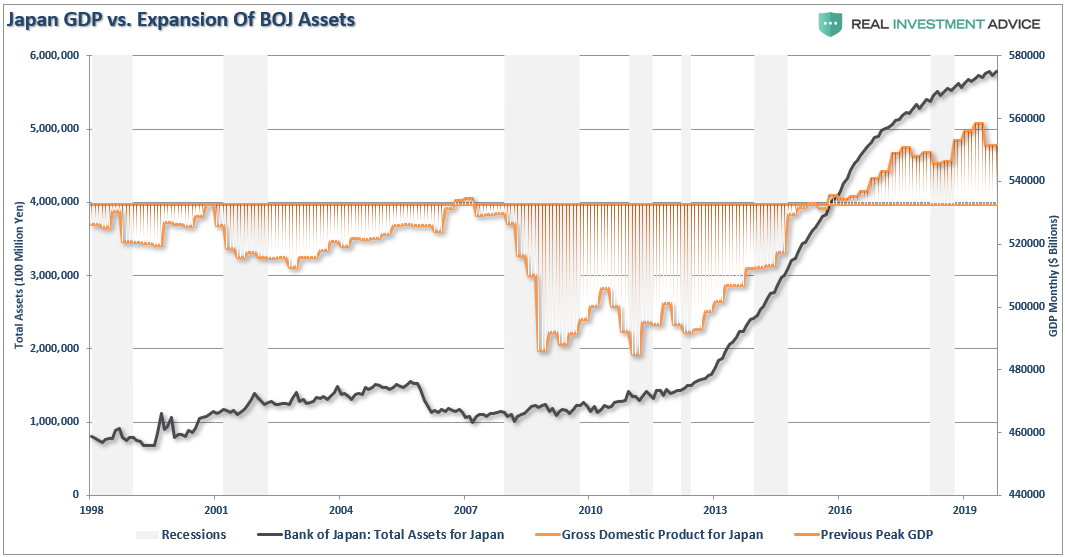
Japan has been running a massive “quantitative easing” program stating in 2008, which is more than 3-times the size of that in the U.S. While stock markets did rise with ongoing Central Bank interventions, long-term performance has remained muted.
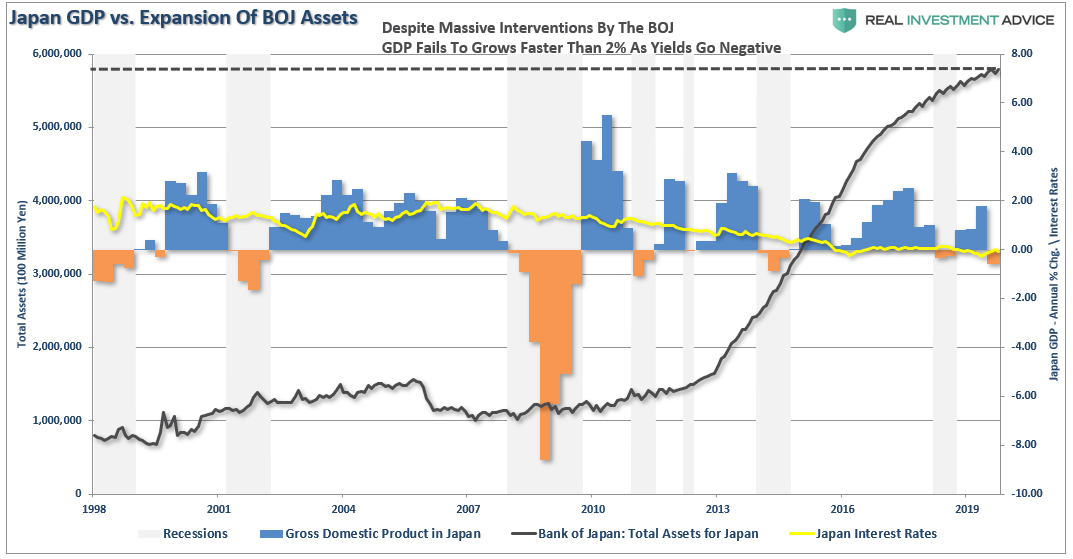
More importantly, economic prosperity is only slightly higher than it was before the turn of the century.
Despite the Bank of Japan consuming 80% of the ETF market and a sizable chunk of the corporate and government debt market, Japan has been plagued by rolling recessions, low inflation, and low-interest rates. (Japan’s 10-year Treasury rate fell into negative territory for the second time in recent years.)
Clearly, Ms. Kelton has not studied the impacts of MMT on Japan. The consequences for its citizens has been less than beneficial.
Japan Is A Template
Should we worry about the debt? If Japan is indeed a template of what we will eventually face, the simple answer is “yes.”
As global growth continues to slow, the negative impact of debt expands economic instability and wealth inequality. Likewise, the hope Central Bank’s monetary ammunition can foster economic growth, or inflation has been misplaced.
“The fact is that financial engineering does not help an economy, it probably hurts it. If it helped, after mega-doses of the stuff in every imaginable form, the Japanese economy would be humming. But the Japanese economy is doing the opposite. Japan tried to substitute monetary policy for sound fiscal and economic policy. And the result is terrible.” – Doug Kass
Japan is a microcosm of what the U.S. will face in the coming years as the “3-D’s” of debt, deflation, and the inevitability of demographics continue to widen the wealth gap. What Japan has shown us is that financial engineering doesn’t create prosperity, and over the medium to longer-term, it has negative consequences.
Such is a key point.
What is missed by those promoting the use of more debt, is the underlying flawed logic of using debt to solve a debt problem.
At some point, you simply have to stop digging.
via ZeroHedge News https://ift.tt/3eQ3Ua8 Tyler Durden
