Risk-Parity funds have had the worst two days since the election (giving up YTD gains) as bond prices dropped, stock prices dropped, and volatility spiked…
And it’s not just equity market risk, volatility expectations across all asset classes is on the rise…
But, as Dana Lyons details below, relative to the moderate drawdown in the stock market this week, short-term volatility expectations are screaming higher.
Yesterday’s down day (gasp!) in the stock market certainly was nothing extraordinary based on the magnitude of losses. However, given the market’s recent interminable ascent, it did send some interesting shockwaves throughout the markets and various metrics that we track. We mentioned one noteworthy development earlier today in the abundant number of new highs and new lows on the NYSE yesterday. Another interesting reaction was seen in the volatility market.
Volatility indices based on the stock market, e.g., the VIX, generally move opposite stock prices. That is, when stocks rise, volatility expectations typically drop as complacency reigns and when stocks drop, volatility expectations generally rise as fear rises. Typically, a significant jump in volatility requires a relatively deep or sharp decline in stocks. However, the recent stock market climate has been so benign that yesterday’s relatively mild losses seemed to have really spooked volatility traders.
One example can be seen in the short-term, i.e., 9-day, S&P 500 Volatility Index, aka, the VXST, which jumped 42.5% yesterday. That is the 23rd biggest jump in the index since its inception in 2011. The odd thing is that the S&P 500 (SPX) was down “just” 2/3 of a percent.
For context, that is the smallest drop (and only 4th less than 1%) in the SPX of all 26 days that have seen the VXST jump more than 40%. Furthermore, the average drop in the SPX on those days was -2.4% (For those of you who object to using % based measures on volatility instruments, yesterday’s 4.45 point jump was still the 49th largest in VXST history. And historically, the SPX has averaged a loss of more than 2% on days the VXST jumps over 4 points).
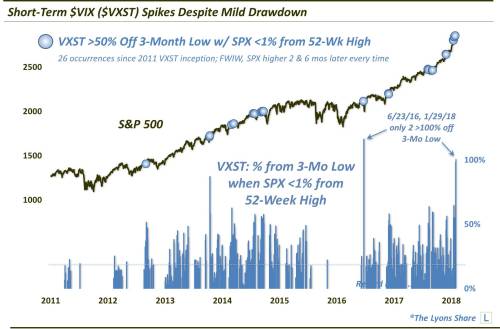
Another angle of the relatively large jump in the VXST is seen in its proximity to its 3-month low. Specifically, as of yesterday, it is over 100% above its 3-month low. The odd thing about that is that, historically, on the 160-plus days when the VXST has been more than 100% above its 3-month low, the S&P 500 has been an average of 8.4% below its 52-week high. Yesterday, the SPX closed just 0.67% off of its 52-week high of the day before. That is the only day besides the day before the Brexit scare (6/23/2016) that found the VXST 100% off is 3-month low when the SPX was within 1% of its 52-week high.
From another angle, in today’s Chart Of The Day, we display the proximity of the VXST versus its 3-month low on every day since 2011 when the S&P 500 closed within 1% of its 52-week high. Yesterday’s data point certainly stands out.

So are volatility traders going overboard here bidding up vol expectations given the relatively shallow decline so far? Or are they on to something? After all, the day after the pre-Brexit episode, the SPX did drop over 3.5%. And we are obviously getting some follow-through selling today after yesterday’s developments. The SPX did bounce back quickly after the Brexit affair, though. So who does the current odd spike in volatility expectations favor, the bulls or the bears?
* * *
If you are interested in the Premium version of our charts and research, check out “all-access” service, The Lyons Share. You can follow our investment process and posture every day — including insights into what we’re looking to buy and sell and when. Thanks for reading!
via RSS http://ift.tt/2DZt5I3 Tyler Durden


