“Screaming Recession” – Rates Fully-Priced For Hawkish Fed, Stocks Repositioning For Eventual Contraction
In the absence of “upside inflation surprises”, Nomura’s Charlie McElligott points out in his latest note this morning that it seems the rates market is approaching “fully-priced” for now for a “hawkish tightening cycle”, and is now focused on the (negative) economic implications of tighter financial conditions.
Locally, the Nomura strategist notes that equities are again bearing the brunt of said Rates move as macro catalyst – particularly the tightening in FCI as expressed per the enormous multi-week spasm in Real Yields – while flow-wise, now feeling the pain of the resumption of Dealer “Short Gamma vs Spot” immersion, leading us back to increasingly spastic intraday overshoots, as the market is just so impossibly convex due to the vast-majority of options flow now being in the 0-5 days-to-expiration bucket on SPX / SPY level.
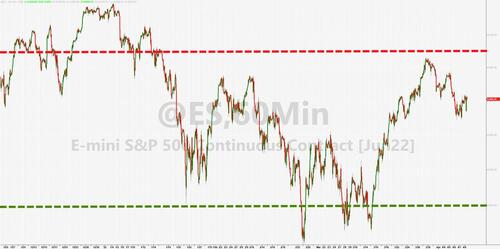
US Equities continue to do their “Fed Shorting (wide strike) Strangles” range-trade thing between 4200 and 4650, which continues to be the right call for months and particularly as any time we rally, Financial Conditions are too “EASY” and forces an upgrading of “inflation hawk” rhetoric from the Fed (as they are de facto “selling Calls”) which creates overhead resistance…
-
That said, the recent 3-wk Equities directional stabilization off the Op-Ex / March Fed hike lift-off–lows has been very-much in-line with our “front-loaded Fed tightening cycle” analog we ran and have discussed ad nauseum over the course of Q1.
-
Per said analog, the median return of the prior 8 instances of this trigger sees that within the first two months after the initial hike of a “4+ hikes in the first 12m” front-loaded Fed cycle, the max Equities drawdown has been made…and out 6m- and 12m-, we see a grinding “little-bit of everything” rally thereafter…before the full implications of the tightening eventually catches-up with the economy thereafter, of course
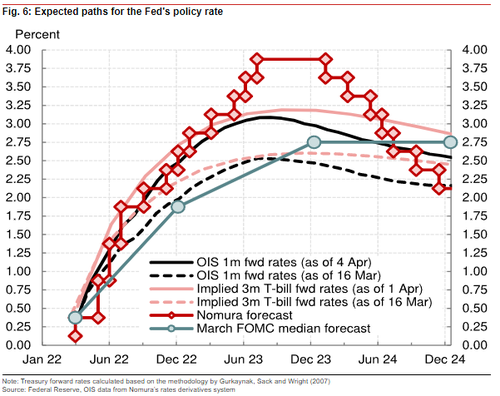
Hence, the market focus is seemingly transitioning from its “front-loaded tightening cycle” obsession which began in 4Q21…which as of now, in the absence of new upside inflation data surprises (i.e. next Tuesday’s US CPI release for March), looks increasingly priced-in after such an impulsive shift anticipating “restrictive” Fed policy-rate territory in extremely short-order, with a much higher “terminal” level in ‘23 than anybody thought was possible just weeks ago…
-
94bps of hiking priced for June shows the market is “locked” on upcoming back-to-back 50bps hikes alongside QT commencement in May
-
134bps of hikes by July—in other words, pushing towards THREE consecutive 50bps hikes by mid-Summer, while also expecting QT to hit “max caps” by August
-
And now at 223bps of implied hikes by Dec ’22 Fed meeting…
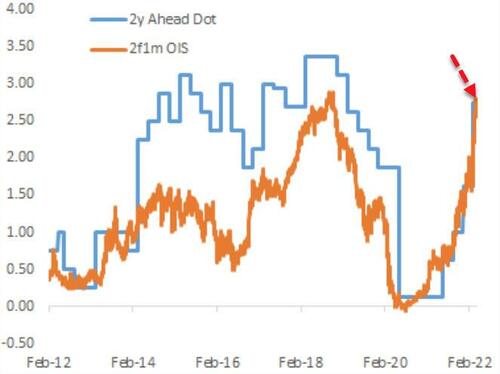
As Nomura’s Andy Chaytor points out, rates are fully-priced for The Fed… 2-year fwd 1mo USD rates are above the Median Fed ‘Dot’ for the first time since 2014…
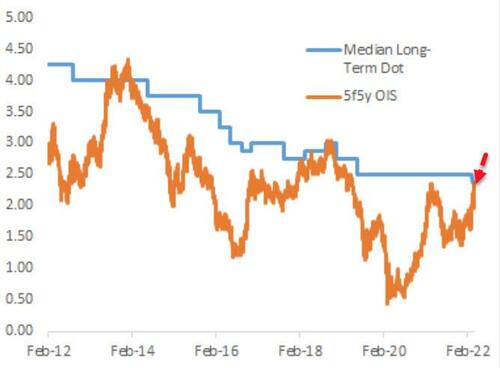
…and 5-year fwd 5Y rates have pushed above The Fed’s median long-term ‘Dot’ for the first time since the “QT Tantrum” in 2018…
The theme in the US Equities market is that we look to be immersed in the process of “moving-on” from the policy tightening brought about by the inflation- and labor- overshoot, and are now operating under an assumption of US economic contraction / recession eventuality…
As the table above shows, the thematic signs of a pre-emptive “Defensive” re-allocation / rotation trade brewing, further confirming the optics of ED$ and OIS curves which are telling us that the market is beginning to position for a “hard-landing” as soon as mid-’23, as the Fed’s plans to run restrictive policy simultaneously with a heavy-handed balance-sheet run-off will push the economy into “Recession”.
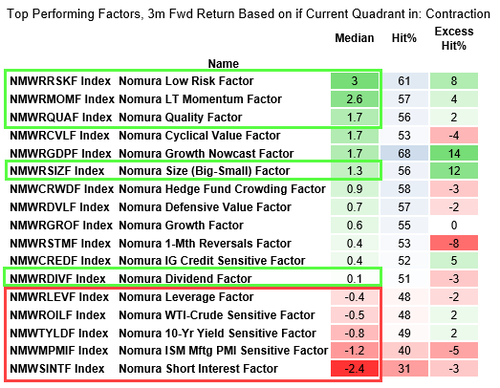
And critically, look at US Eq Risk-Prem / Thematic behaviors – where the only of our main “Factor Pairs” in the green so far in April are “Low Risk,” “Size” (Big minus Small), “Quality,” “Momentum” and “Dividend,” all screaming recession / contraction…while High Beta / Spec is again getting hit hard.
So where do we go from here?
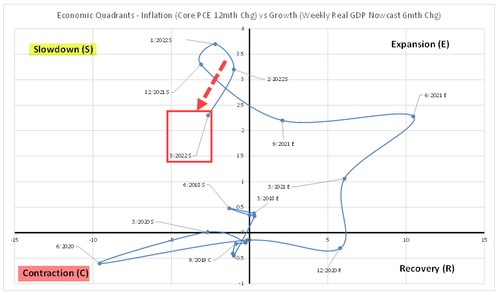
As per Nomura Economic Quadrant work, we have been in the “Slowdown” phase for months… but the most likely course from here is into “Contraction” a.k.a. “Recession,” as tighter financial conditions begin to bite…
According to backtested Nomura data, there is a 26% chance of shifting into “contraction” within 3 months.
So from a historical US Equities Factor behavior perspective, what is the trade in the “Contraction / Recession” Quadrant?
Well, it looks a lot like ‘more of the same’ that has been happening this last week…
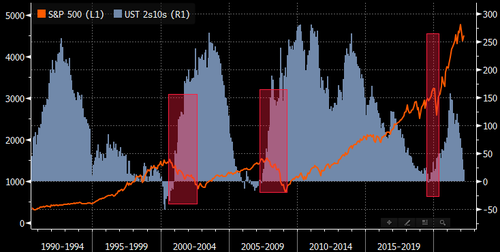
As we have previously explained – the broad Equities de-risking signal is not curve inversions (although it is a critical part of the overall sequencing, of course)… but instead, is when we get the steepening after inversion.
This pivot from “bear-flattening” / inversion into “steepening” tells you that the market has “smelled the recession,” rushing to price-OUT Fed HIKES and instead, price-IN Fed EASING thereafter, unwinding that hard “bear-flattening” we’ve been immersed within on the “tightening” policy pivot.
(FWIW, the recent steepening was more about how increasingly difficult it is to hold flatteners—hence, profit taking / unwind…I don’t believe this is the move yet)
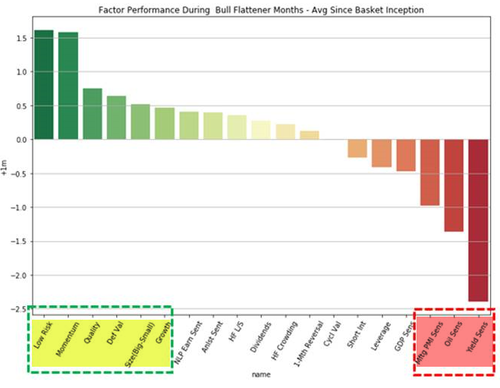
Ultimately, however, once the Recession is “real” and the market anticipates / front-runs the Fed pivoting again towards QE (mid- / late- ’23?) – there is likely a bull-flattening, which again, from US Equities Factor perspective, looks a lot like the “Long Duration Barbell” of old-times…
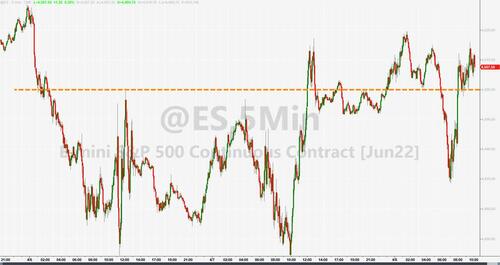
Tactically, for now, 4500 remains the key level to watch for the S&P 500
As SpotGamma notes, there is a fair amount of SPY gamma <=450 expiring today (~20% of total gamma) which can expand volatility for today.
If we hold the 4500 level into mid day, then the fuel builds in the bulls favor due to put decay and vanna flows and we could see a fairly strong move higher, with 4550 a reasonable target.
Conversely, a break of 4500, particularly into the close indicates a higher level of risk to markets due to the onset of negative gamma. As mentioned last night, one has to respect that markets have twice now bounced from 4450 despite the elevated IV and elevated negative gamma. The setup was in place for an extended drawdown, but the S&P has held on.
Tyler Durden
Fri, 04/08/2022 – 14:25
via ZeroHedge News https://ift.tt/bkH7u0s Tyler Durden
