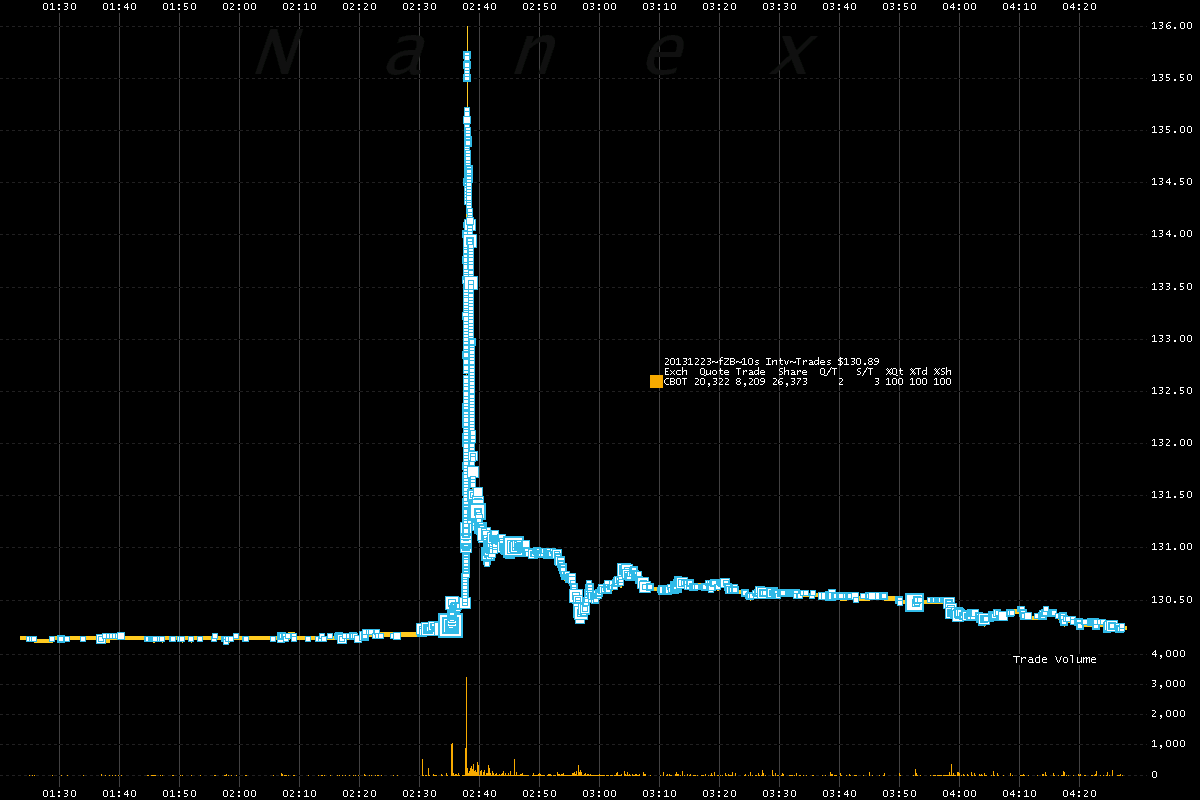
This morning's incredible 6-month-range busting, 11-sigma, so-called "fat finger" in Treasury futures markets was brushed under the carpet by most of the mainstream media since it had no effect on what is important – US equities. However, as the following detailed charts from Nanex show, it looks like anything but an 'accidental' fat finger and merely highlights just how fragile the world's largest (and supposedly most liquid) markets have become. Still, with Virtu's CEO doing so well, how will it ever stop?
The 11-sigma spike in all its glory… (via Nanex)
(3-month front-month 30Y Futs intraday range mean is ~0.9 points and standard-deviation is ~0.5 points)

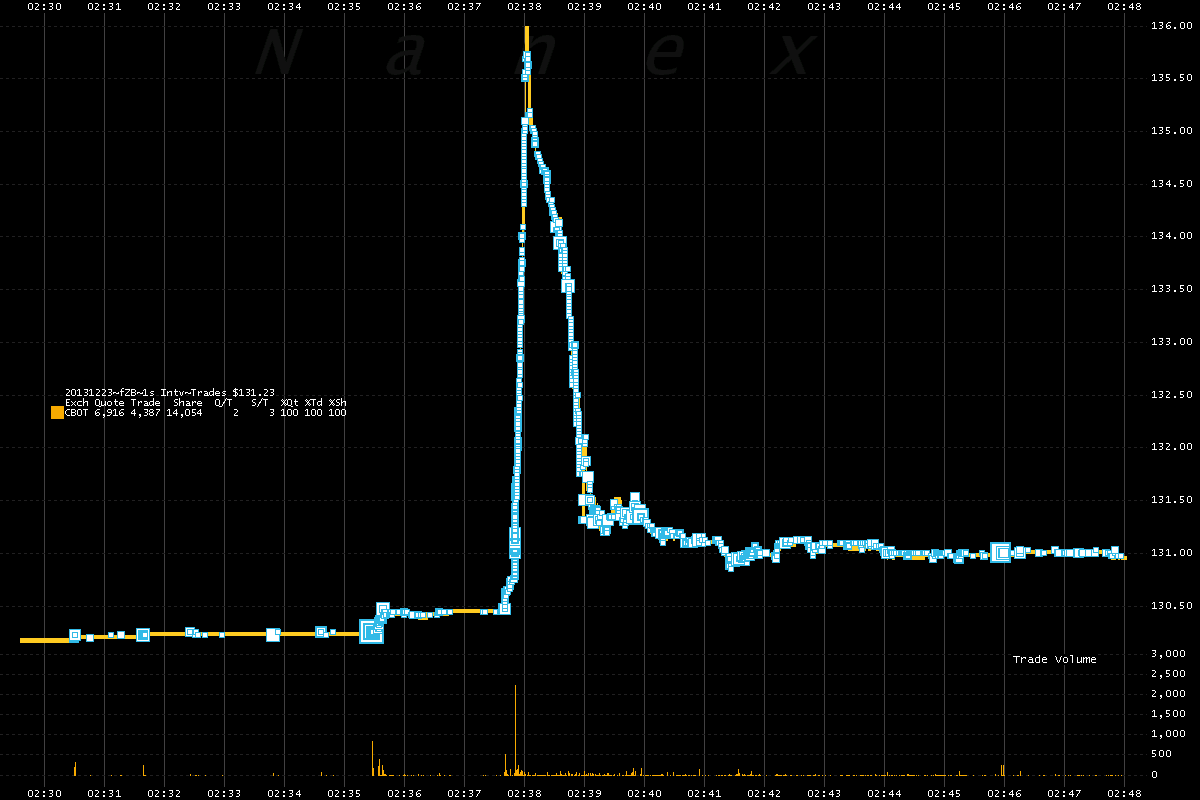
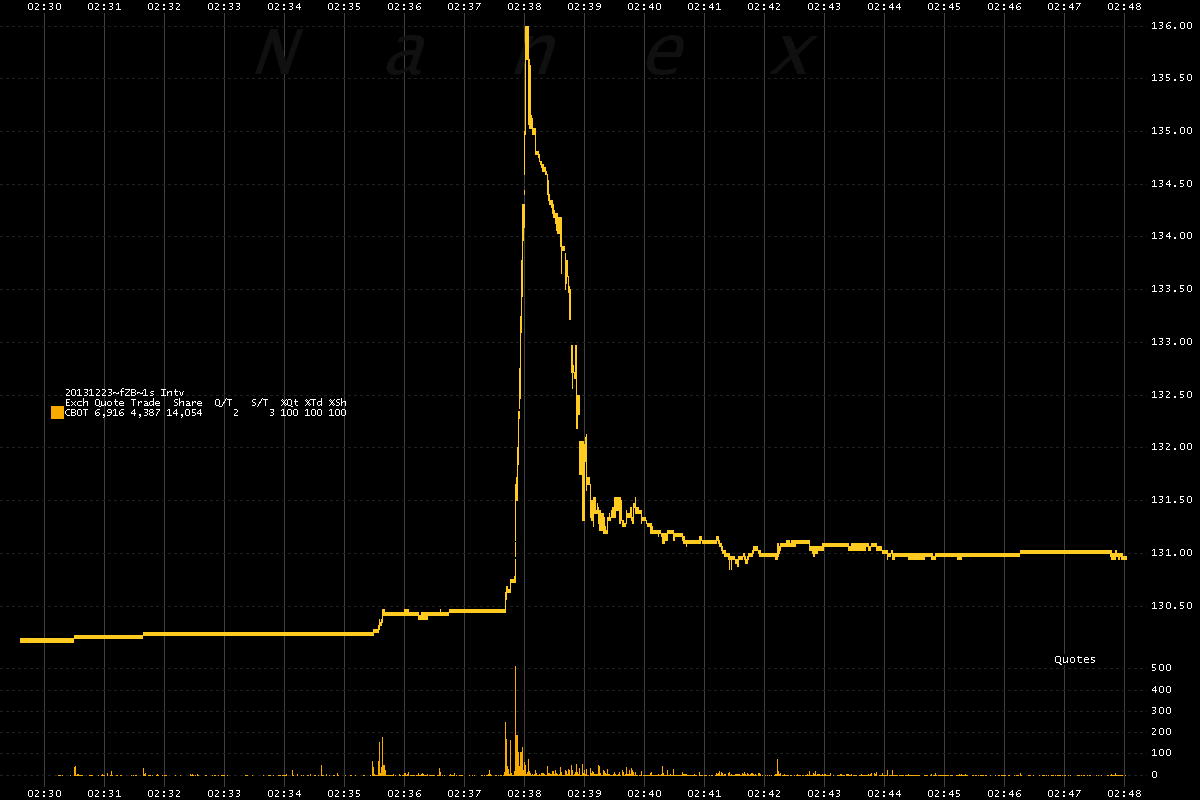
And the still showing the bid-ask dissolves…
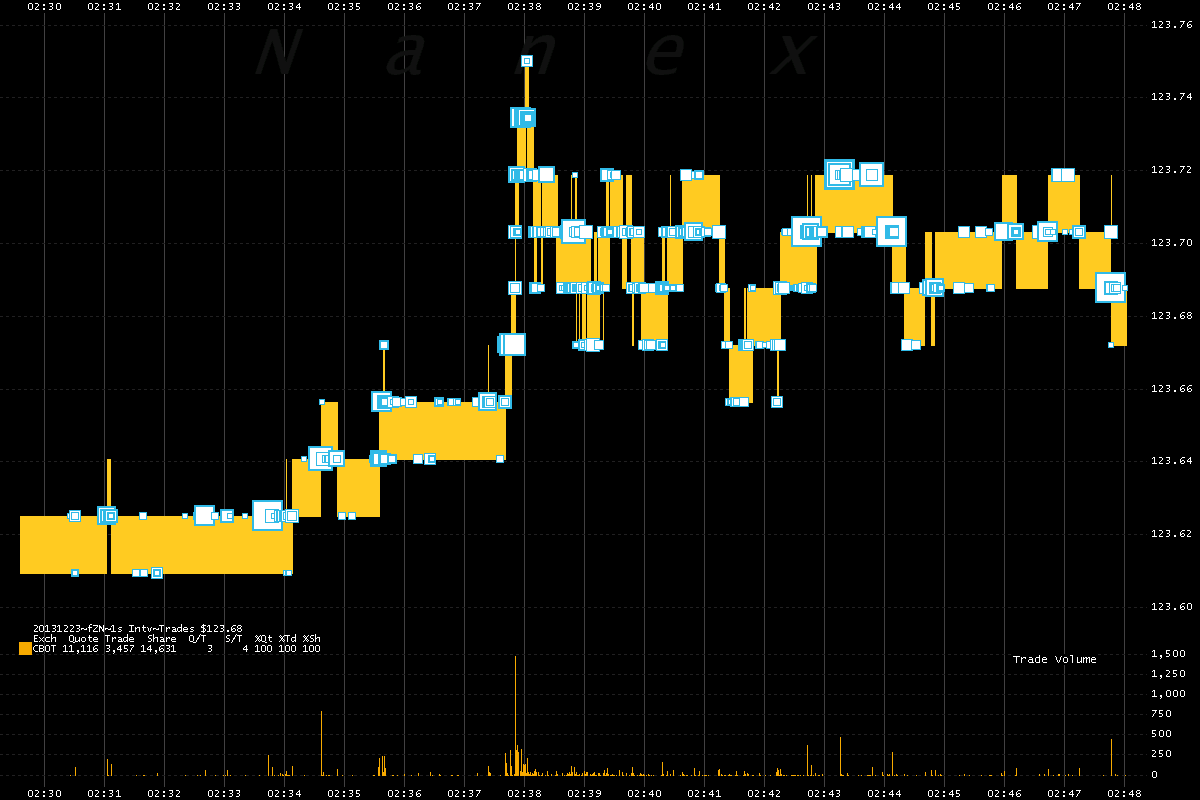
and the full break-down as multiple contracts were affected…
On December 23, 2013 at 2:37:51, Treasury Futures skyrocketed on heavy volume! Specifically, the March 2014 contract for the 30-Year (ZB), the 30-Year Ultra (UB), the 10-Year (ZN) and spread between the two (NOB). In 10 seconds, the 30-Year T-Bond moved 5 handles – the equivalent of the high-low range of the last 3 months.
1. March 2014 30YR T-Bond (ZB) Futures
2. March 2014 30YR T-Bond (ZB) Futures. Zooming in on 18 minutes of time.
3. March 2014 30YR T-Bond (ZB) Futures – showing quotes.
4. March 2014 10YR T-Note (ZN) Futures.
5. March 2014 10YR T-Note – 30YR T-Bond (NOB) Futures.
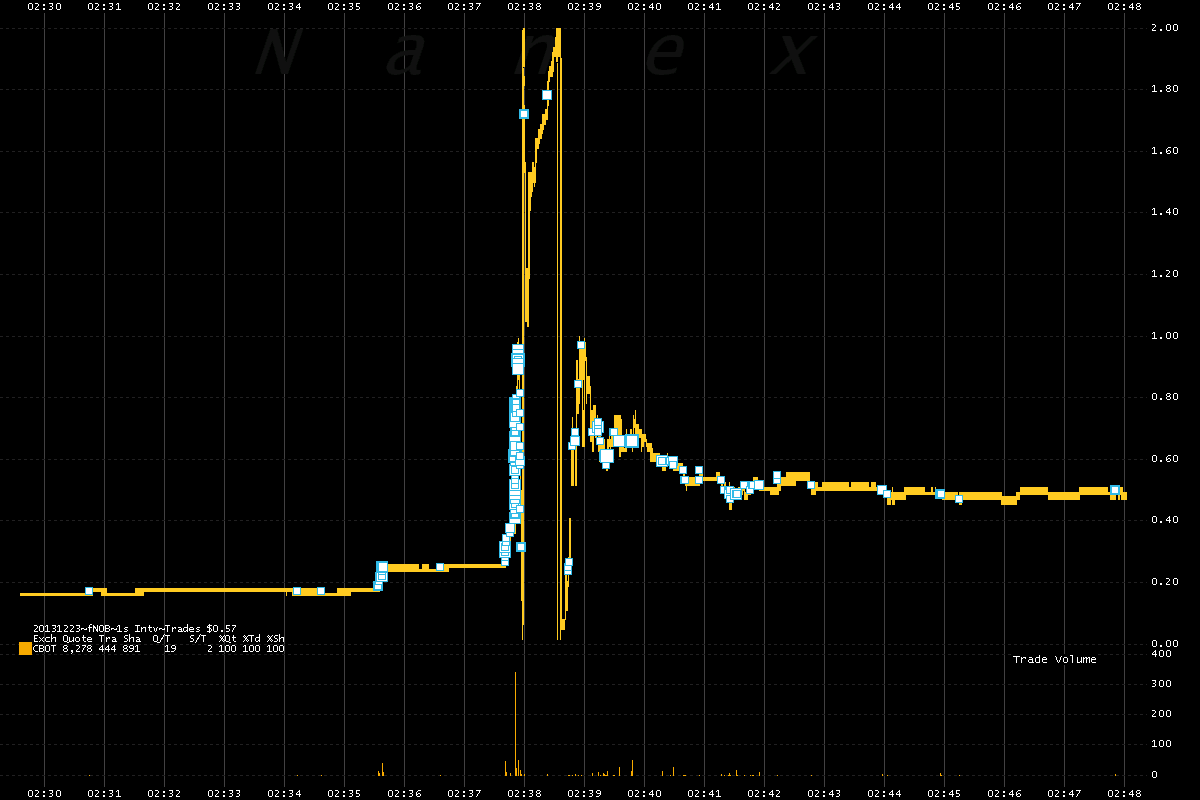
6. March 2014 30YR Ultra T-Bond (UB) Futures.
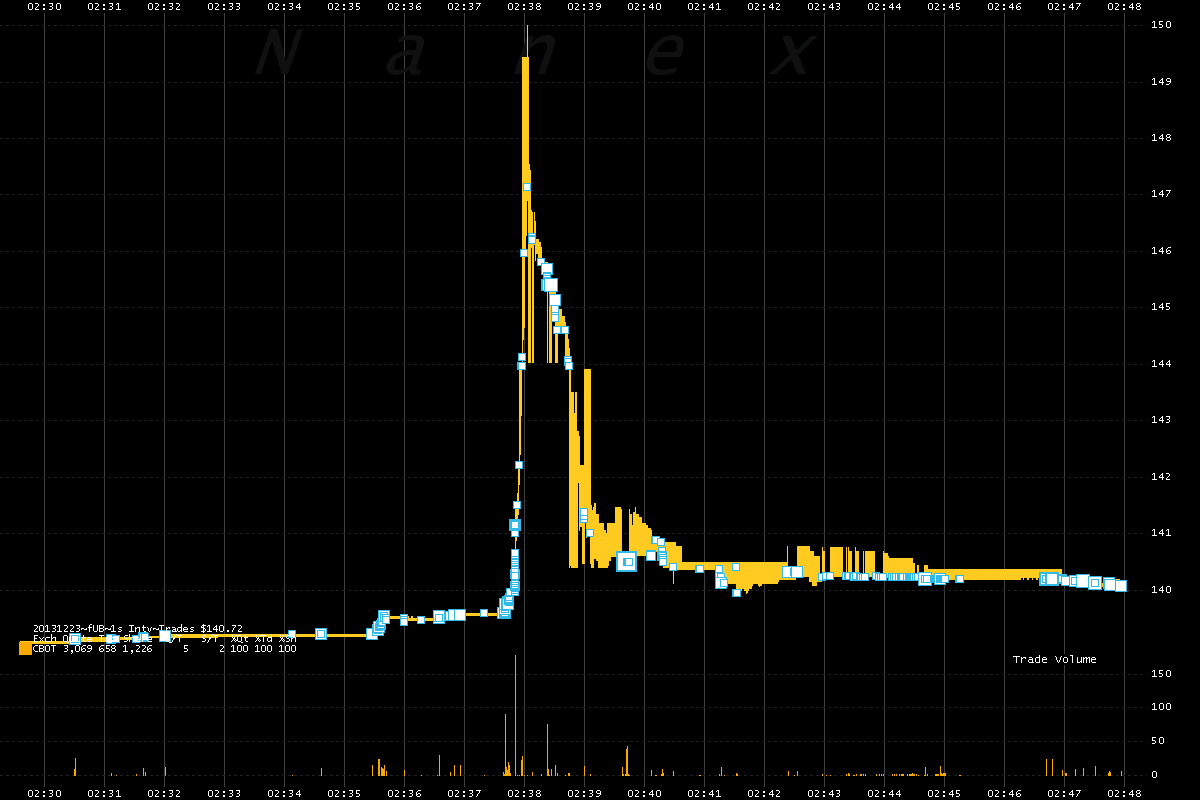
7. March 2014 30YR Ultra T-Bond (UB) Futures. Zooming to 27 seconds of time.
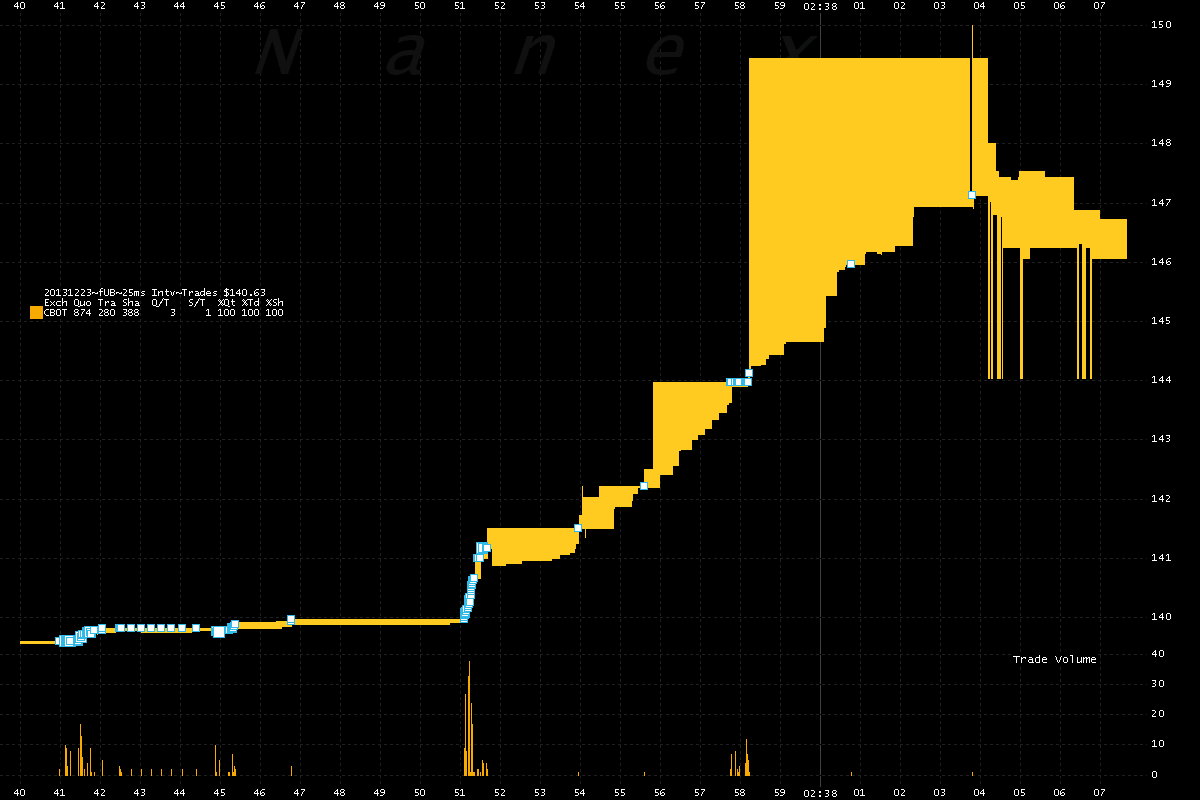
8. March 2014 30YR T-Bond (ZB) Futures. Zooming to 27 seconds of time.
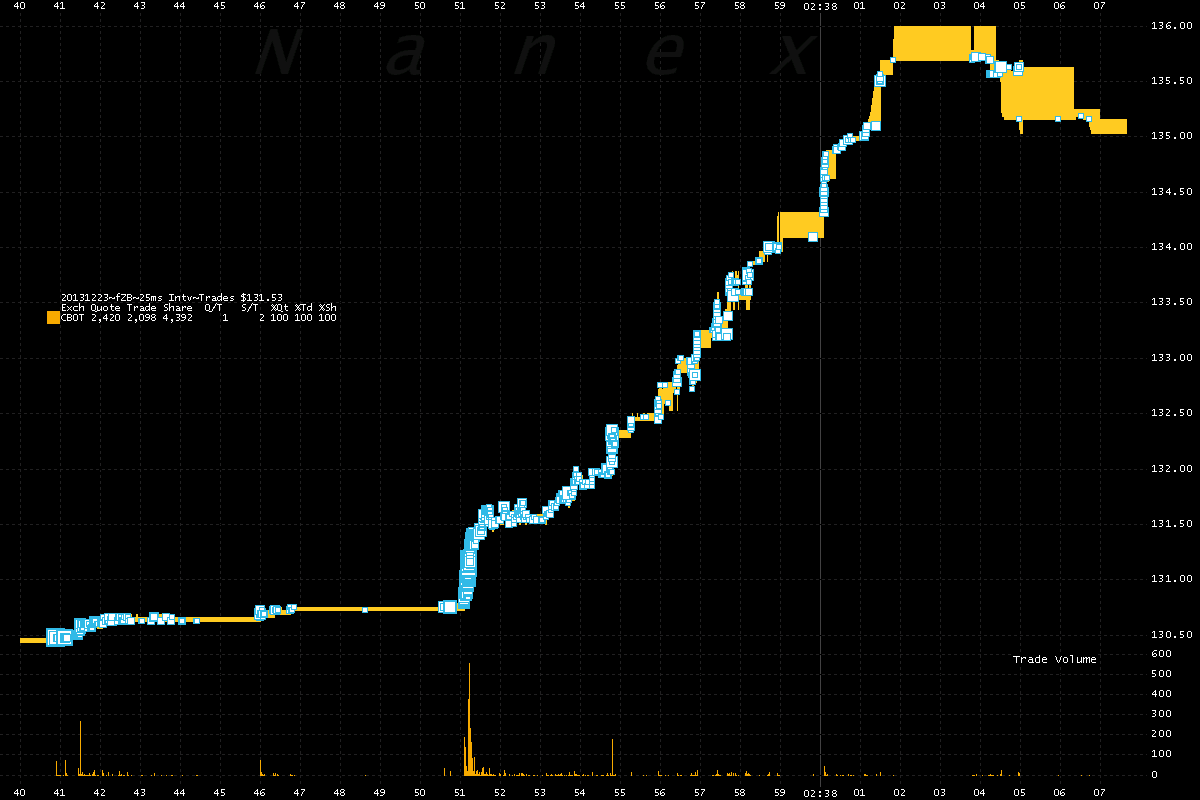
9. March 2014 10YR T-Note (ZN) Futures during same time period as charts 7-8 above.
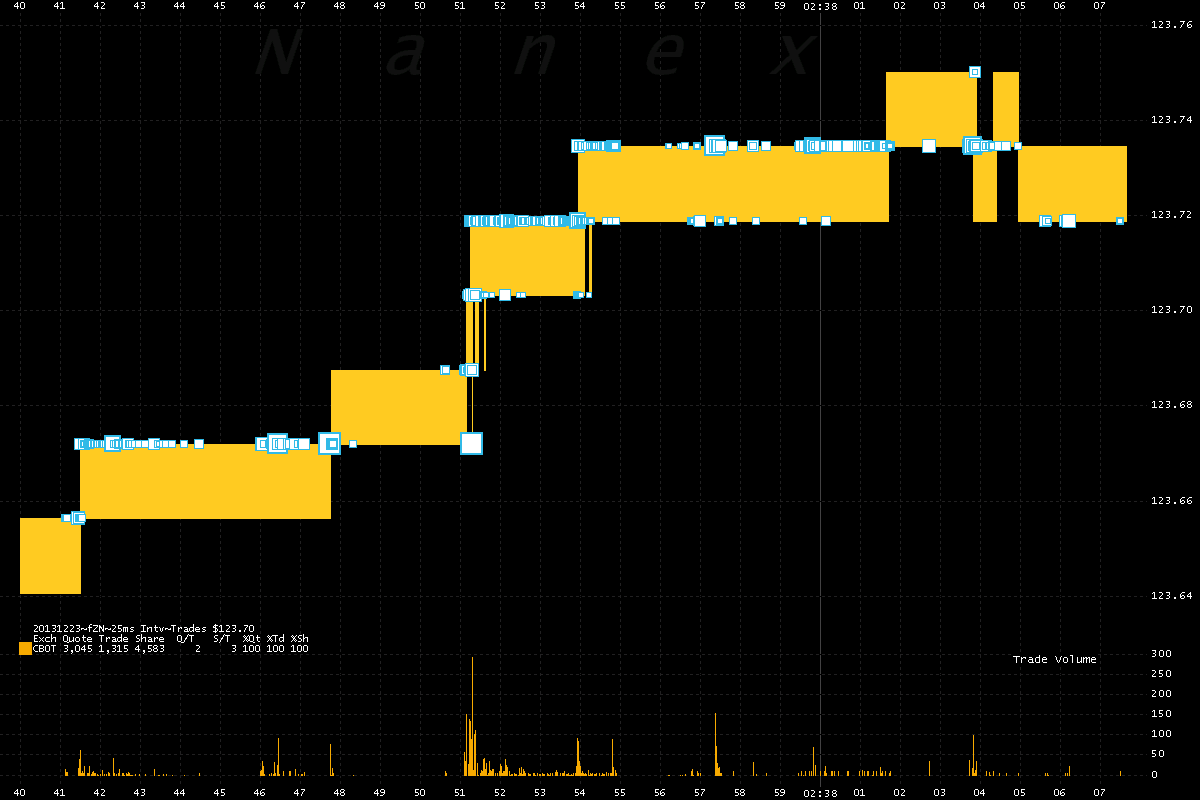
10. March 2014 10YR T-Note – 30YR T-Bond (NOB) Futures during same time period as charts 7-9 above.
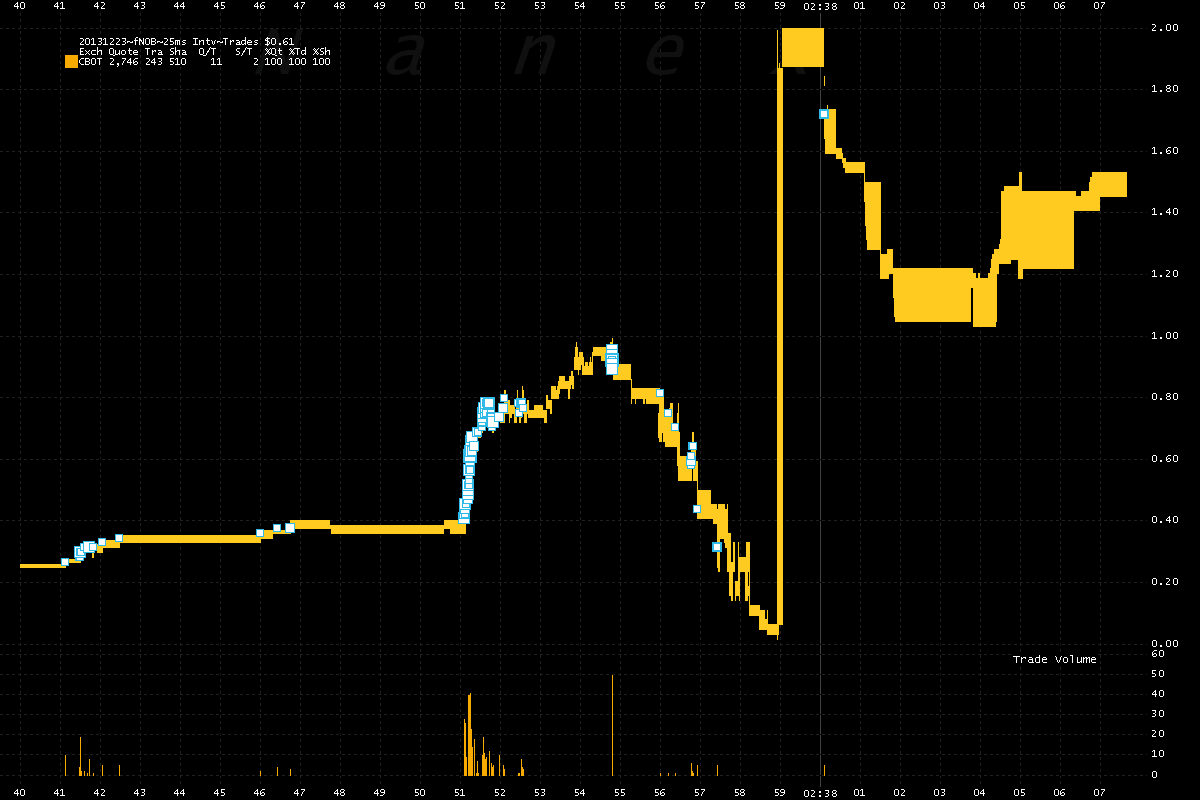
Source: Nanex
![]()
via Zero Hedge http://feedproxy.google.com/~r/zerohedge/feed/~3/nYAljDrZPiY/story01.htm Tyler Durden


