Something needs to be said. We are against the existence of irredeemable paper currency, central banking and central planning, cronyism, socialized losses and privatized gains, counterfeit credit, wealth transfers and bailouts, and welfare both corporate and personal.
When we write to debunk the conspiracy theories that say manipulation is keeping gold from hitting $5,000 (one speaker here at FreedomFest claimed gold will go to $65,000), we are not trying to defend the Fed. When we discuss the flaws in predicting that kind of price, and the error in expecting to profit from it, we are not expressing a pro irredeemable dollar view.
We are saying there are good arguments against the regime of irredeemable paper currency—but this is not one of them. Irredeemable currency has two fatal flaws. One is the interest rate is unhinged. It can skyrocket as it did from the end of WWII through 1980, or collapse as it has been doing since then. Two is there is no extinguisher of debt. Debt grows—must necessarily grow—exponentially. As it has been doing for many decades.
The antidote to this poisonous system is the gold standard. However, it must be said that no gold price will cause the metal to circulate in the economy. It did not circulate when it was “cheap” 20 years ago. It did not circulate when it was “expensive” 6 years ago. It does not circulate now. It will not circulate even if it hits any of the gold bug price targets (if anything, a rapid price rise will be a powerful force keeping it out of circulation, as most people would have large taxable capital gains).
The one thing that can make gold circulate is interest.
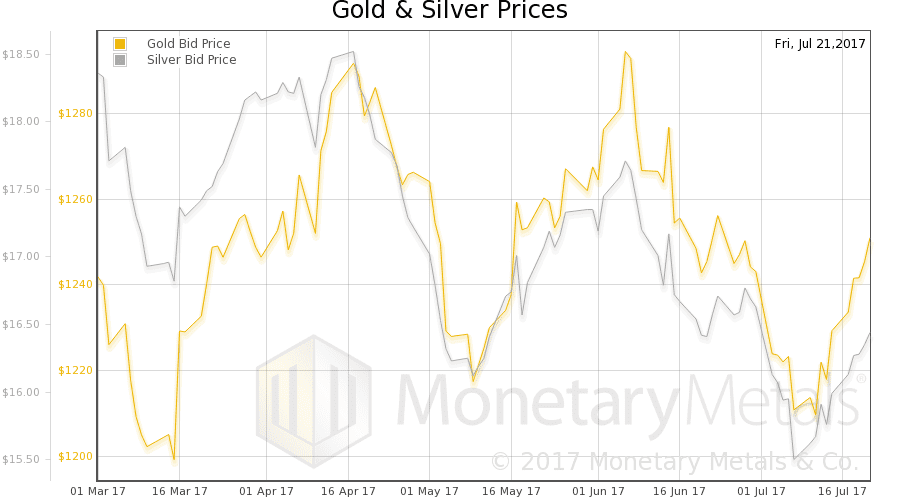
For two weeks, we have been talking about a potential capitulation. The gold price has risen about $40 since then, and that of silver 85 cents.
Will the bounce continue? Have the fundamentals firmed up?
We will show graphs of the true measure of the fundamentals. But first charts of their prices and the gold-silver ratio.
Next, this is a graph of the gold price measured in silver, otherwise known as the gold to silver ratio. The ratio moved down this week.
In this graph, we show both bid and offer prices for the gold-silver ratio. If you were to sell gold on the bid and buy silver at the ask, that is the lower bid price. Conversely, if you sold silver on the bid and bought gold at the offer, that is the higher offer price.
For each metal, we will look at a graph of the basis and cobasis overlaid with the price of the dollar in terms of the respective metal. It will make it easier to provide brief commentary. The dollar will be represented in green, the basis in blue and cobasis in red.
Here is the gold graph.
We have switched to the October contract, as the August is nearing expiry and under selling pressure.
The dollar fell this week (the mirror image of the rising price of gold). As the dollar fell, the cobasis fell—gold became less scarce.
Our calculated gold fundamental price fell a few bucks (chart here).
Now let’s look at silver.
As the dollar has dropped, the cobasis has come down (though still backwardated). Our calculated silver fundamental fell 25 cents to $17.59.
© 2017 Monetary Metals
via http://ift.tt/2vQrHQ5 Monetary Metals