The U.S. economy is booming, right?
Republicans think President Trump deserves much of the credit for cutting business and individual tax rates combined with a deregulation agenda. And Democrats believe former President Obama deserves ownership for America’s recovery. Regardless of who gets credit, HowMuch.net’s newest visualization of net compensation levels for American workers demonstrates that the economy is indeed delivering, but not for as many people as the headlines would have you believe…
Source: HowMuch.net
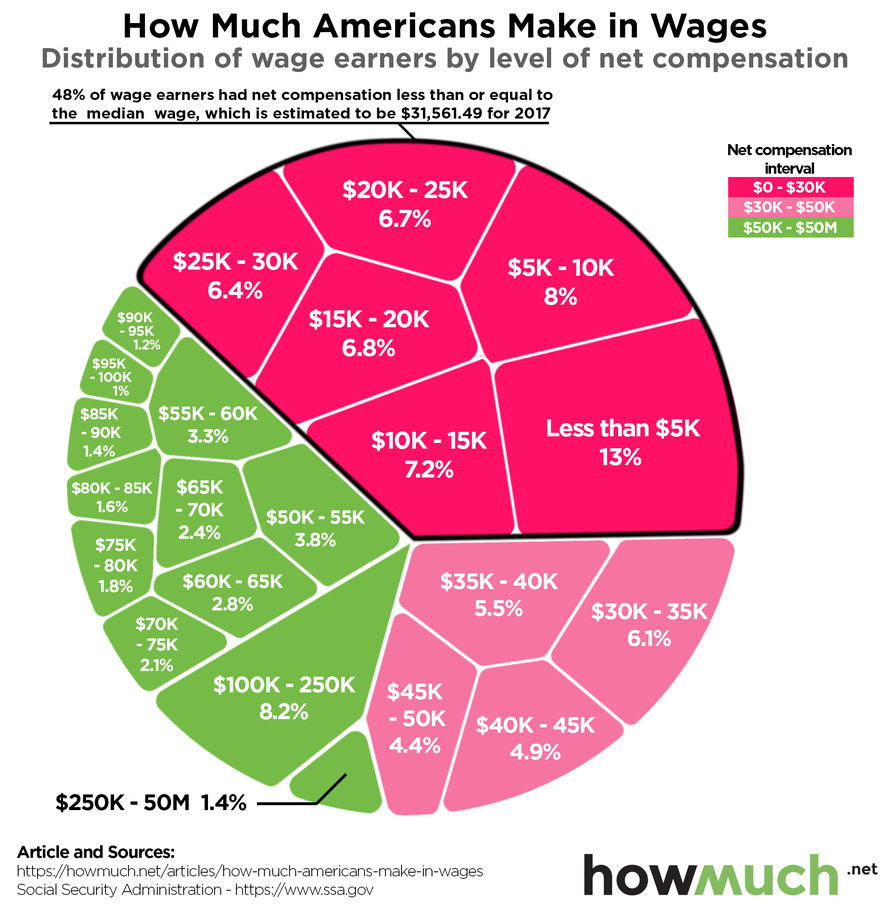
The Social Security Administration (SSA) tracks net income numbers after taxes through the Average Wage Index (AWI). We broke the AWI into a three-part hierarchy of $5K increments, letting you easily see the reality of income inequality in the U.S.. Astonishingly, 13% of workers make less than $5K, and nearly half, or 48%, take home $31,561 or less in net compensation (the dark red on our visual). If your mind isn’t spinning yet, consider the fact that these numbers are all after a multi-year economic recovery. The U.S. is allegedly at or near full employment but wages are barely growing, meaning these numbers are probably the best case scenario. Imagine what a recession would do to worker paychecks.
There is one important caveat to keep in mind when thinking about our dataset. The SSA numbers include any wage earners whatsoever, even part-time workers like students and teenagers. If the worker reports his or her income to the IRS on a W2 form, he or she is included in these stats. This drags down the aggregate wage numbers for full-time working adults, which reach $61,372 for households last year.
All that being said, the picture is still depressing. 1.4% of workers make between $250K – 50M, and another 8.2% bring home between $100K – 250K. Remember, these numbers reflect individual earners, meaning they don’t take into account household earnings. We mention this only because wealthy people tend to get married at higher rates than poor people. In other words, wage earners at the top of the income ladder are probably much wealthier than even these numbers would suggest since their spouses are generally highly educated and well-compensated too.
The visualization makes it plain to see that most people take home very little money from their jobs. The federal poverty level for a family of 4 is $25,100, which officials believe is the bare minimum needed to purchase subsistence food, clothing and shelter. To put this another way, the visualization indicates that enormous chunks of the workforce make a substandard wage, putting them at extreme risks if unpredictable financial problems occur.
Want to learn more about the true cost of living in your city? Check out HowMuch.net’s dynamic tool.
Data: Table 1.1
via RSS http://bit.ly/2Fq719S Tyler Durden
