Submitted by Eric Peters, CIO of One River Asset Management
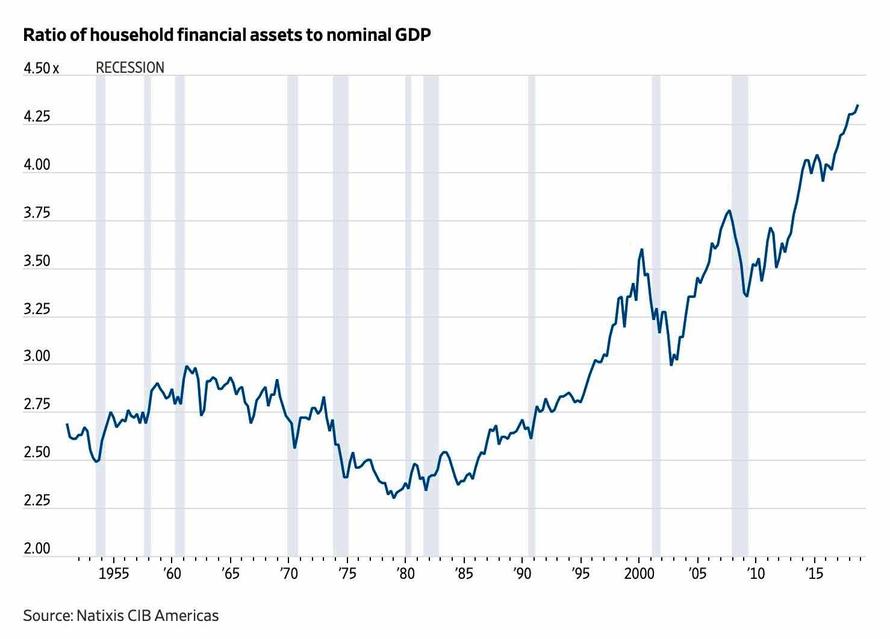
The ratio of US household financial assets to GDP has never been higher. Today, that ratio stands at 4.4x. In 1979 at the dawn of history’s greatest secular bull market, it was 2.3x (roughly half of where it is today). A decade later, in 1989, it was 2.7x. In the 1999 dot com bubble the ratio jumped to 3.6x. At the 2009 bear market lows, it was 3.4x. And in these past 10yrs, as the ratio jumped to 4.4x, households increased their financial assets by an amount equal to 1x US GDP. Which is $21trln. If you didn’t own/buy any assets, tough luck, you missed out.
As the value of household financial assets relative to GDP surged to historic highs over the past decade, the quantity of US equities shrank. Yet the supply of so many other things expanded during the decade. US gov’t debt grew 115% to $21.5trln, household debt jumped 49% to $4trln, and corporate debt increased by 78% to $6.3trln. But while corporations borrowed $2.8trln, the net supply of US equities contracted by $3.8trln, as CEOs borrowed money and diverted profits to repurchase their shares in quantities that dwarfed new issuance.
CEOs are paid in shares, so they naturally buy them back. But that’s not the only way to boost their value. Expanding earnings does it too – increasing revenues, cutting costs, lifting profit margins. Profit margins grew from 10% at the 2007 peak to today’s 12.5% record highs (and 6% in 1979). Reducing the tax you pay also helps. In the past decade over 20 companies redomiciled to reduce their tax burden. Countless other opaque structures helped lessen tax payments too. Then they got a huge tax cut. It’s been an extraordinary decade.
Another powerful way to lift equities is to reduce the discount rate that investors use to value them. Every major global central bank did just that. Over the decade, central banks cut rates to zero and below. Their balance sheets grew by over $14trln through printing money, further depressing yields and in some cases buying stocks directly. Wealth and income inequality naturally rose, achieving levels last seen in the late-1920s. In the 4 decades since 1979, Labor’s share of US national income fell inexorably from 64% to today’s 57%. Capital receives the rest.
Americans all want to get rich. We understand risk/reward. We also get right/wrong, fairness, justice. In the past decade, virtually everyone who took reckless risk got bailed out. Practically no one at the center of the greatest financial fiasco since the Great Depression went to jail. This undermined faith in the fundamental relationship between reward/risk, wrong/right, fairness, justice. Capitalism. To top it off, American labor read in the newspapers that US public pensions – despite 10yrs of equity gains that made others rich – were underfunded by $6trln.
Anecdote:
Let’s go back a decade, I told the CIO. We were discussing where to put money for the coming years. Most often investors look backward for trends and extrapolate their trajectories into the future, or they search for beaten down assets, hoping for mean reversion. But what should you do after a year where nearly everything declined? Treasury bills outperformed virtually all assets last year.
Such broad outperformance happened only in the early-1980s under Volcker, during the Great Depression, and at the outset of WWI. So before thinking about what to buy, it’s important to explore why such a rare event happened and what it might mean.
Imagine we were talking in 2009 and could foresee the decade to come:
- The household financial asset-to-GDP ratio would hit a record 4.4x.
- Corporations would borrow $2.7trln.
- Buybacks would shrink the supply of US equities by $3.8trln.
- Profit margins would hit historic highs.
- Labor’s share of national income would decline to record lows.
- Central banks would bail out overleveraged speculators and amplify economic inequality.
- Tax policy would favor redomiciling.
- Politicians would hold no one to account for wrongdoing.
- Despite the historic rise in wealth, worker’s pensions would remain underfunded by $6trln.
And as people lose faith in the system, there would be a dramatic political shift that catches the beneficiaries of these trends by utter surprise. It would be a protest vote. It would be a vote to redistribute the economic pie. To slash corporate profit margins. This trend would go global. And if we had known all this in 2009, would we have expected the trends and investment strategies that would dominate up through 2019 to then extend beyond? Or would we have expected them to face profound challenges?
And so today, shouldn’t we look to those strategies that have performed worst to begin to perform best?
via RSS http://bit.ly/2FqmN5s Tyler Durden
