Authored by Michael Lebowitz via RealInvestmentAdvice.com,
If you haven’t heard about Modern Monetary Theory, or “MMT” for short, by now, you will soon. It is highly likely that MMT will be increasingly touted by economists and politicians from both sides of the aisle, as the economic prescription, even panacea, to cure our economic ills. Regardless of your view, MMT will have large effects on all asset classes, so we urge you to read this article, and others, describing this economic theory.
Kevin Muir recently penned an article “Everything You Wanted To Know About MMT” which delves into what MMT proposes to be. To wit:
“Modern Monetary Theory is a macroeconomic theory that contends that a country that operates with a sovereign currency has a degree of freedom in their fiscal and monetary policy which means government spending is never revenue constrained, but rather only limited by inflation.”
Kevin goes on to summarize the basic policy implications of MMT:
“Sure, the government owes dollars, but they have a monopoly of creating those dollars, and not only that, the creation of more and more dollars is essential to the functioning of the economy.
Here are the policy implications of accepting MMT:
governments cannot go bankrupt as long as it doesn’t borrow in another currency (sovereign currency issuer)
it can issue more dollars through a simple keystroke in the ledger (much like the Fed did in the Great Financial Crisis)
it can always make all payments (can print money to pay debts)
the government can always afford to buy anything for sale
the government can always afford to get people jobs and pay wages
government only faces two different kinds of limitations; political restraint and full employment (which causes inflation)
The government can keep spending until they begin to crowd out the private sector and compete for resources.”
So, there you have it.
Debts and deficits do not really matter as long as the Government can print the money it needs to pay for what it wants to pay for.
In other words:
“Deficits are self-financing, deficits push rates down, deficits raise private savings.” – Stephanie Kelton
That is the “you can have your cake and eat it too” theory in a nutshell.
It Sounds Great, But…
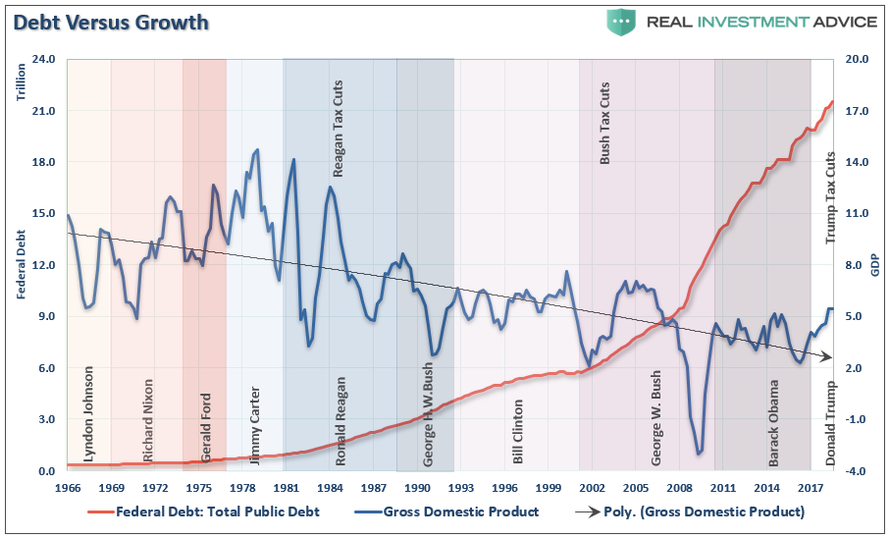
Since 1980, the Government has already been running a “quasi-MMT” program from which we can actually see how effective it has been.
The Inflation Conundrum
As Ms. Kelton suggests in her theory, the only constraint on MMT is inflation. That constraint would come as, the theory purports, full employment which would cause inflationary pressures to rise. Obviously, at that point, the government could/would reduce its support as the economy would be theoretically self-sustaining.
This is why a “Job Guarantee” program, which aims to keep the unemployment rate a hair above the rate at which inflation picks up, is an essential part of the theory which supposedly solves the problem of full employment and price stability.
However, this leads to a couple of questions.
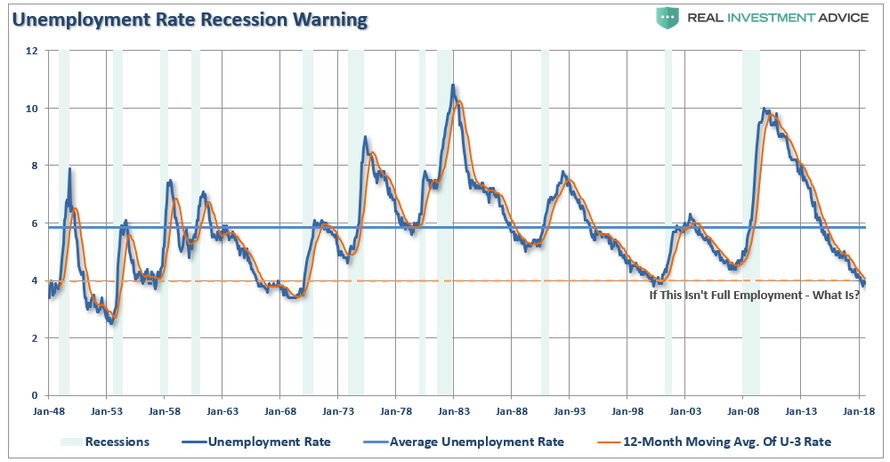
How exactly does MMT define full employment? Is this not it?
But, even with the unemployment rate approaching the lowest levels in history, there has been scant evidence of inflation. Wages have ticked up recently, but overall the broadest measures of inflation remain suppressed which gives MMT the cover it needs to issue more currency.
But, exactly how should MMT measure inflation?
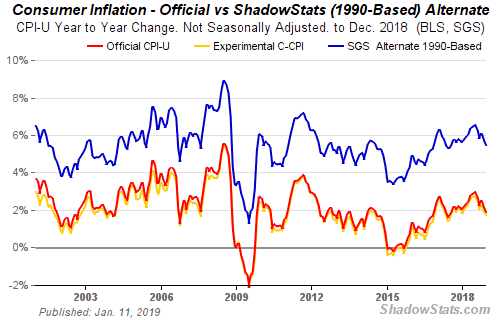
Prior to 1998, inflation was measured on a basket of goods. However, during the Clinton Administration, the Boskin Commission was brought in to recalculate how inflation was measured. Their objective was simple – lower the rate of inflation to reduce the amount of money being paid out in Social Security.
Since then, inflation measures have been tortured, mangled, and abused to the point where it scarcely equates to the inflation that consumers deal with in reality. For example, home prices were substituted for “homeowners equivalent rent,” which was falling at the time, and lowered inflationary pressures, despite rising house prices.
Since 1998, homeowners equivalent rent has risen 72% while house prices, as measured by the Shiller U.S. National Home Price Index has almost doubled the rate at 136%. Needless to say, house prices which currently comprise almost 25% of CPI has been grossly under-accounted for. In fact since 1998 CPI has been under-reported by .40% a year on average. Considering that official CPI has run at a 2.20% annual rate since 1998, .40% is a big misrepresentation.
There is also a measure called “hedonics” which is used to account for the change of value of a particular good over time. As an example think computers which are significantly more powerful (valuable). The additional power of modern computers means consumers are getting more their money than in prior years, hence paying less according to inflation calculations.
Some hedonics make sense, like computers, but many do not. Can you apply the same logic to High-Def TVs? Unlike the computer, TV’s serve no economic benefit. Should inflation measures be reduced because you now have a 50-inch flat screen versus a 32-inch one? We say no.
Regardless of what we think, innovation of televisions, along with the exportation of labor, has lowered stated inflation rates.
As noted above, in 1990 inflation was measured by the change in price of a basket of goods. The chart below compares inflation today measured with both the 1990 computations and current ones.
The point here is, whether you agree with the calculations, weightings and hedonics, or not, the measure of inflation MUST be clearly defined if it is to be the governor of economic policy.
It currently isn’t.
Deficits Are Not Self-Financing
Assuming we can get the inflation equation worked out, there is a larger problem with MMT which needs to be addressed.
The premise of MMT is that government “deficit” spending is not a problem because the spending into “productive investments” pay for themselves over time.
But therein lies the problem – what exactly constitutes “productive investments?”
For that answer we can turn to Dr. Woody Brock, an economist who holds 5-degrees in math and economics and is the author of “American Gridlock” for the answer.
“The word ‘deficit’ has no real meaning.
‘Country A spends $4 Trillion with receipts of $3 Trillion. This leaves Country A with a $1 Trillion deficit. In order to make up the difference between the spending and the income, the Treasury must issue $1 Trillion in new debt. That new debt is used to cover the excess expenditures, but generates no income leaving a future hole that must be filled.
Country B spends $4 Trillion and receives $3 Trillion income. However, the $1 Trillion of excess, which was financed by debt, was invested into projects, infrastructure, that produced a positive rate of return. There is no deficit as the rate of return on the investment funds the ‘deficit’ over time.’
There is no disagreement about the need for government spending. The disagreement is with the abuse, and waste, of it.
In order for government “deficit” spending to be effective, the “payback” from investments being made through debt must yield a higher rate of return than the interest rate on the debt used to fund it.
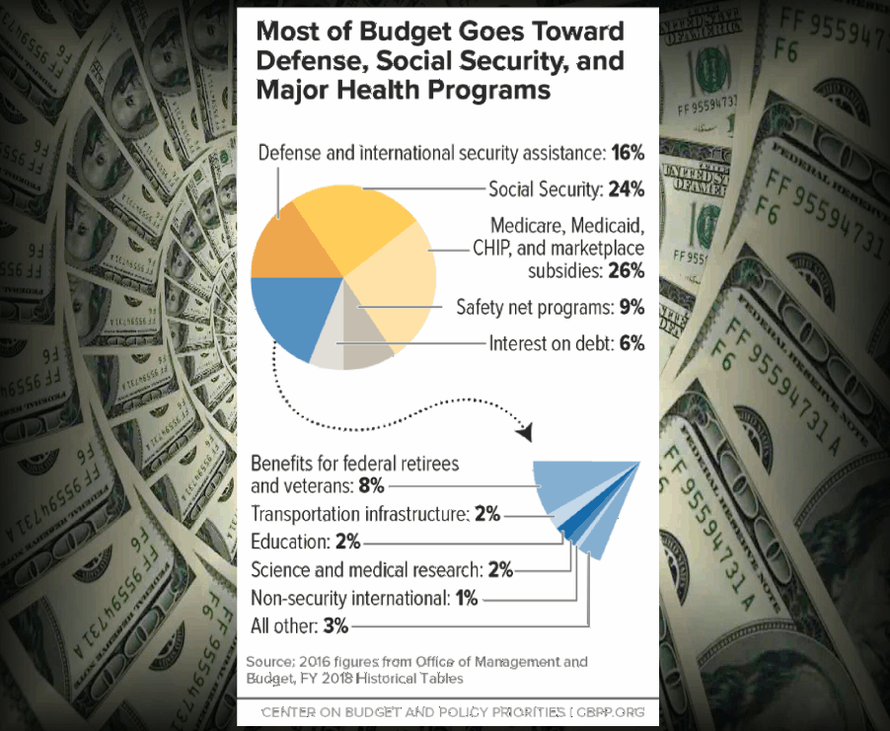
The problem, for MMT and as noted by Dr. Brock, is that government spending has shifted away from productive investments, like the Hoover Dam, that create jobs (infrastructure and development) to primarily social welfare, defense and debt service which has a negative rate of return.
According to the Center On Budget & Policy Priorities, nearly 75% of every tax dollar goes to non-productive spending.
In other words, the U.S. is “Country A.”
But there is also clear evidence that increasing debts and deficits DO NOT lead to either stronger economic growth or increasing productivity. As Michael Lebowitz recently showed:
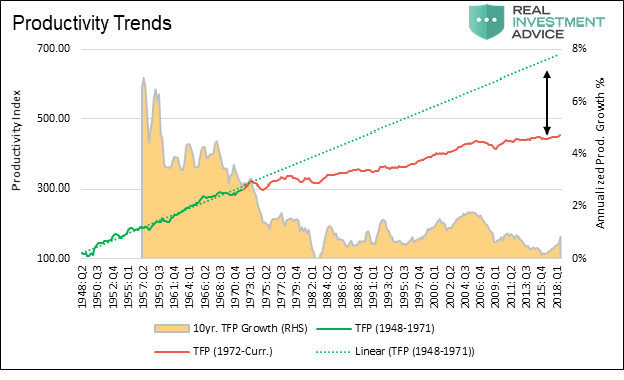
“Since 1980, the long term average growth rate of productivity has stagnated in a range of 0 to 2% annually, a sharp decline from the 30 years following WWII when productivity growth averaged 4 to 6%. While there is no exact measure of productivity, total factor productivity (TFP) is considered one of the best measures. Data for TFP can found here.
The graph below plots a simple index we created based on total factor productivity (TFP) versus the ten-year average growth rate of TFP. The TFP index line is separated into green and red segments to highlight the change in the trend of productivity growth rate that occurred in the early 1970’s. The green dotted line extrapolates the trend of the pre-1972 era forward.”
“The graph below plots 10-year average productivity growth (black line) against the ratio of total U.S. credit outstanding to GDP (green line).”
“This reinforces the message from the other debt related graphs – over the last 30 years the economy has relied more upon debt growth and less on productivity to generate economic activity.
Given the finite ability to service debt outstanding and aforementioned demographic challenges, future economic growth, if we are to have it, will need to be based largely on gains in productivity. Current economic circumstances serve as both a wet blanket on economic growth and are clearly weighing on productivity by diverting capital away from productive uses in order to service that debt.
Ill-conceived policies that impose an over-reliance on debt and demographics have largely run their course.”
But, as I stated at the beginning of this missive, the U.S. Government has been running a “Quasi-MMT” program since 1980.
Let’s take a look at the results of how rising debts and deficits have benefited economic prosperity.
Deficits Don’t Promote Growth Or Savings
As noted above, since the bulk of the debt issued by the U.S. has been unproductively squandered on increases in social welfare programs and debt service, there is a negative return on investment. Therefore, the larger the balance of debt becomes, the more economically destructive it is by diverting an ever growing amount of dollars away from productive investments to service payments.
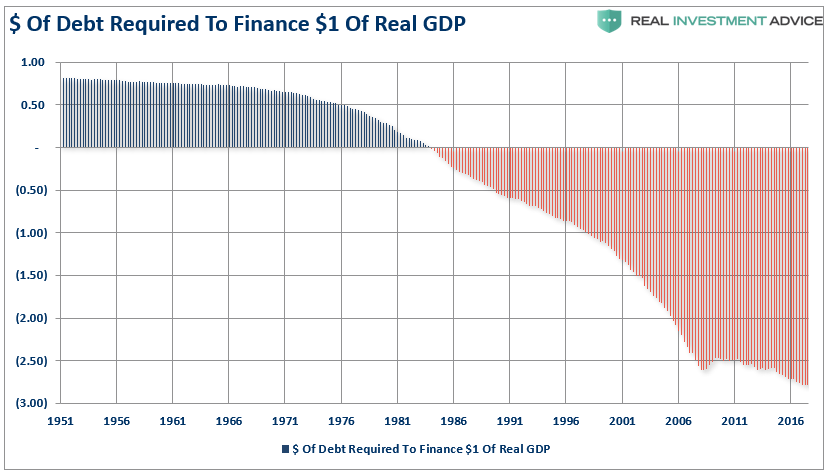
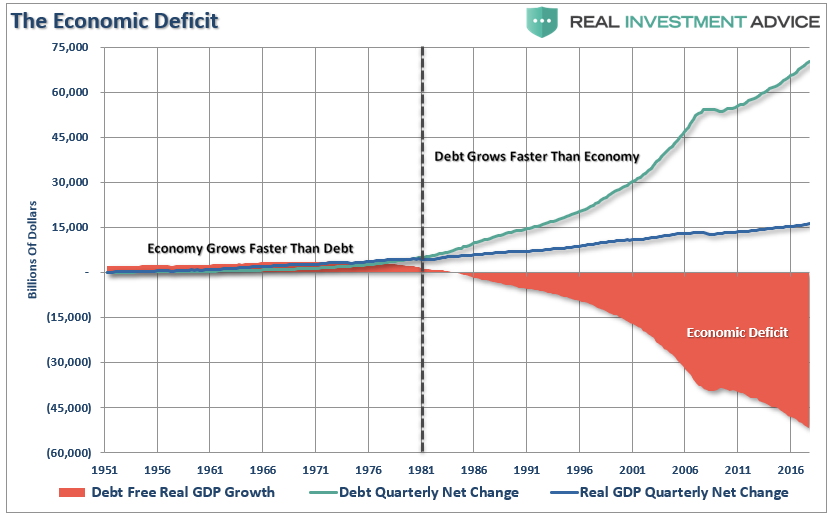
The relevance of debt growth versus economic growth is all too evident as shown below. Since 1980, the overall increase in debt has surged to levels that currently usurp the entirety of economic growth. With 10-year average economic growth rates near the lowest levels on record, the growth in debt continues to divert more tax dollars away from productive investments into the service of debt and social welfare.
It now requires nearly $3.00 of debt to create $1 of economic growth.
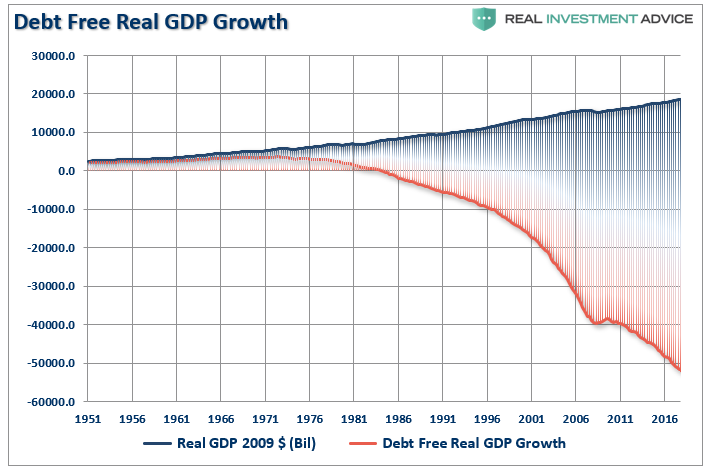
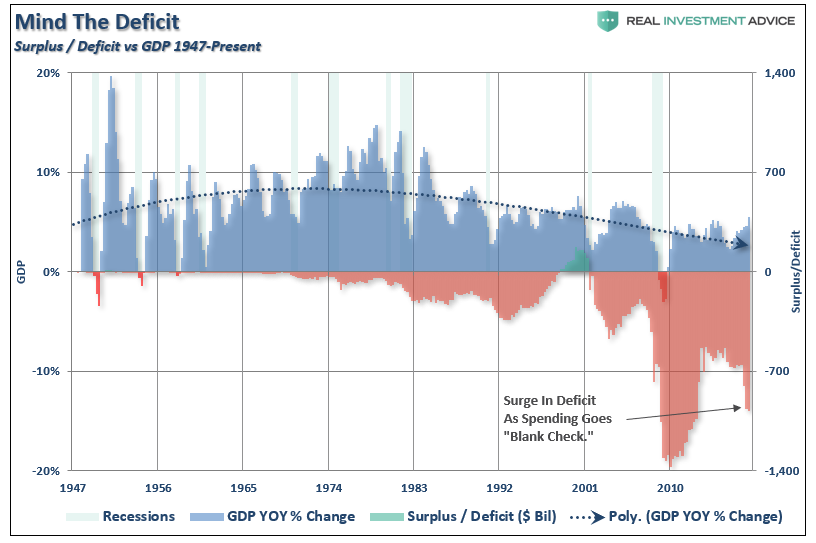
Another way to view the impact of debt on the economy is to look at what “debt-free” economic growth would be. In other words, without debt, there has actually been no organic economic growth.
For the 30-year period from 1952 to 1982, the economic surplus fostered a rising economic growth rate which averaged roughly 8% during that period. Today, with the economy expected to grow at just 2% over the long-term, the economic deficit has never been greater and unfortunately growing rapidly.
What is indisputable is that running ongoing budget deficits that fund unproductive growth is not economically sustainable long-term.
MMT Provides The Cover
Over the last 40-years the U.S. economy has engaged in increasing levels of deficit spending without the results promised by MMT.
This unsustainable credit-sourced boom led to artificially stimulated borrowing which pushed money into diminishing investment opportunities and widespread mal-investment. In 2007, the consequences played out “real-time” in everything from sub-prime mortgages to derivative instruments which were created only for the purpose of creating more questionable investment opportunities. Today, we see it again in accelerated stock buybacks, low-quality debt issuance, debt-funded dividends, and speculative investments.
When credit creation can no longer be sustained, the markets must clear the excesses before the next cycle can begin. It is only then, that resources can be reallocated back towards more efficient and productive uses.
The Undisclosed Cost and Our Two Cents
MMT has a cost that we have yet to hear about from its proponents.
The value of the dollar, like any commodity, rises and falls as the supply of dollars change. For instance if the government suddenly doubled the money supply, one dollar would still be worth one dollar but it would only buy half of what it would have bought prior to their action.
This is the flaw MMT supporters do not address. MMT is not a free lunch. MMT is paid for by reducing the value of the dollar and ergo your purchasing power. MMT is a hidden tax that it is paid by everyone holding dollars. The problem as Michael Lebowitz outlined in Two Percent for the One Percent, inflation tends to harm the poor and middle class while benefiting the wealthy.
Our fear is that MMT, which promises “free college,” “healthcare for all,” “free childcare,” and “jobs for all” with no consequences, instead delivers inflation, generates further wealth/income inequality, and ultimately greater levels of social instability and populism. Just as has been seen in every other country which has run such programs of unbridled debts and deficits.
While MMT sounds great at the conversational level, so does “communism” and “socialism.” In practice, the outcomes have been vastly different than the theory.
As Dr. Brock suggests:
“It is truly ‘American Gridlock’ as the real crisis lies between the choices of ‘austerity’ and continued government ‘largesse.’ One choice leads to long-term economic prosperity for all, the other doesn’t.”
via ZeroHedge News http://bit.ly/2GuSeer Tyler Durden
