Authored by Marc Orsley of PrismFP
- FF/IOER spread widening signaling potential Dollar funding/liquidity/shortage issues
- The move in Fed Funds is leading to a Dollar breakout and renewed EM stress
- Is the Fed Fund move that is driving all this just a temporary April 15th tax related issue, or is something more going on with FHLB’s?
- Prism’s model selects the structure to position for further Dollar liquidity stress
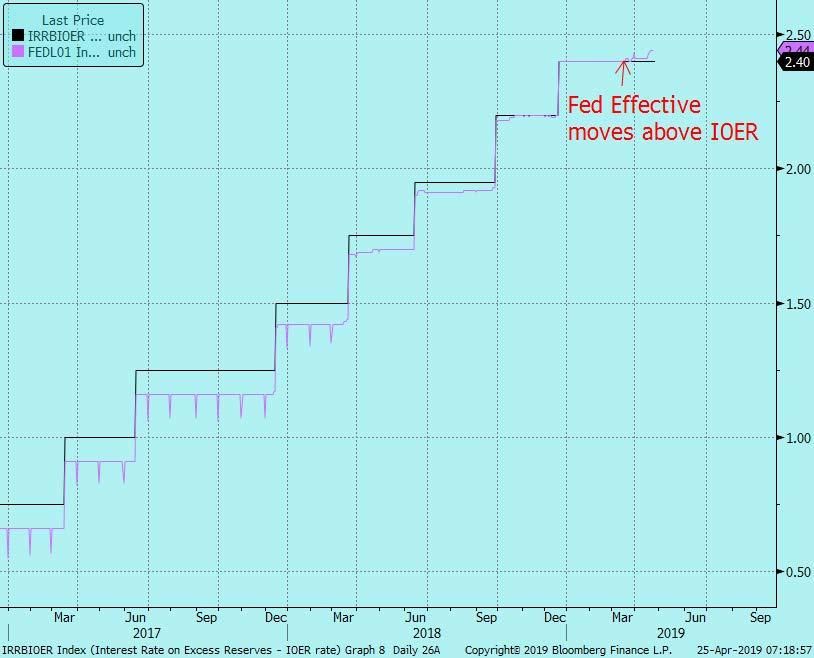
A funny *micro* thing happened on March 19th that is now leading to some interesting macro moves:
As you can see, Fed funds moving above IOER has been an anomaly through the hiking cycle as IOER acts as a ceiling to Fed Funds by design. So what is going on? The most common explanation is the April 15th tax deadline. You have seen money market funds sold, bank reserves dwindle which is indicative of folks tapping funds to pay their tax liabilities.
If that is right, I have two questions:
- Why didn’t this happen on April 15th any other year – it didn’t
- Why did it happen this year
This likely goes back to the theme that we spoke about in late January/early February that this tax season was going to be potentially more painful than previous as taxpayers didn’t withhold enough due to the new tax laws. Therefore, are we getting some sort of forward looking macro signal here with this FF/IOER spread widening? Is it bullish people needed to tap their MMF’s to pay taxes? Is it bullish that banks are willing to pay a higher rate now to secure more reserves?
A lot of questions, and there are some answers. Fed Funds moving higher is technically an act of tightening (note it is still within the Fed’s band so they haven’t lost control – yet). That tightening via higher money market rates has two repercussions I can see
- It is the primary cause of the Dollar moving higher and breaking out
- It is therefore risk negative as you are getting the duel rate and dollar tightening
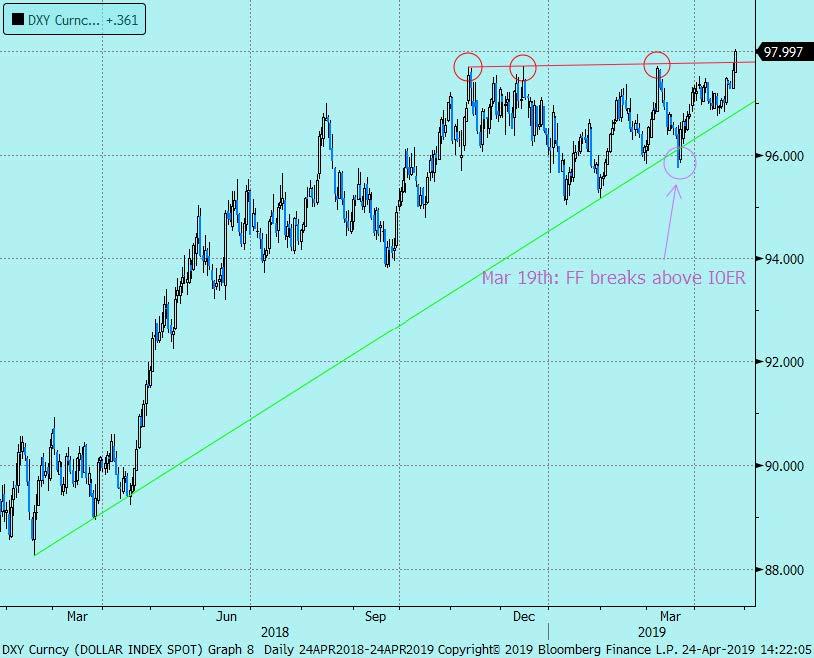
With regards to the Dollar, notice that the DXY almost broke down on March 19th, but instead based and turned higher.
Coincidence? I think not. In a world where many central banks are starting to get an increased amount of rate cuts priced into their forward rates (Canada, Australia, Sweden, Japan, et al) and, conversely, US Fed Funds are moving higher; its quite understandable why the Dollar is bid.
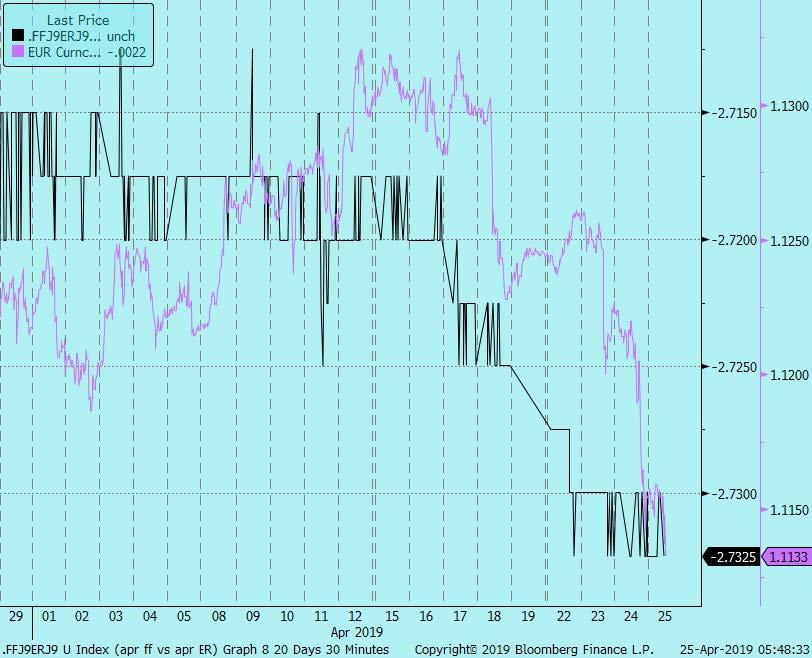
April US Fed Fund Future /April Euribor future spread vs. EUR/USD –> funding rate spreads foreshadowed this breakdown in the Euro….
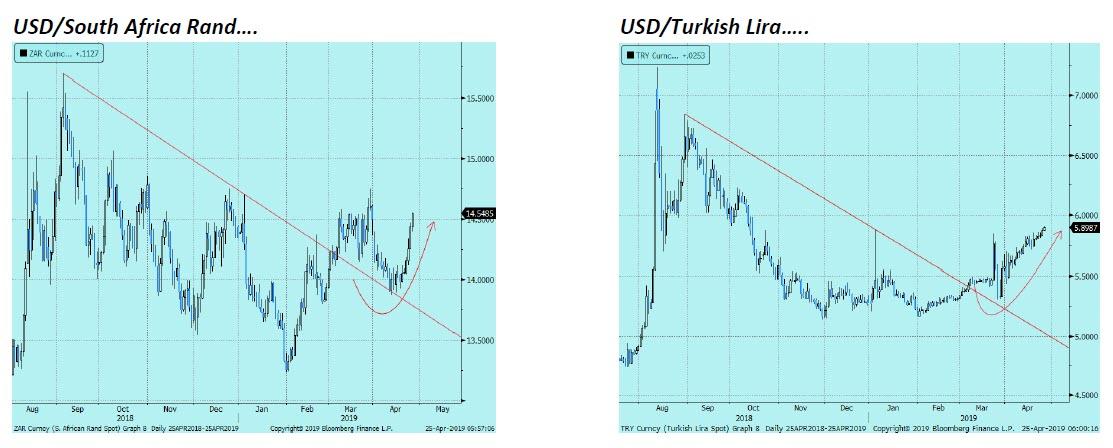
Now taking it a step further, this “funding crisis” + dollar shortage is obviously not an ideal situation for EM countries with current account deficits. Thus, you are seeing Dollar surging against the usual suspects.
With the effective tightening seen in the Fed Fund rate and the Dollar moving higher, it is therefore no wonder stocks, who have been in a world where nothing was wrong, started to turn irritable. Suddenly something is wrong.
Now the money market “experts” at the banks are saying this FF/IOER anomaly should be fixed in a matter of days. So in theory that should mean an easing in the Fed Fund rate, and then the Dollar, and then risk should go back on. In reality, no one really knows if this FF/IOER anomaly will actually be fixed soon or not.
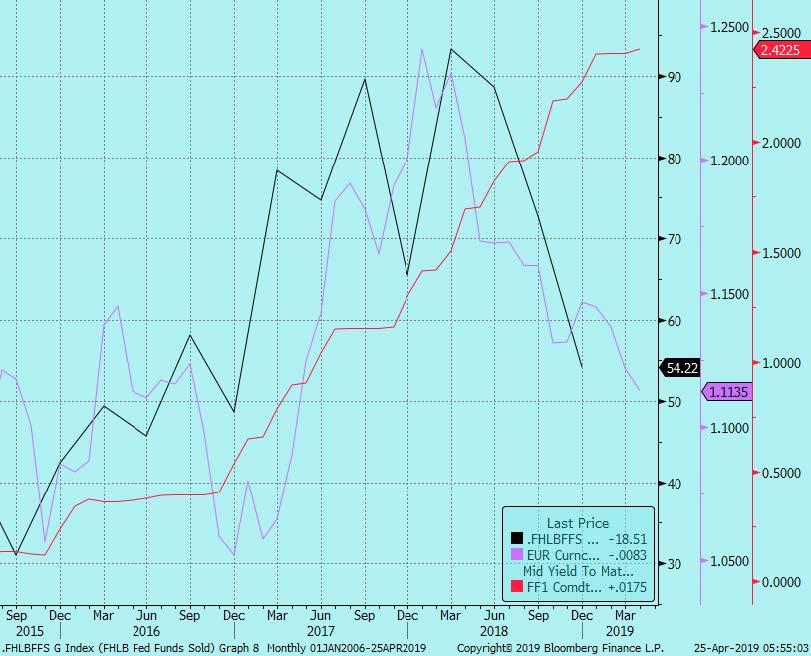
The risk is there is something more going on here other than the April 15th tax deadline theory. It is difficult to find real time data on this, but since 2H 2018, FHLB’s (who are the main providers of Fed Fund liquidity to the market) have sold much less FF’s to the market. You can see below that FHLB FF’s sold (black line) tends to lead Fed Fund futures (red line in yield terms) and the EUR/USD cross (purple line). It’s all connected…
The basic idea behind this chart is that there has been a dollar funding/shortage issue brewing under our nose for months; it is just coming to fruition now because we are noticing the DXY breaking out higher. In other words, with FHLB’s selling less FF’s, participants are forced to pay a higher rate to find funds, and that drives rate differentials towards the Dollar.
The next question becomes what will the Fed’s reaction function will be? There has to be some hand wringing inside 33 Liberty Street these days. The brewing speculation in the market is the Fed could cut the IOER rate in an effort to bring down the FF rate as well, something the Fed has indicated it could do previously (Nov minutes).
Now this would simply be a “technical adjustment” in the mind of Fed officials but in reality the signaling here is important. Is the market, who sees this developing Dollar funding/shortage issue developing, really going to take this only as a one-off adjustment? Or is the market going to assume this small cut would be the first in the Fed’s rate cut cycle?
From a flow perspective, that has been the trade du jour – to play for Fed rate cuts in 2019 (mostly struck around the December time frame). Largely these plays developed around the WSJ article this weekend that said “Fed officials are contemplating thresholds for rate cuts” along with a major US bank pitching the same idea. Now these dovish plays have a new tailwind in the form of a potential Dollar funding/shortage problems.
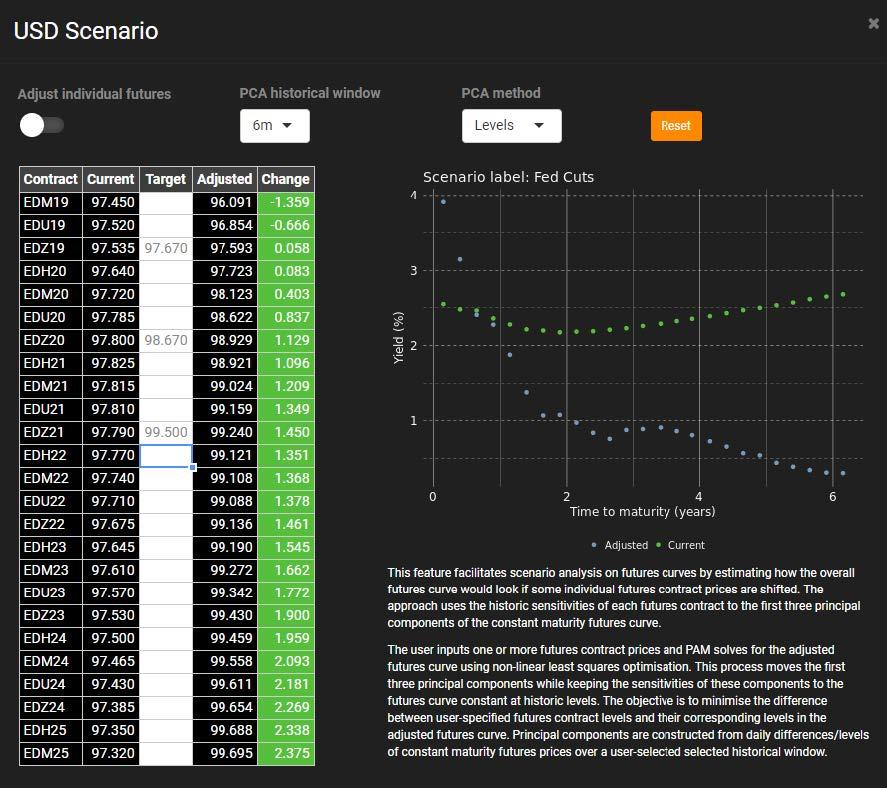
Playing for a Fed cut this year is generally expensive. Calls are still bid over puts and thus call skew is steep, especially in the whites. I would look further out the curve with the idea that when you look forward to Dec 2021, front end rates in the US have less than 50bps of cuts priced in. I’d recommend considering having on some protection this theme gains traction and that the amount of Fed cuts priced in the curve is not enough rather playing when the Fed starts cutting. When the Fed does start cutting, they cut hard and fast unlike the slow, gradual hiking path.
So here is what I ran in our PAM model: I gave it one cut by December (in line with the growing belief), and then gave it a reasonable cut cycle that gets December 2021 down to 50bps.
I wanted to only look at red and green midcurve structures (that’s where the bulk of the cuts will come), and only at expiries past September (I wanted time for the view to get priced in). I then filtered for structures less than 50bps OTM, that costs less than 5bps, and that have a delta more than 10%.
Results….
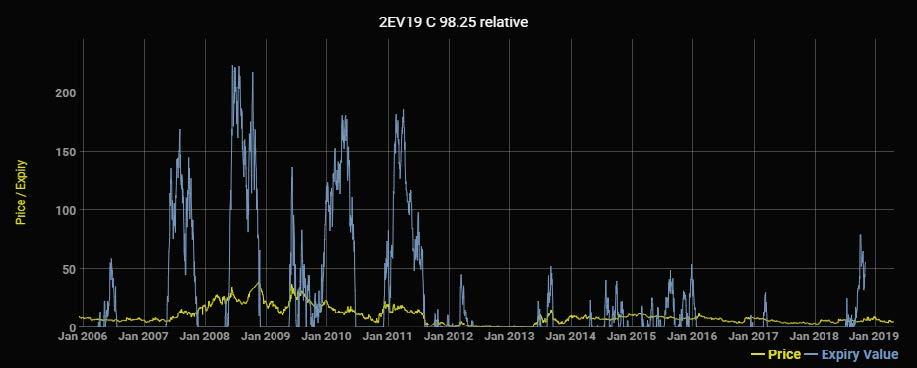
You can see it likes calls in Greens around the 98.25 strike. For example, the 2EV9 98.25 call for 5bps. Now I would personally cheapen the structure and take advantage of skew and turn it into a 2EV9 98.25/98.50 call spread for 2.5bps. That gives you an attractive 9-1 payout.
You can see here that in times of stress, the same relative Green 98.25 call has performed well in times of funding stresses like the 2007-2008 GFC or even the 2011 EU crisis. Blue line is expiry value.
Bottom line: there is a growing belief in the market that the Fed will have to start cutting this year. This has caused many to scratch their head as stocks made new all-time highs this week and the unemployment rate remains at historically low levels.
However, that all gets thrown out the window if a Dollar funding and Dollar shortage issues emerge because that has global repercussions. You are already seeing this leak from one of the most micro of front-end spreads (FF/IOER), into the US Dollar, into EM, and finally that is all starting to feed into risk assets generally. It is therefore key to watch if the expected decline in Fed Fund occurs or not over the coming days. (For your guidance, Fed Funds gets set daily at 9am EST for the prior day)
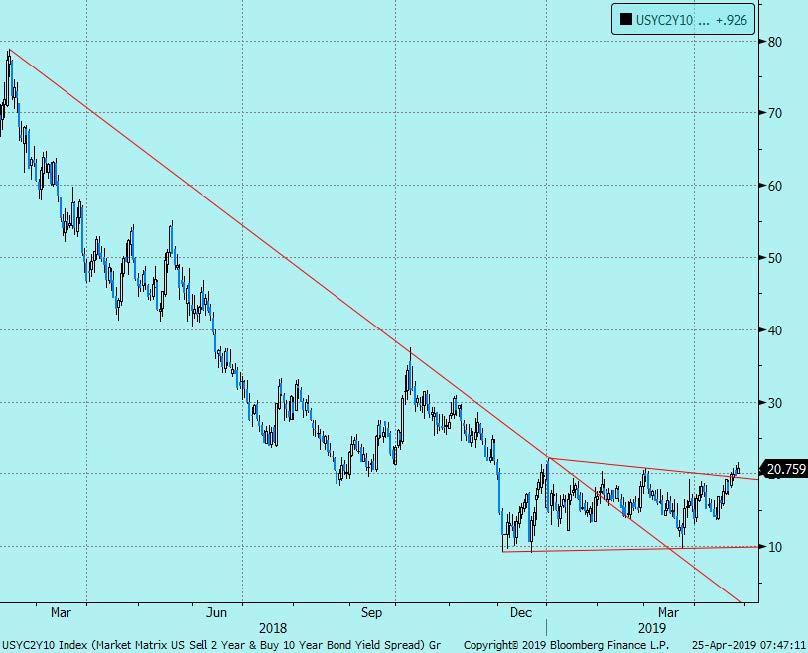
I continue to like curve steepeners as THE core position of 2019. 5s30s has been the preferred expression but now we can think about 2s10s steepeners. Like many of the charts above, the breakout in 2s10s that is developing is the ultimate end of cycle/Fed is going to start cutting signal. Unlike 5s30s which is a leading indicator of the cycle, 2s10s is more coincident. Therefore, the market is essentially implying that the not only are rate cuts coming eventually, but that are now more likely to come sooner rather than later.
US 2s10s spread broke its downtrend from Feb 2018, consolidated for a few months, and is now breaking out of that consolidation…
via ZeroHedge News http://bit.ly/2UH9KiU Tyler Durden
