Jeffrey Epstein’s Accused Madam Attended Secretive Jeff Bezos ‘Writer’s Retreat’ Last Year

Jeffrey Epstein’s Accused Madam Attended Secretive Jeff Bezos ‘Writer’s Retreat’ Last Year

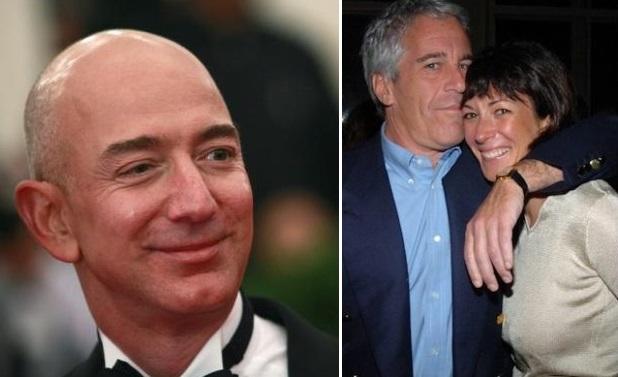
Last year there was a curious attendee at Amazon CEO Jeff Bezos’ annual writer’s retreat; Jeffrey Epstein’s alleged ‘madam,’ Ghislaine Maxwell.

The daughter of an accused Mossad agent who died under mysterious circumstances, Maxwell was accused of participating in Jeffrey Epstein’s sexual grooming and abuse of underage girls. She was confirmed to have attended at least one (and possibly three) of the secretive Bezos get-togethers, according to VICE.

Two Campfire 2018 attendees independently confirmed to Motherboard that Maxwell attended the exclusive retreat that year. One of the sources maintained that Maxwell had attended three Campfires including 2018, but that Maxwell was not an attendee at Campfire 2019 held in early October. Campfire 2018 took place shortly before a Miami Herald investigation resurfaced Epstein’s crimes and Maxwell’s alleged links to them, which eventually led to new charges against Epstein. –VICE

Maxwell was accompanied to Campfire by tech CEO and Council on Foreign Relations (CFR) member Scott Borgerson – who denied in August that he and Maxwell are romantically linked, or that she was hiding out at his “secluded oceanfront property” in New England – as reported by the Daily Mail.

What is Campfire?

According to the report, it’s an “all-expenses-paid retreat courtesy of Bezos and Amazon that is completely off the record for attendees, who often bring their spouses and partners on the free trip.” It was started in 2009.

The secretive conclaves have had virtually no press coverage (aside from a 2014 New York Times article), and has “largely remained under the radar,” reports VICE – which notes that Maxwell’s attendance “further illustrates the connections that Epstein and Maxwell maintained to the wealthy elite.

Tech moguls, presidents, well-known actors, and Prince Andrew all came into their orbit even after Epstein’s misdeeds and Maxwell’s alleged role first came to light. In fact, a secretive 2011 dinner in Long Beach, California attended by Bezos and other tech CEOs was also attended by Epstein, less than two years after he served time for underage sex crimes.


Maxwell, who has never been charged or arrested and has only faced allegations in civil lawsuits, has always denied any wrongdoing or involvement with Epstein’s crimes and has made few public appearances since they first surfaced in media reports. –VICE

Maxwell is currently missing. Aside from a strange and allegedly photoshopped photo-shoot of her having a burger and milkshake at a California “In-N-Out” (while reading a book about the CIA), her whereabouts are unknown.


Tyler Durden

Sun, 11/03/2019 – 14:00

Tags

via ZeroHedge News https://ift.tt/2NzKXMs Tyler Durden

Fed Gives Up On Inflation, Welcome To The United States Of Japan

Fed Gives Up On Inflation, Welcome To The United States Of Japan

Authored by Lance Roberts via RealInvestmentAdvice.com,

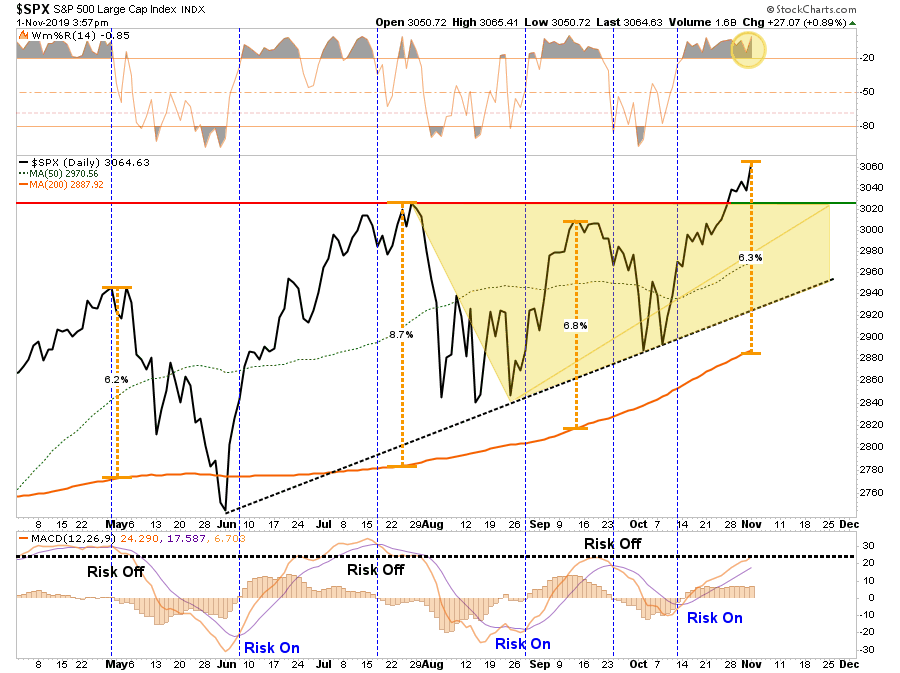
Retest Confirms Bullish Breakout

“If you are a bull, what is there not to love?”

That was the message from two weeks ago, and the reasoning behind increasing our equity exposure in portfolios as we head into the end of the year. With the Fed cutting rates on Wednesday, and companies winning the “beat the estimate game” as earnings season progresses, the markets finally broke out to new “all-time” highs this past week.

This breakout is consistent with the “revival of the bulls” which is needed as there is too much attention focused on a “recession” and “bear market.” (If a recession/bear market would have occurred it would have been the first time in history “everyone” saw it coming.)

“Over the last 30 years, when the Fed has implemented an ‘insurance’ rate cut policy of 75 basis points, the equity market has been ‘lights out’ as the S&P 500 has posted a 12-month forward return of ~23%, on average.” – Raymond James 

(H/T G. O’brien)

That’s the good news.

However, before you go jumping in with both feet, there are a couple of points to be made.

Concerning the chart above, you have to decide whether the recent rate cuts by the Fed are “mid-cycle adjustments” or “cuts entering a recession.” While most people only notice the tall black bars, given we are in the longest economic expansion in history, the short-blue bars may be important.

Again, since bear markets/recessions NEVER occur when everyone is expecting them, the breakout to new highs is exactly what is needed to “suck investors” back into the market at the potential peak. This is how bear markets have always begun in history.

On a shorter-term basis, whether you are bullish or bearish, the market is now more than 6% above its 200-dma. These more extreme price extensions tend to denote short-term tops to the market, and waiting for a pull-back to add exposures has been prudent.

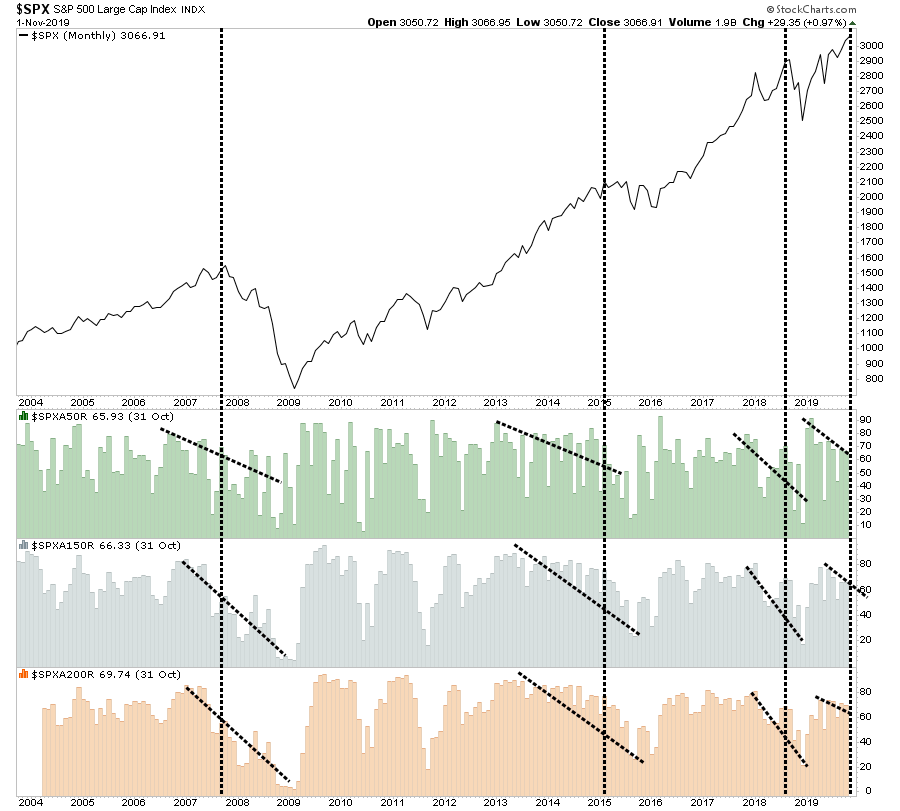
The other concern is the weakness in overall participation in the market. Despite the markets pushing to all-time highs, the number of stocks trading above their respective 50, 150, and 200-dma’s remain in downtrends. These negative divergences have preceded short to intermediate-term corrections in the past.

How To Play It

As we have been noting over the last month, with the Fed’s more accommodative positioning, we continue to maintain a long-equity bias in our portfolios currently. We have reduced our hedges, along with some of our more defensive positioning. We are also adding opportunistically, to our equity allocations, even as we carry a slightly higher than normal level of cash along with our fixed income positioning.

We also realize that “all good things do come to an end.” While we are currently “riding the bull,” we are simply waiting for the “8-second buzzer” to prepare for our dismount. (That’s a Texas rodeo thing if you don’t know the reference.)

Therefore, make sure you have stop-losses in place on all positions and be prepared to execute accordingly. The worst thing investors consistently do over time is to turn a “winner” into a “loser” before they eventually sell. (And they always sell.)

While you will certainly reduce your tax liability with this method, it is not a strategy by which you will increase your wealth. Being “rich on paper” and having “cash in the bank” are two ENTIRELY different things.

The Fed Gives Up On Inflation

On Wednesday, the Fed cut rates for the third time this year, which was widely expected by the market.

What was not expected was the following statement.

I think we would need to see a really significant move up in inflation that’s persistent before we even consider raising rates to address inflation concerns. – Jerome Powell 10/30/2019

The statement did not receive a lot of notoriety from the press, but this was the single most important statement from Federal Reserve Chairman Jerome Powell so far. In fact, we cannot remember a time in the last 30 years when a Fed Chairman has so clearly articulated such a strong desire for more inflation.

Why do we say that? Let’s dissect the bolded words in the quote for further clarification.

  • “really significant”– Powell is not only saying that they will allow a significant move up in inflation but going one better by adding the word significant.

  • “persistent”– Unlike the prior few Fed Chairman who claimed to be vigilant towards inflation, Powell is clearly telling us that he will not react to inflation that is not only well beyond a “really significant” leap from current levels, but a rate that lasts for a period of time.

  • “even consider”– If inflation is not only a really significant increase from current levels and stays at such levels for a while, they will only consider raising rates to fight inflation.

We are stunned by the choice of words Powell used to describe the Fed’s view on inflation. We are even more shocked that the markets or media are not making more of it.

Maybe, they are failing to focus on the three bolded sections. In fact, what they probably think they heard was: I think we would need to see a move up in inflation before we consider raising rates to address inflation concernsSuch a statement would have been more in line with traditional “Fed-speak.”

We have published  an article for our RIAPro subscribers (Try a FREE 30-Day Trial), which discusses our views on using Treasury Inflation-Protected Securities (TIPS), a hedge against Jerome Powell and the Fed getting inflation, or worse, failing and fostering deflation.

There is an other far more insidious message in Chairman Powell’s statement which should not be dismissed.

The Fed just acknowledged they are caught in a “liquidity trap.”

What Is A Liquidity Trap

Here is the definition:

“A liquidity trap is a situation described in Keynesian economics in which injections of cash into the private banking system by a central bank fail to lower interest rates and hence fail to stimulate economic growth. A liquidity trap is caused when people hoard cash because they expect an adverse event such as deflation, insufficient aggregate demand, or war. Signature characteristics of a liquidity trap are short-term interest rates that are near zero and fluctuations in the monetary base that fail to translate into fluctuations in general price levels.

Let’s take a moment to analyze that definition by breaking it down into its overriding assumptions.

  • Are the Central Banks globally injecting liquidity into the financial system? Yes.
  • Has the increase in liquidity into the private banking system lowered interest rates?  Yes.

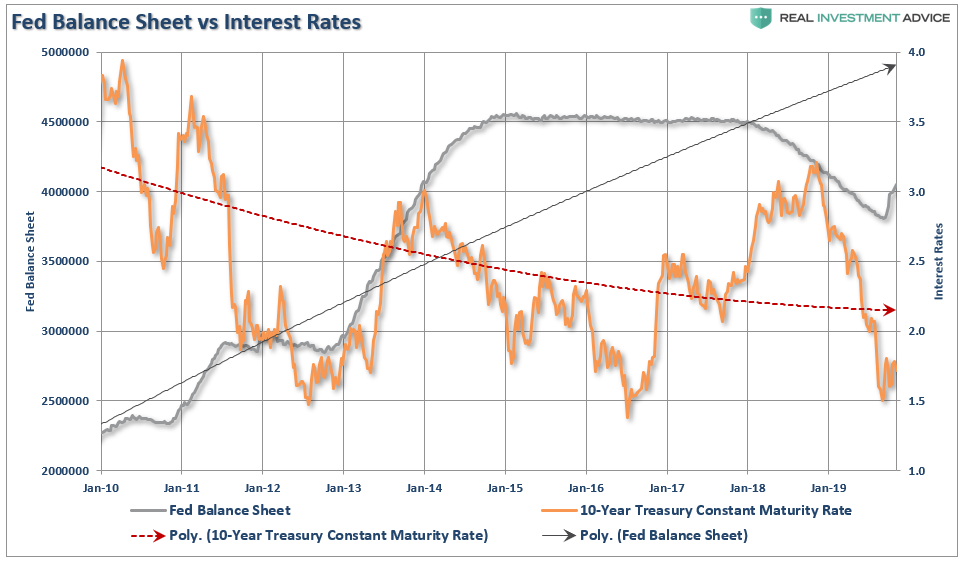
The chart below shows the increase in the Federal Reserve’s balance sheet, since they are the “buyer” of bonds, which in turn increases the excess reserve accounts of the major banks, as compared to the 10-year Treasury rate.

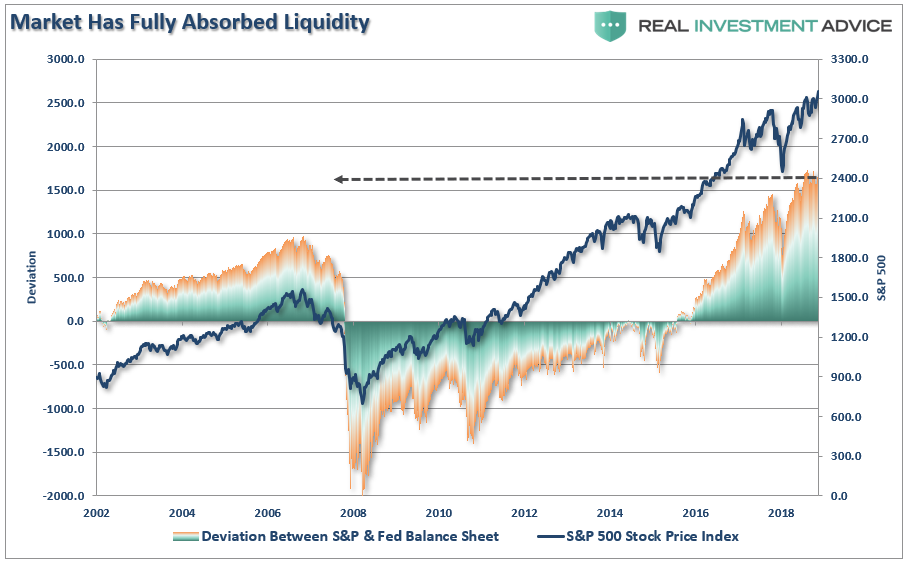
Of course, that money didn’t flow into the U.S. economy, it went into financial assets. With the markets having absorbed the current levels of accommodation, it is not surprising to see the markets demanding more, (The chart below compares the deviation between the S&P 500 and the Fed’s balance sheet. That deviation is the highest on record.)

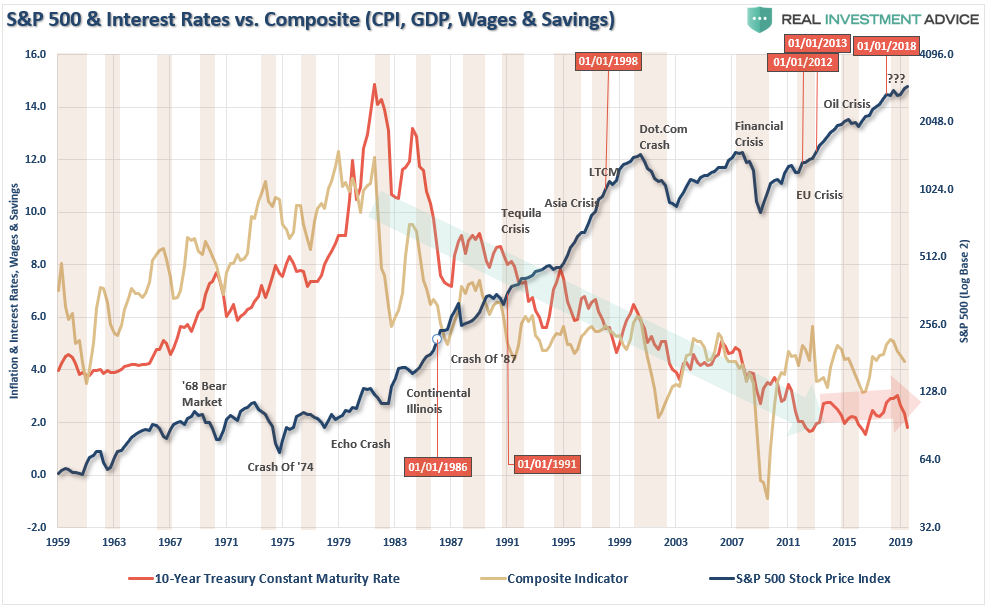
While, in the Fed’s defense, it may be clear the Fed’s monetary interventions have suppressed interest rates, I would argue their liquidity-driven inducements have not done much to support durable economic growth. Interest rates have not been falling just since the monetary interventions began – it began four decades ago as the economy began a shift to consumer credit leveraged service society.  The chart below shows the correlation between the decline of GDP, Interest Rates, Savings, and Inflation.

In reality, the ongoing decline in economic activity has been the result of declining productivity, stagnant wage growth, demographic trends, and massive surges in consumer, corporate and, government debt.

For these reasons, it is difficult to attribute much of the decline in interest rates and inflation to monetary policies when the long term trend was clearly intact long before these programs began.

While an argument can be made that the early initial rounds of QE contributed to the bounce in economic activity, there were several other more important supports during the latest economic cycle.

  1. Economic growth ALWAYS surges after recessionary weakness. This is due to the pent up demand that was built up during the recession and is unleashed back into the economy when confidence improves.

  2. There were multiple bailouts in 2009 from “cash for houses”, “cash for clunkers”, to direct bailouts of the banking system and the economy, etc., which greatly supported the post-recessionary boost.

  3. Several natural disasters from the “Japanese Trifecta” which shut down manufacturing temporarily, to massive hurricanes and wildfires, provided a series of one-time boosts to economic growth just as weakness was appearing.

  4. A massive surge in government spending which directly feeds the economy

The Fed’s interventions from 2010 forward, as the Fed became “the only game in town,” seems to have had little effect other than a massive inflation in asset prices. The evidence suggests the Federal Reserve has been experiencing a diminishing rate of return from their monetary policies.

Welcome To The U.S. Of Japan

The Federal Reserve is caught in the same “liquidity trap” that has been the history of Japan for the last three decadesWith an aging demographic, which will continue to strain the financial system, increasing levels of indebtedness, and unproductive fiscal policy to combat the issues restraining economic growth, it is unlikely monetary interventions will do anything other than simply continuing the boom/bust cycles in financial assets.

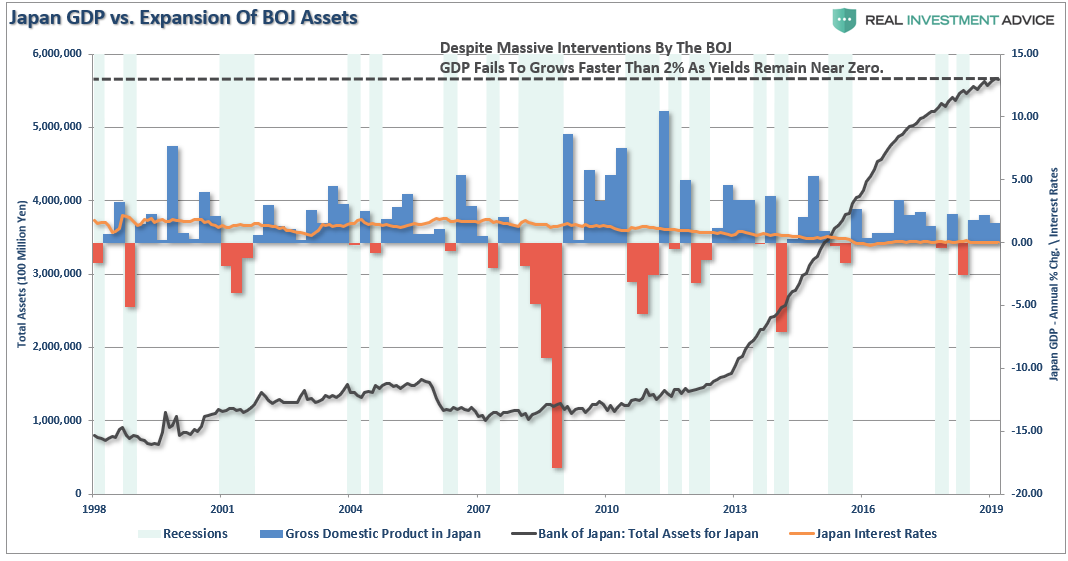
The chart below shows the 10-year Japanese Government Bond yield as compared to their quarterly economic growth rates and the BOJ’s balance sheet. Low interest rates, and massive QE programs, have failed to spur sustainable economic activity over the last 20 years. Currently, 2, 5, and 10 year Japanese Government Bonds all have negative real yields.

The reason you know the Fed is caught in a “liquidity trap” is because they are being forced to lower rates due to economic weakness.

It is the only “trick” they know.

Unfortunately, such action will likely have little, or no effect, this time due to the current stage of the economic cycle.

If interest rates rise sharply, it is effectively “game over” as borrowing costs surge, deficits balloon, housing falls, revenues weaken and consumer demand wanes. It is the worst thing that can happen to an economy that is currently remaining on life support.

The U.S., like Japan, is clearly caught in an on-going “liquidity trap”  where maintaining ultra-low interest rates are the key to sustaining an economic pulse. The unintended consequence of such actions, as we are witnessing in the U.S. currently, is the ongoing battle with deflationary pressures. The lower interest rates go – the less economic return that can be generated. An ultra-low interest rate environment, contrary to mainstream thought, has a negative impact on making productive investments and risk begins to outweigh the potential return.

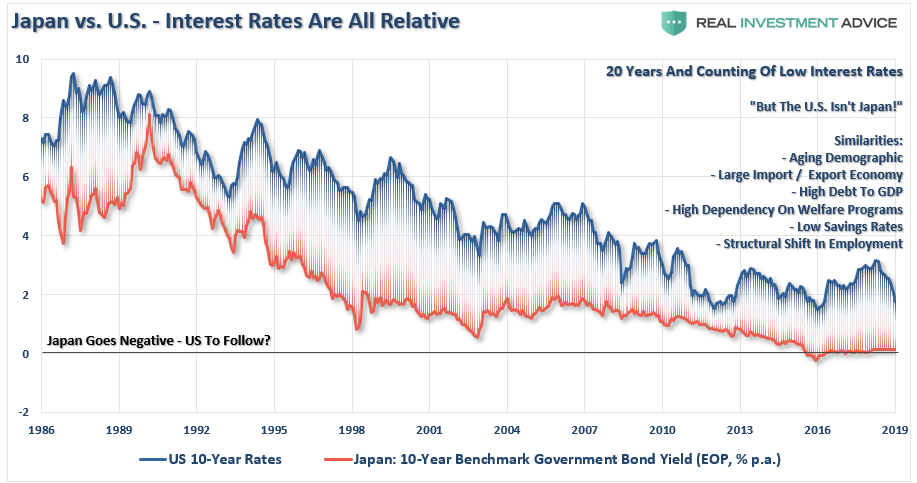
Most importantly, while there are many calling for an end of the “Great Bond Bull Market,” this is unlikely the case. As shown in the chart below, interest rates are relative globally. Rates can’t rise in one country while a majority of economies are pushing negative rates. As has been the case over the last 30-years, as goes Japan, so goes the U.S.

Simply pulling forward future consumption through monetary policy continues to leave an ever-growing void in the future that must be filled. Eventually, the void will be too great to fill.

But hey, let’s just keep doing the same thing over and over again, which hasn’t worked for anyone as of yet, and continue to hope for a different result. 

What’s the worst that could happen?  


Tyler Durden

Sun, 11/03/2019 – 13:30

via ZeroHedge News https://ift.tt/36vbN0M Tyler Durden

Saudi Arabia Launches Its Long-Awaited IPO Of Aramco

Saudi Arabia Launches Its Long-Awaited IPO Of Aramco

As the global IPO market falters, Saudi state oil giant Aramco announced Sunday its IPO offering on the Tadawul exchange in Riyadh.

Saudi Crown Prince Mohammed bin Salman (MbS) and Aramco executives are scrambling to IPO Aramco before the IPO market shuts, and the global economy enters a trade recession.

The Aramco IPO has had nearly four years of delays but could start trading on the Tadawul exchange by December, with international offerings in 2020/21.

Aramco is expected to release the IPO prospectus on November 9, The Wall Street Journal said.

Chairman of Saudi Aramco and Governor of the Public Investment Fund Yassir al-Rumayyan and Aramco Chief Executive Officer Amin Nasser, delivered a statement to journalists at a press conference on Sunday:

“Today is a profoundly important day for the kingdom of Saudi Arabia,” al-Rumayyan said.

The price range of the Saudi Aramco IPO, The Journal noted, has been of a conflict between MbS, Aramco executives, and the underwriters of the deal.

MbS values the company at $2 trillion, but bankers said no investor would buy at that level.

The deal is likely to price on the Tadawul exchange around a valuation of $1.7 trillion, with a low range of $1.6 trillion, and a high range of $1.8 trillion, sources told The Journal.

“Let the market dynamics and those discussions drive the value and what the pricing should be for that IPO,” said one banker. “The ego, pride, and everything should be secondary.”

At a $1.5 trillion valuation, Aramco would raise $45 billion for a 3% stake on the Tadawul exchange.

The purpose of the IPO is to diversify the Saudi economy away from the oil industry and to invest more in technology, healthcare, mining, and tourism sectors. 

MbS is leading the transformation as apart of the Saudi Vision 2030 plan to reduce the country’s dependence on oil.

“To strengthen Tadawul and Saudi Arabia as a foreign investment destination, listing Saudi Aramco now is important,”  Nasser said.

“It’s only Tadawul for now, anything else in the future will be announced at a later date,” Nasser said referring to the company’s plans for a foreign listing. He also added that Aramco did not just meet with international investors but “with national investors also.”

“We will continue to create value, for our shareholders, for our customers,” he said.

Still, many uncertainties surround the IPO.

Geopolitical tensions have been elevated in the country since an Iranian missile attack blew up part of the company’s oil processing plant in September.

Aramco made it clear that now is the time to move forward with the IPO, though they’ve been saying this for years (Aramco IPO timeline via Reuters):

Nov 3, 2019 – Saudi Arabia’s Capital Market Authority said its board had approved Saudi Aramco’s application for the registration and offering of a proportion of its shares.

Oct 18, 2019 – Saudi Aramco delays the planned launch of its initial public offering in hopes that pending third-quarter results will bolster investor confidence in the world’s largest oil firm.

Oct 8, 2019 – The Saudi central bank vets local lenders’ exposure to Saudi Aramco ahead of an initial public offering of the state-oil giant that will likely see large numbers of Saudi investors seek loans to buy its stock, three sources familiar with the matter said.

Oct 7, 2019 – Rating agency Fitch downgrades Saudi Aramco by one notch after attacks last month on two production facilities, putting the rating of the state-owned oil giant at par with the one of Saudi Arabia.

Sept 30, 2019 – Fitch downgrades Saudi Arabia’s credit rating to A from A+, citing rising geopolitical and military tensions in the Gulf following an attack on its oil facilities and a deterioration of the kingdom’s fiscal position.

Sept 25, 2019 – Saudi Arabia restores its oil production capacity to 11.3 million barrels per day, three sources briefed on Saudi Aramco’s operations tell Reuters, maintaining a faster than expected recovery after the Sept. 14 attacks.

Sept 14, 2019 – Two Saudi Aramco plants attacked in a drone strike, triggering the biggest jump in oil prices in almost 30 years. The attacks forced Saudi Arabia to shut down more than half of its crude output, leaving question marks over the timing and valuation of its IPO.

Sept 11, 2019 – Saudi Aramco hires nine banks as joint global coordinators to lead its planned initial public offering, sources say.

Sept 9, 2019 – Saudi Arabia plans to list 1% of Saudi Aramco on the Riyadh stock exchange before the end of 2019 and another 1% in 2020, sources tell Reuters.

Sept 2, 2019 – Saudi Arabia names head of the country’s sovereign wealth fund, Yasir al-Rumayyan, as Aramco chairman, replacing Energy Minister Khalid al-Falih.

Aug 30, 2019 – Saudi Aramco board sees too many risks for New York IPO, sources tell Reuters.

Aug 19, 2019 – Saudi Aramco asks banks to pitch for roles in IPO, sources say.

July 2, 2019 – Banks including JPMorgan, Morgan Stanley and HSBC scramble to re-pitch for Aramco IPO roles, sources say, with Saudi Arabia’s energy minister confirming plans for the listing to proceed in 2020 or 2021.

April 9, 2019 – Aramco sells $12 billion bonds out of record $100 billion demand.

April 1, 2019 – Saudi Aramco made core earnings of $224 billion in 2018, figures show, after Aramco had to reveal them in order to start issuing international bonds.

March 27, 2019 – Saudi Aramco says it would buy SABIC in $69 billion chemicals mega deal.

March 7, 2019 – Saudi Energy Minister says Aramco IPO to happen within two years, Okaz newspaper reports.

Aug 22, 2018 – Saudi Arabia scraps plans for the domestic and international listing of Aramco and advisers working on the listing have been disbanded as the kingdom shifts its attention to buying a stake in SABIC, sources say.

July 20, 2018 – Saudi Aramco’s plans to buy a stake in petrochemicals maker Saudi Basic Industries Corp (SABIC) would affect IPO timing, CEO says in an interview.

March 13, 2018 – Saudi Aramco international listing looks increasingly difficult, sources close to the process say

Jan 11, 2018 – Hong Kong, London, New York shortlisted for Aramco IPO, two sources with knowledge of the discussions say

Jan 10, 2018 – Saudi Aramco is working to raise cheap loans from banks seeking to strengthen their ties with the oil giant before its IPO, banking sources say.

Oct 26, 2017 – Saudi Aramco IPO is on track for 2018 and it could be valued at more than $2 trillion, Crown Prince Mohammed bin Salman tells Reuters in an interview.

Sept 25, 2017 – Saudi finance minister told bond investors Aramco IPO would go ahead in 2018, sources tell Reuters.

Aug 11, 2017 – Saudi Arabia favors New York for Aramco listing despite risks for the main foreign listing, people familiar with the matter tell Reuters.

Aug 3, 2017 – Goldman Sachs bought into Aramco $10 billion loan as it seeks IPO role, sources familiar with the matter tell Reuters.

May 3, 2017 – London tries to lure Saudi Aramco with new listing structure, sources familiar with the discussions say.

May 2, 2017 – Aramco sale won’t be far off 5%, will happen in 2018, Deputy Crown Prince Mohammed bin Salman says. 

April 24, 2017 – HSBC has been formally mandated as an adviser on IPO of Saudi Aramco, HSBC’s chief executive says.

April 19, 2017 – China gathers state-led consortium that will act as a cornerstone investor in the Aramco IPO, people with knowledge of the discussions tell Reuters.

March 30, 2017 – Saudi Aramco formally appointed JPM, Morgan Stanley and HSBC as international financial advisers for its IPO, sources familiar with the matter tell Reuters.

March 23, 2017 – Saudi Aramco picks Samba Capital as local IPO adviser, sources tell Reuters.

March 6, 2017 – Saudi Aramco will list locally and abroad in second half of 2018, Chief Executive Amin Nasser says.

Jan 26, 2017 – Saudi Aramco selects U.S. firms to audit its reserves for IPO, industry sources says

May 27, 2016 – Saudi Aramco was boosting market share as it prepares for listing, Chief Executive Amin Nasser says in an interview.

May 10, 2016 – Saudi Aramco was finalizing proposals for the IPO of less than 5% of its value and will present them to its Supreme Council soon, its chief executive says.

April 25, 2016 – Saudi Arabia expects Saudi Aramco to be valued at more than $2 trillion and plans to sell less than 5% of it through an IPO, the Deputy Crown Prince Mohammed bin Salman says.

Jan 24, 2016 – Saudi Aramco chairman says IPO could be open to international markets, in an interview to Arabiya TV.

Jan 8, 2016 – Saudi Aramco issued statement saying it was considering options including the stock market listing “of an appropriate percentage of the company’s shares and/or the listing of a bundle of its downstream subsidiaries”.

Jan 6, 2016 – Saudi Arabia’s Deputy Crown Prince Mohammed bin Salman mentioned his interest in selling off parts of Aramco to private investors in an interview with the Economist.

Tyler Durden

Sun, 11/03/2019 – 13:00

via ZeroHedge News https://ift.tt/36sfhB6 Tyler Durden

Six Charts Showing Just How Much The Government Has Grown

Six Charts Showing Just How Much The Government Has Grown

Authored by Ryan McMaken via The Mises Institute,

Federal spending and federal taxation in the United States set new records in 2019. And the federal budget deficit swelled to more than a trillion dollars. Europe is in the middle of an enormous spending binge. But apparently hard-core laissez-faire libertarian purists have taken over the world’s governments.

At least, that’s the case in the minds of many leftists and conservatives who have convinced themselves that “market fundamentalists” have conquered the world’s institutions, and have enacted a global regime of near-zero taxation, free trade, and almost totally unregulated markets.

We hear this over an over again when everyone from The Pope to Bernie Sanders claims “neoliberalism” — a term used to “denote… a radical, far-reaching application of free-market economics unprecedented in speed, scope, or ambition” — has forged the world into a paradise for radical libertarians.

As one writer at The Guardian assures us, the UK must end the nation’s “generation-long experiment in market fundamentalism.” Meanwhile, Tucker Carlson insists that American policymakers “worship” markets and have a near-religious devotion to capitalism.

The neoliberal takeover is so complete, in fact, that we’re told neoliberals are the ones really running the Labour Party. Meanwhile, sociologist Lawrence Busch informs us of a “neoliberal takeover” of higher education. “Free-market fundamentalists,” Busch contends, have transformed America’s colleges and universities into swamps of capitalist obeisance.

By What Metric?

But whenever I hear about how government intervention in the marketplace is withering away — to be replaced by untrammeled markets — I am forced to wonder what metric these people are using.

By what measure are governments getting smaller, weaker, and less involved in the daily lives of human beings?

In this country, at least, this case certainly can’t be made by consulting the data on government taxation and spending.

From 1960 to 2018, federal tax receipts per capita increased from $3,523 to $5,973, an increase of 70 percent.

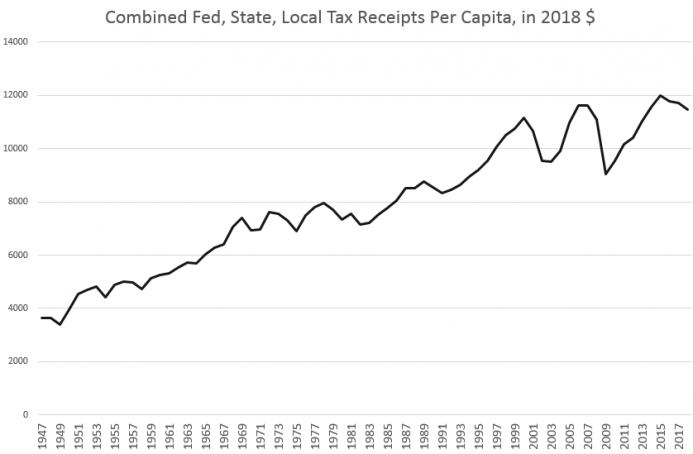
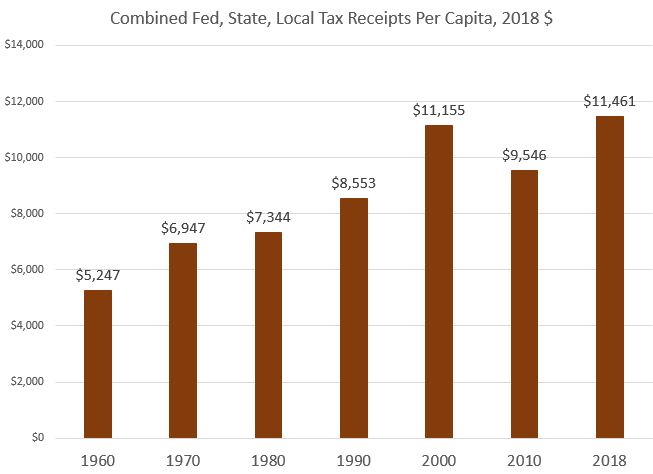
Combining state and local taxation with federal taxes, the increase is even larger. Taxation per capita at all levels combined grew 118 percent from $5,247 in 1960 to $11,461 in 2018.

The size and scope of government isn’t just growing to reflect population changes. After all, the US population only grew 81 percent from 1960 to 2018. And the federal government, embroiled in a global cold war amidst a rising tide of social programs, wasn’t exactly vanishingly small in 1960.

In all these per capita graphs, I’ve factored in population growth because many defenders of government growth claim that governments must get larger as populations increase. Even if that were true, we can see that total spending and taxation is outpacing population growth considerably.1 But it should not simply be accepted that population growth ought to bring increases in government spending and taxation. Military defense of the United States doesn’t become more expensive simply because the population grew. Moreover, innovation and productivity gains make products and services less expensive in a functioning private economy. This is often masked by relentless money supply inflation in the name of price “stability.” But the natural progression of an economy is toward falling prices. Only with government procurements have we come to expect everything getting more expensive every year.

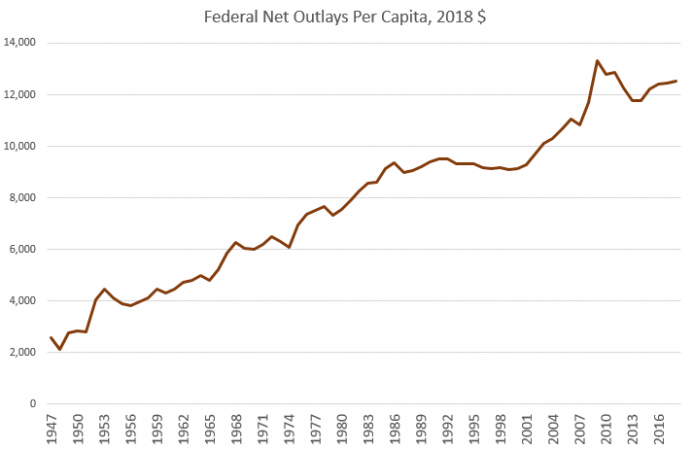
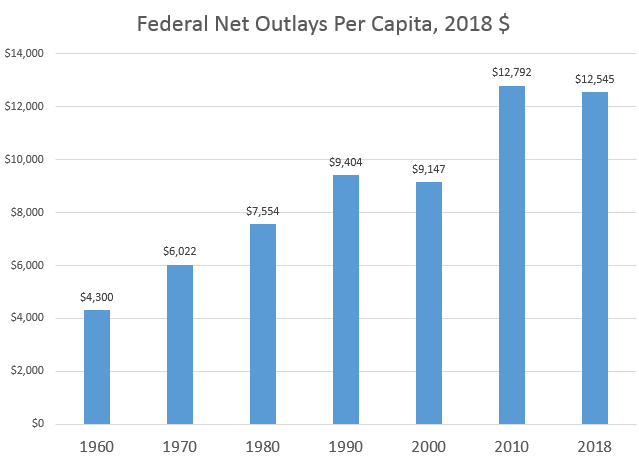
Fueled by huge deficits, federal spending has outpaced tax collections. Per capita federal spending increased by 191 percent from 1960 to 2018, climbing from $4,300 to $12,545.

The deficit topped a trillion dollars during the 2019 fiscal year, a new high for a so-called “boom period” during which deficits are supposed to shrink.

Ultimately, of course, huge deficits will put an additional burden on the taxpayers beyond the hundreds of billions of dollars per year necessary to simply pay interest on the debt. The huge debt levels put upward pressure on interest rates, and require more central-bank interventions designed to prop up demand for government debt. These interventions both crowd out demand for private debt, and have led to asset-price inflation as a result of money-supply inflation. This benefits the wealthy, but harms first time home buyers and ordinary savers.

The government spending itself is a problem as well. Governments try to play off government spending as if it were all a free gift to the taxpayers as some sort of “return” on the “investment” of taxes paid.

As Murray Rothbard has noted, however, government spending is just as damaging as the taxation that came before it. Government procurements bid up the prices of goods and services that could have been available at lower prices in the private sector were it not for the government spending. Steel and other materials would be less expensive for entrepreneurs. High tech workers could be employed innovating and making things for ordinary taxpayers instead of for government agencies and bureaucrats. Small business owners and ordinary consumers all are worse off as a result.

So, given that spending and taxation are at or are near all-time highs right now, where exactly is this takeover by laissez-faire libertarians we keep hearing about?

It’s certainly not in the regulatory side of the government.

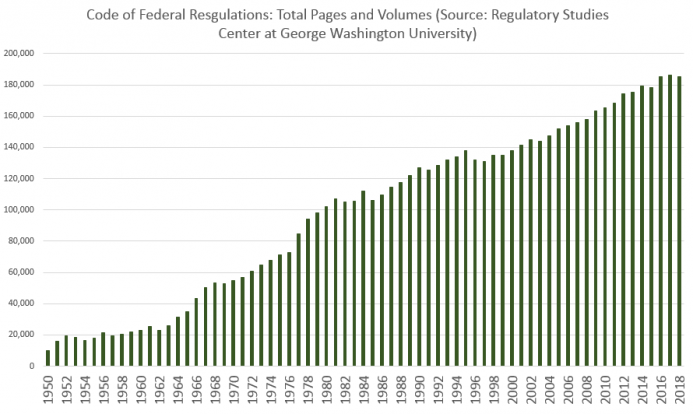
The number of pages published in the Code of Federal Regulations increased 710 percent from 1960 to 2018, and 37 percent over the past twenty years. Every additional page represents new regulations, new rules, new punishments, and new fees. These are costs employers must contend with, and consumers must ultimately pay for. Protectionists who think that manufacturers would flock to the United States were it not not low tariffs might consider the regulatory burden placed on employers by our own domestic policies.

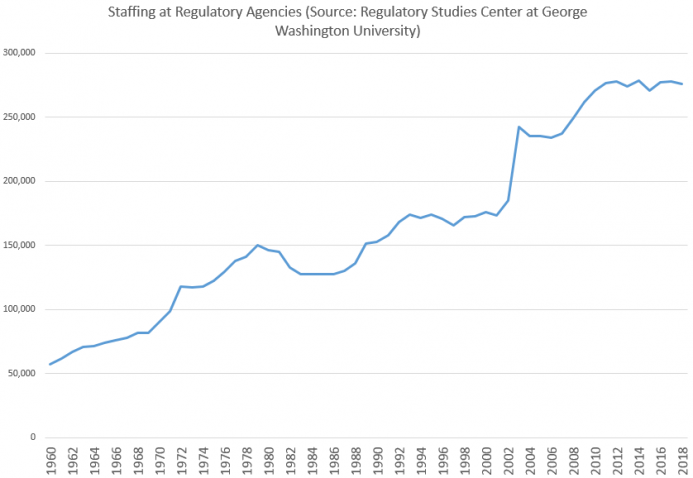
Both staffing and budgets for federal regulatory agencies continue to balloon. The combined budgets for federal regulatory agencies have more than tripled over the past 40 years, rising from under 20 billion in 1978 to 65 billion today.

Part of this has been to pay salaries for the ever growing army of federal employees. Employees at regulatory agencies doubled over the past forty years, rising from 140,000 full-time equivalent positions in 1978 to 280,000 today.

The US population increased by 47 percent during that time.

When the federal government isn’t spending more, it’s taking on more risk, committing the taxpayers to more bailouts, and flooding the market with government insured debt. As The Washington Post reported earlier this month, “In 2019, there is more government-backed housing debt than at any other point in U.S. history.” And these government guarantees are up considerably since the 2009 housing crash. The Post continues: “Now, Fannie Mae, Freddie Mac and the Federal Housing Administration guarantee almost $7 trillion in mortgage-related debt, 33% more than before the housing crisis … Because these entities are run or backstopped by the U.S. government, a large increase in loan defaults could cost taxpayers hundreds of billions of dollars.”

Yet, in spite of all this, we’ll no doubt continue to be told that government is withering away, government institutions are “underfunded,” and extreme anti-government libertarians have taken over. Of course, it’s entirely possible that the success of certain free-market ideas — however limited that success may be — has helped to restrain the growth of government taxation and spending. Without this so-called “victory” of the libertarians, we might be looking at a per capita tax burden that grew 200 or 300 percent in recent decades, rather than a “mere” 118 percent. 

But given the ongoing growth of government taxation, spending, and regulation, it should be abundantly clear that we are hardly living in an age of “market fundamentalism,” laissez-faire libertarianism, or policymakers who “worship” the market. If anything, trends appear to be moving in exactly the opposite direction. 


Tyler Durden

Sun, 11/03/2019 – 12:30

via ZeroHedge News https://ift.tt/33e3xQy Tyler Durden

‘Get Your Act Together’: Trump Threatens To Pull Federal Support As California Fires Rage

‘Get Your Act Together’: Trump Threatens To Pull Federal Support As California Fires Rage

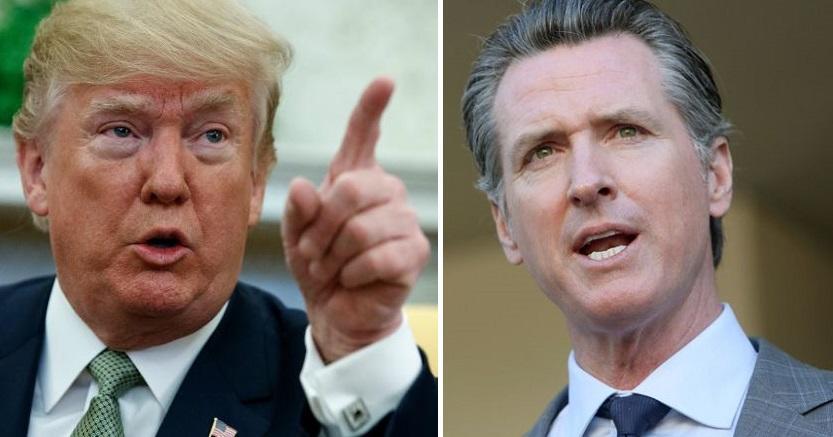
As Californians grapple with this year’s annual fire season, President Trump has a message for Democratic Governor Gavin Newsom; clean up your act.

“The Governor of California, @GavinNewsom, has done a terrible job of forest management. I told him from the first day we met that he must “clean” his forest floors regardless of what his bosses, the environmentalists, DEMAND of him,” Trump tweeted on Sunday.

Trump then threatened to withhold federal money, which California receives every time they declare a state of emergency.

“Must also do burns and cut fire stoppers,” he continued. “Every year, as the fire’s [sic] rage & California burns, it is the same thing-and then he comes to the Federal Government for $$$ help. No more. Get your act together Governor.

“You don’t see close to the level of burn in other states…But our teams are working well together in putting these massive, and many, fires out. Great firefighters! Also, open up the ridiculously closed water lanes coming down from the North. Don’t pour it out into the Pacific Ocean. Should be done immediately. California desperately needs water, and you can have it now!”

California state Senator Mike McGuire tweeted “Total crap” in response to Trump, claiming that “Approx 57% of CA’s forest land is owned by the Fed Gov’t. Only 3% is owned by State/local gov’t. THE FEDS HAVE CUT their forest budget by hundreds of millions.”

After more than a week battling around a dozen blazes throughout the state, fire crews have most of the incidents over 70% contained, according to the California Department of Forestry and Fire Protection. That said, first responders have been slowed down by reports of drones being operated in their airspace.

Two separate instances of drone flights disrupted water-dropping helicopters from attempting structure protection in the nearby city of Santa Paula, Ventura County Fire Department spokesman Mike DesForges said.

The helicopters had to set down for 30 to 40 minutes each time,” DesForges said. “The drones are difficult to see and they can be pushed by winds very easily. If they strike one of our helicopters, they could cause it to crash, and if not, we would still need to land that helicopter to perform repairs.” –NPR

On Thursday night, the Maria Fire  broke out near the cities of Ventura and Oxnard to the north of Los Angeles. It is currently 50% contained after burning around 9,400 acres. Following the new blaze, Newsom expanded the state of emergency in Sonoma and Los Angeles.

Maria fire (circled)

To the north, the Kincade Fire in Sonoma County has burned over 77,000 acres and is 76% contained. Over 4,500 fire personnel battled the blaze east of Geyserville.

“They’re still doing a lot of work in those hot spots, and there are still a lot of utility workers in there trying to get services restored,” said Cal Fire spokesman Cleo Doss. “We’re trying to help the people who have already been released get back into the area.”

According to the San Francisco Chronicle, evacuation orders have been lifted for all but a few locations affecting 1,500 people. During the height of the fire, around 185,000 people were evacuated. The fire has destroyed 372 structures, including 175 homes. Four first responders sustained non-life threatening injuries.


Tyler Durden

Sun, 11/03/2019 – 12:00

via ZeroHedge News https://ift.tt/2pCpfPQ Tyler Durden

Is China Playing Trump & His Trade Team For Chumps?

Is China Playing Trump & His Trade Team For Chumps?

Authored by Charles Hugh Smith via OfTwoMinds blog,

If we put ourselves in the shoes of the Chinese negotiators, we realize there’s no need to sign a deal at all.

The world’s worst negotiating strategy is to give the other side everything they want in exchange for worthless empty promises, yet this is exactly what Trump and his trade team are doing. All the Chinese trade team has to do to get rid of tariffs and other U.S. bargaining chips is mutter some empty phrase about “agreeing in principle” and the U.S. surrenders all its bargaining chips.

If the other side are such naive chumps that they give you everything you want without actually committing to anything remotely consequential, why bother with a formal agreement? Just play the other side for the chumps they are: if they threaten to reinstate tariffs, just issue another worthless press release about “progress has been made.”

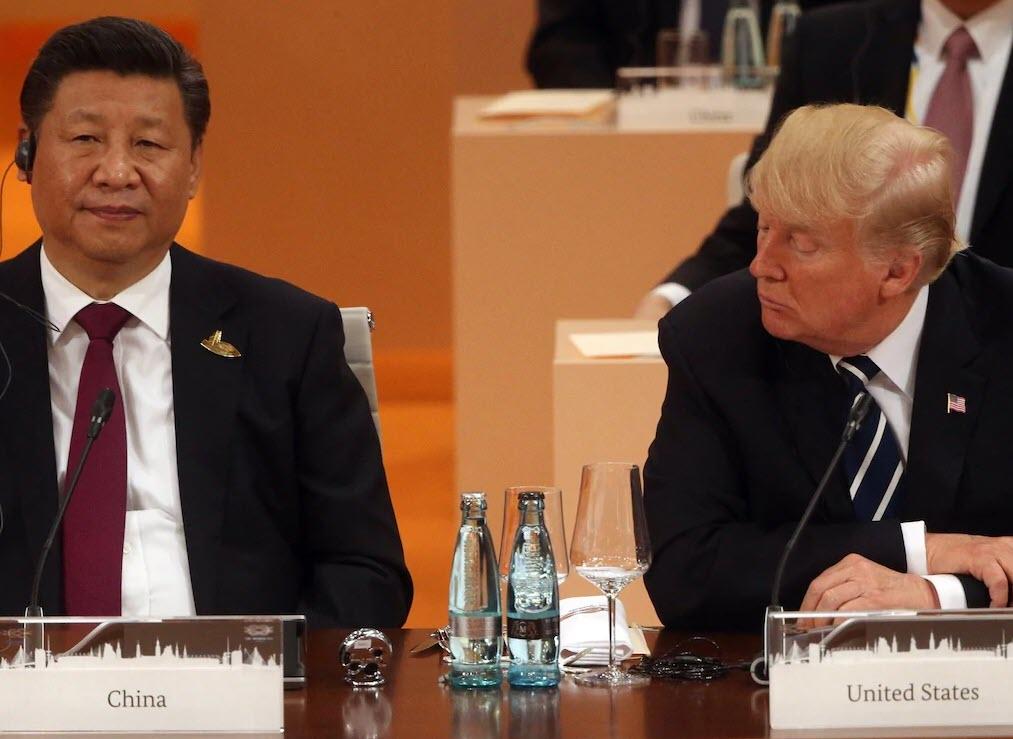
The other guaranteed losing strategy in negotiation is advertise your own fatal weakness, which in Trump’s case is his obsession with pushing the U.S. stock market to new highs. There is no greater gift he could hand the Chinese trade team than this monumental weakness, for all they have to do is talk tough and the U.S. stock market promptly tanks, sending the Trump Team into a panic of appeasement and empty claims of “progress.”

The Chinese team has gotten their way for a year by playing Trump’s team as chumps and patsies, so why stop now? The Chinese know they can get way without giving anything away by continuing to play the American patsies and using the president’s obsession with keeping U.S. stocks lofting higher to their advantage: declare the talks stalled, U.S. stocks crater, the American team panics and rushes to remove anything that might have enforcement teeth, reducing any “trade deal” to nothing but empty promises.

Given their success at playing America’s team, why do a deal at all? Just play the chumps for another year, and maybe Trump will be gone and a new set of even more naive patsies enter the White House.

If we put ourselves in the shoes of the Chinese negotiators, we realize there’s no need to sign a deal at all: the Trump team has gone out of its way to make it needless for China to agree to anything remotely enforceable. All the Chinese have to do is issue some stern talk that crushes U.S. stocks and the Trump Team scurries back, desperate to appease so another rumor of a “trade deal” can be issued to send U.S. stocks higher.

It would be pathetic if it wasn’t so foolish and consequential.

*  *  *

My recent books:

Will You Be Richer or Poorer? Profit, Power and A.I. in a Traumatized World (Kindle $6.95, print $11.95) Read the first section for free (PDF).

Pathfinding our Destiny: Preventing the Final Fall of Our Democratic Republic ($6.95 (Kindle), $12 (print), $13.08 ( audiobook): Read the first section for free (PDF).

The Adventures of the Consulting Philosopher: The Disappearance of Drake $1.29 (Kindle), $8.95 (print); read the first chapters for free (PDF)

Money and Work Unchained $6.95 (Kindle), $15 (print) Read the first section for free (PDF).

*  *  *

If you found value in this content, please join me in seeking solutions by becoming a $1/month patron of my work via patreon.com.


Tyler Durden

Sun, 11/03/2019 – 11:30

via ZeroHedge News https://ift.tt/2r6PTRb Tyler Durden

“Brutally Cold Air Mass” Set To Unleash Snow Over Northeast Next Week

“Brutally Cold Air Mass” Set To Unleash Snow Over Northeast Next Week

An Arctic blast of cold air is likely to roll into the Mid-Atlantic and Northeast regions this coming week, possibly producing one of the first snowmaking weather events of the year by late week. 

“A very cold airmass for early November is poised to impact the Northeast late week into next weekend. A favorable upper atmospheric pattern should allow air from northern Canada to spill into the Great Lakes and Northeast. During this cold stretch, temperatures may average 10-20 degree F below normal for most of the Northeast, including the major cities. This may influence heating oil and natural gas demand, while allowing interior Northeast ski resorts to begin making snow for the winter season ahead, stated Ed Vallee, head meteorologist at Empire Weather LLC.
Vallee shared a Temperature Anomaly map that shows from November 03-10, temperatures across the Mid-Atlantic and Northeast could be significantly below trend, setting the scene for a possible snow event late next week. 

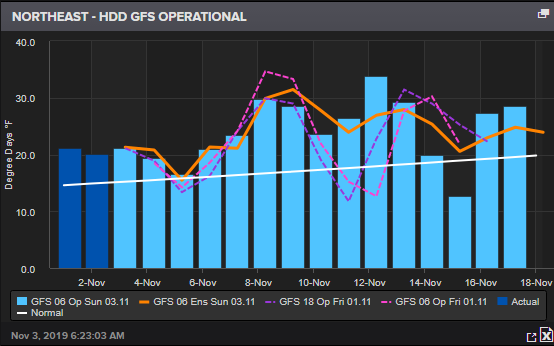
The Northeast heating degree day index prints above trend for the next 15 days, indicating natural gas and heating oil demand will likely move higher. 

Vallee’s weather team at Empire Weather tweeted several posts suggesting a winter event is possibly headed to the Mid-Atlantic and Northeast late next week.

While the forecasts are still early, the exact timing and heaviest impacted regions are not yet known. 

More developments will likely come early next week. 

As November could begin with a major snow event in the Northeast, many are wondering what Old Man Winter has in store for North America. Weather reports from Reuters’ commodity desk suggest a “cold season” for many parts of Central and Northeast US.

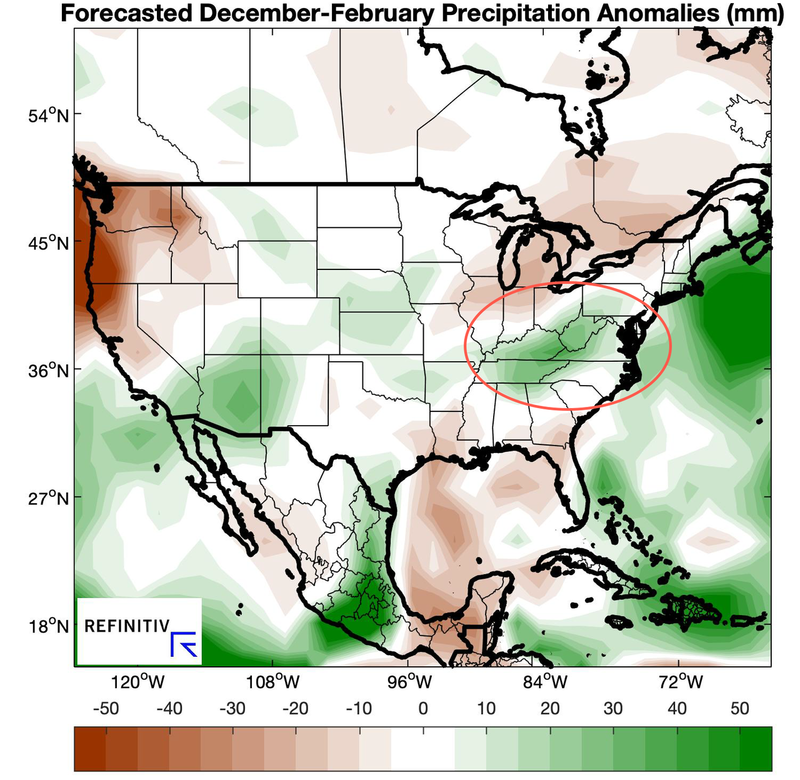
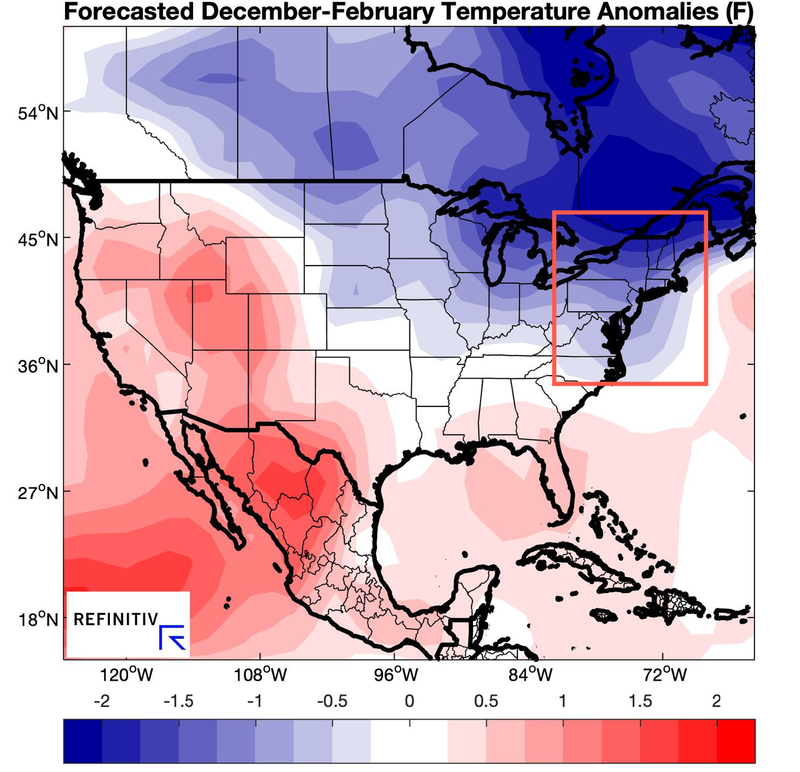
“The North America winter outlook suggests a cold season across the central/northern US. If this scenario develops, it would point toward elevated winterkill risks for winter wheat, though deeper snow cover than normal could offset the risks. The US Plains in particular show the potential for a cold but wet winter, which might allow snow coverage to protect the Hard Red Winter (HRW) wheat crop, while drier conditions farther east may put the Soft Red Winter (SRW) wheat crop at higher winterkill risk.”

Figure 8: Composite precipitation anomalies (mm) from the top December-February analogs based on the leading ENSO forecast indicators (via Reuters)

Figure 9: Composite temperature anomalies (°F) from the top December-February analogs based on the leading ENSO forecast indicators (via Reuters)

Winter is coming…


Tyler Durden

Sun, 11/03/2019 – 11:00

Tags

via ZeroHedge News https://ift.tt/2oLFbPo Tyler Durden

Break-Out Or Fake-Out?

Break-Out Or Fake-Out?

Authored by Sven Henrich via NorthmanTrader.com,

The Fed cut rates, the ECB officially launched QE, and a parade of administration officials touted progress on the ever elusive China trade deal for the 100th time and voila: Markets breaking out to new highs. But is the breakout a fake out?

Let’s explore some uncomfortable facts, charts and perspectives.

Firstly, and don’t laugh too much, let’s at least mention fundamentals.

GDP growth keeps slowing:

Earlier this week, the Commerce Department released Q3 GDP figures, which showed a marked slowdown year over year compared to Q3 2018. Real GDP growth has slowed this year from 2.9% to 1.9%. Personal consumption has slowed from 3.5% to 2.9%. Services have slowed from 3.4% to 1.7%. And gross private investment slowed from 13.7% to  negative 1.5%.

On Friday, the same day markets broke to new highs the Atlanta Fed pegged Q4 GDP at 1.1% while the New York Fed Nowcast dropped their Q4 GDP growth projection to 0.8%.

Now show me some history where markets sustained new all time highs with 1% GDP growth in Q4. Best of luck.

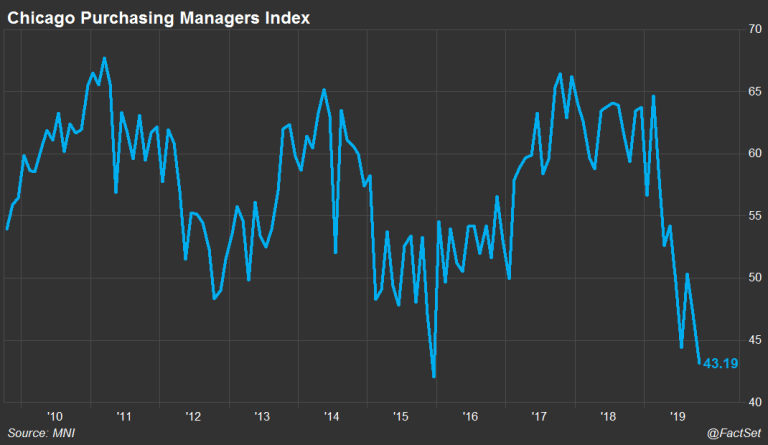
On Thursday the Chicago PMI missed expectations hard coming in at 43.2 versus 47 expected:

And on Friday ISM manufacturing also shows continued contraction at 48.3% albeit a slight improvement over September which came in at 47.8%.

The cheers on Friday? Supposedly the employment report as it beat lowered expectations, but nevertheless jobs growth remains in a steady trend of slowing growth.

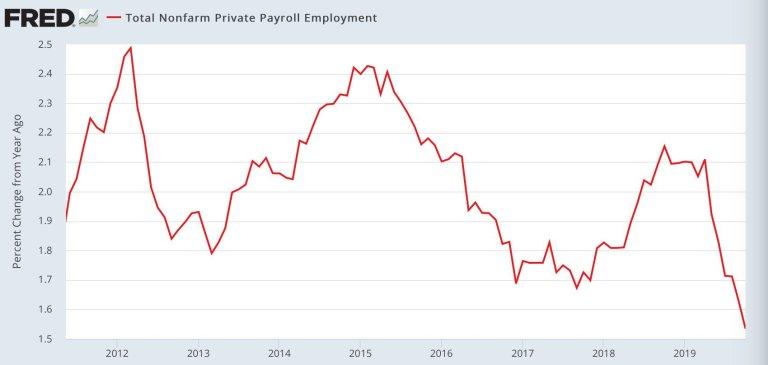
Most notable private employment growth has been sinking all year:

But none of this matters to this stock market at this stage, never mind that the jobs market is a lagging indicator.

Why doesn’t anything fundamental matter? The US Federal Reserve. As S&P companies are now reporting their 3rd quarterly decline in earnings the multiple expansion machine of 2019 continues unabated and is the primary rationale for the bull case: Synchronized global monetary easing will continue to float markets to new highs according to JP Morgan strategists.

This may well be the case or it may not.
Let there be no mistake: The Fed under Jay Powell, is the prime price discovery mechanism of this market. Who are you going to believe? Me or your own lying eyes?
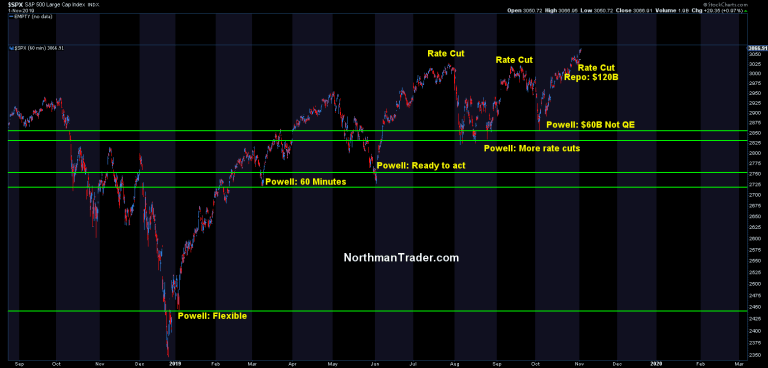
In January Powell propelled markets higher to the tune of over 3.5% in one day on his “flexible” speech. And every single corrective activity this year has found a sudden end in the warm arms of uncle Fed. The March pullback ended on the heels of Jay Powell’s 60 Minute interview. The May correction ended when Jay Powell signaled readiness to act at the beginning of June. And act he did. He cut in July, but it didn’t quite work as planned. Markets sold off. But fear not. On August 23rd, amid great market uncertainty, Jay Powell signaled more rate cuts to come and markets rallied. And in September  he delivered with a second rate cut, but again markets sold off. What a disappointment.

More firepower was needed as suddenly overnight rates spiked and repo activities were launched in the middle of September. But it wasn’t enough. Markets sold off into the beginning of October.

What did Powell do? He launched $60B per month in “not QE” at the beginning of October. Markets haven’t had a single down week since. And this week they cut cut rates again.

The cumulative picture: This is the most interventionist Fed since Ben Bernanke. Don’t believe me? Look at the balance sheet since September. Fed gone wild:

Let’s summarize the facts:

Since July the Fed has cut rates 3 times, since September they have increased their balance sheet by $261B, they have added repo, expanded it to $120B per day in October, they’ve launched a $60B treasury bill buy program all desperately designed to inject artificial liquidity into the system and to suppress rates. I repeat: This is the most interventionist Fed since Ben Bernanke.

And this is what it took to break markets to new highs.

But what exactly is better since last year? Growth? Earnings? None of the above. It remains a game of multiple expansion. And what do we have now? $23 trillion in US debt, trillion dollar deficits, 0.8%-1.1% Q4 GDP growth and a stock market valuation at 145% GDP.

The Fed it’s claiming it’s not QE, but markets keep acting like it.

Now let’s look at the price structure that is unfolding:

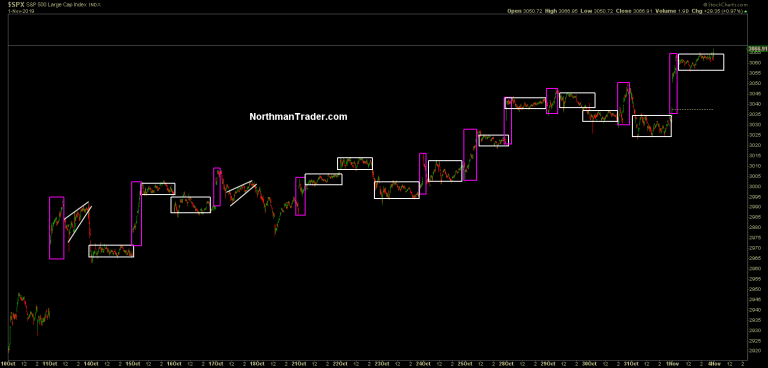
All price gains come with open gaps and ramps with virtually no intra-day price movements:

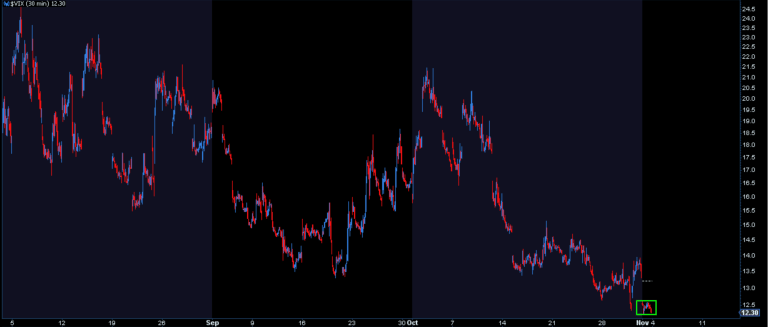
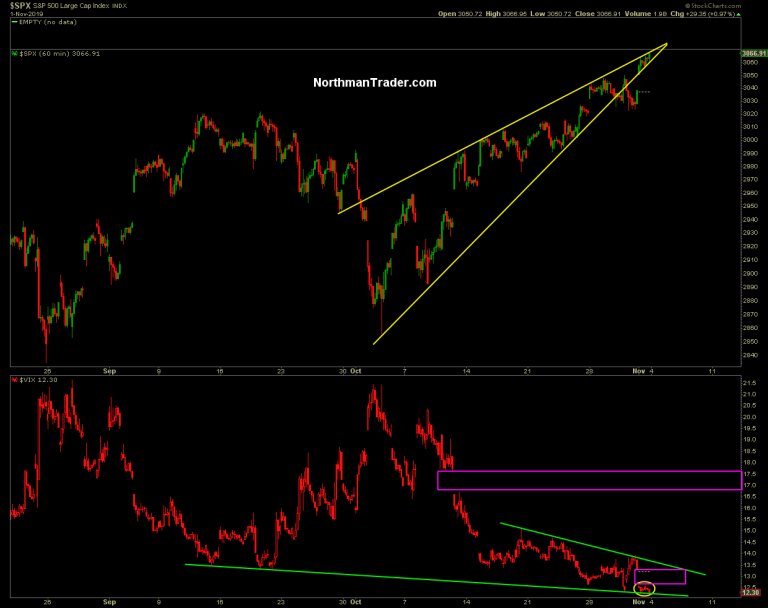
The result? Just like in the QE days of old volatility is getting crushed. On Friday the $VIX practically died:

Think this is normal? Hardly. Is it sustainable? Doubtful.

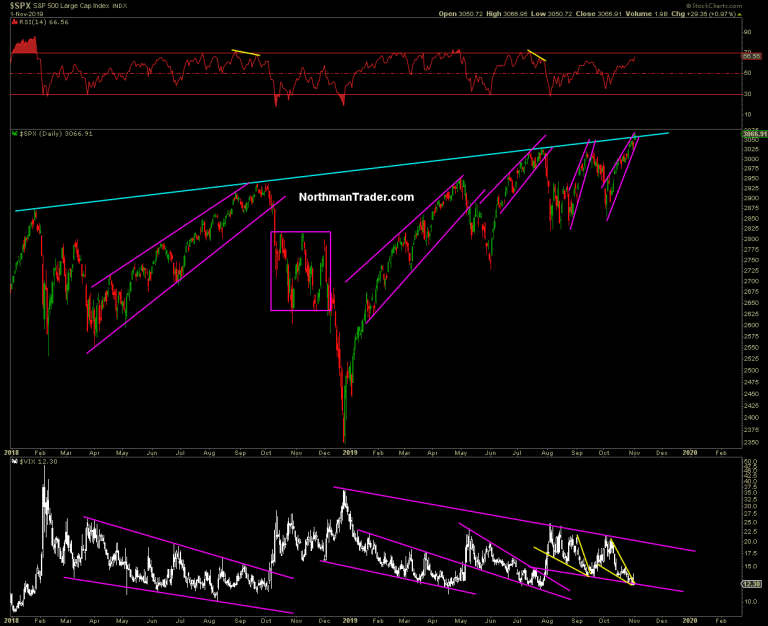
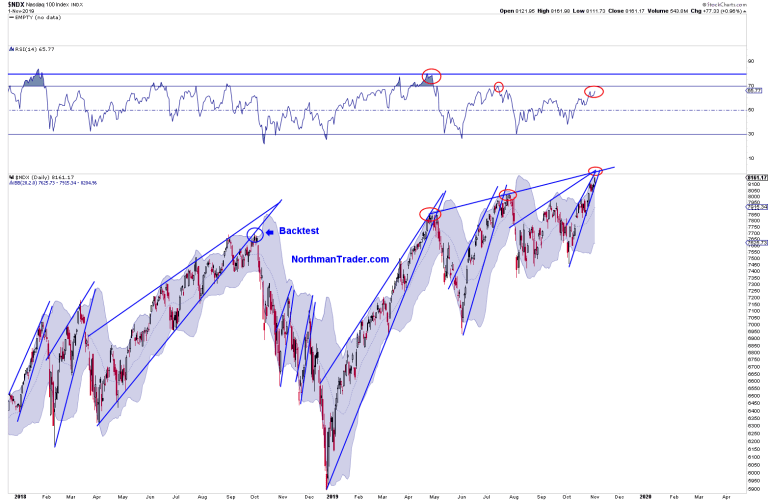
Indeed we can once again observe prices levitating in very tight wedge patterns amid extreme volatility compression:

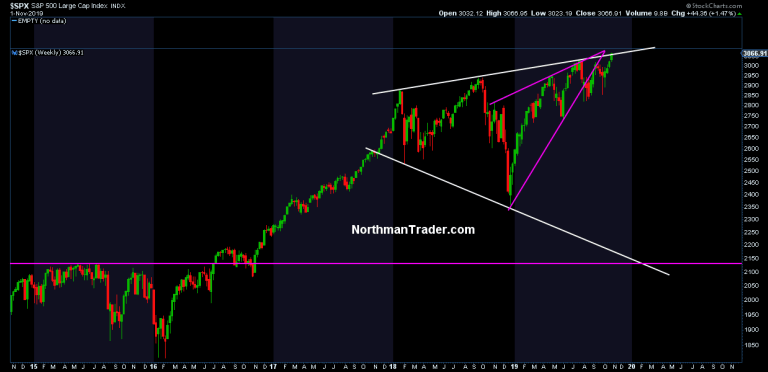
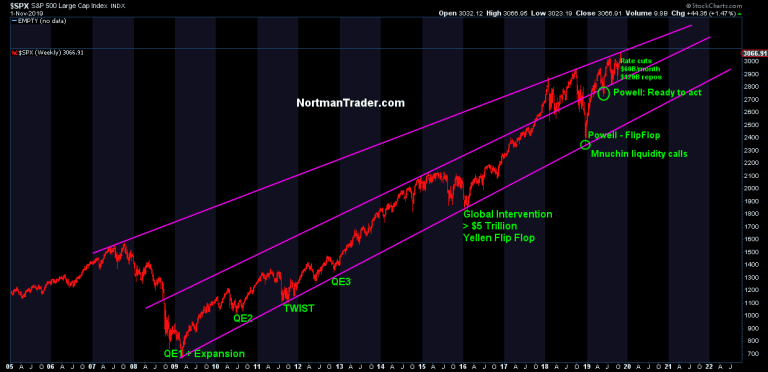
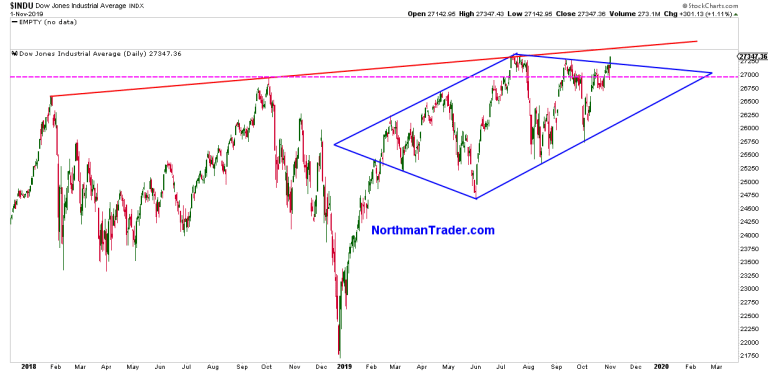
You will note that price closed slightly above the upper trend line on Friday and we can see this poke above on the larger Megaphone chart as well:

I’ve been on the record saying that a confirmed breakout out would be a breakout followed by a confirmed retest. This has yet to occur.

On a longer term chart we haven’t crossed above trend yet:

The key question of course: Is this a genuine breakout or a fake out?

Some considerations:

Firstly this current $VIX compression phase is entirely untested:

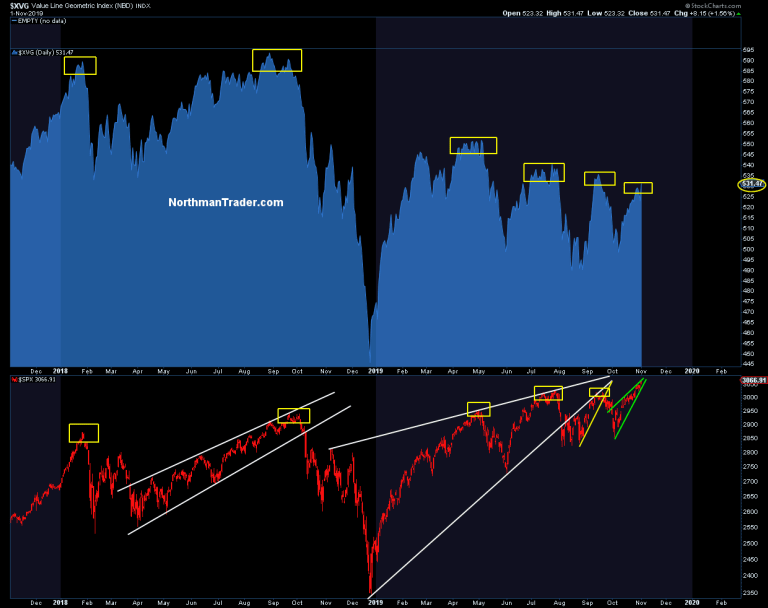
New highs have once again come on a lower read of the value line geometric index:

So it remains unconfirmed.

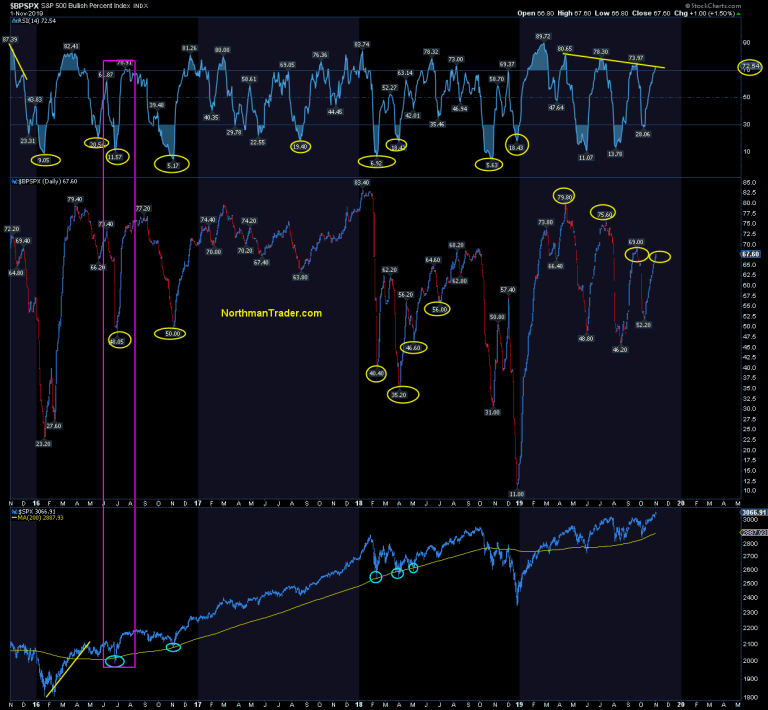
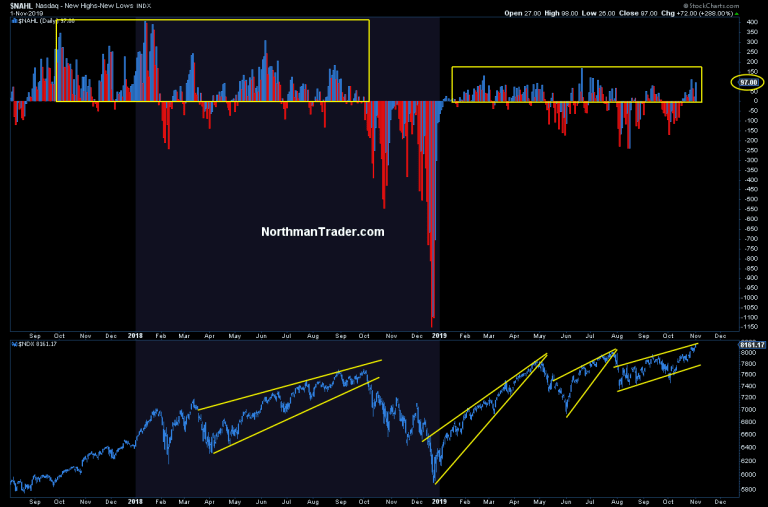
Negative divergences persist on all of these new highs:

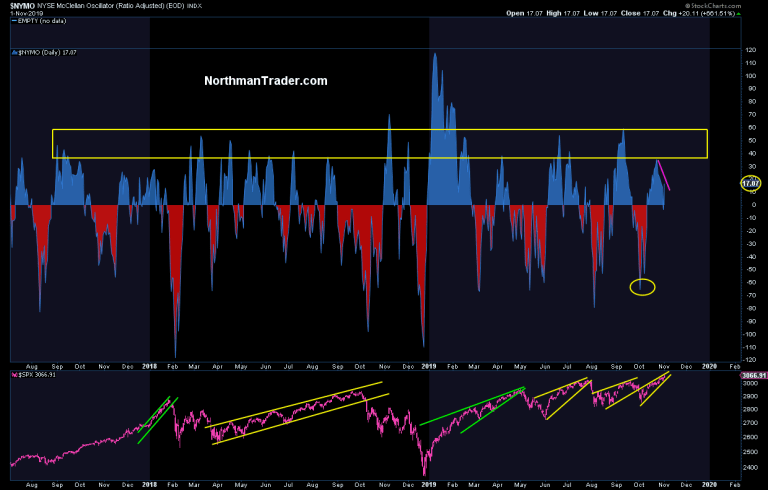
And if there was strength it is not to be found in $NYMO which closed at a lower high on Friday:

I could point to more, but you get my drift: This rally remains thin, thin on volume, thin on signal conformation and entirely dependent on volatility compression.

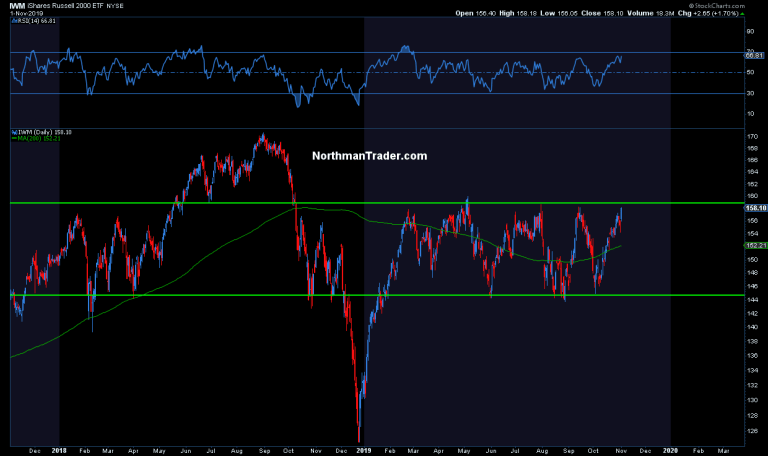
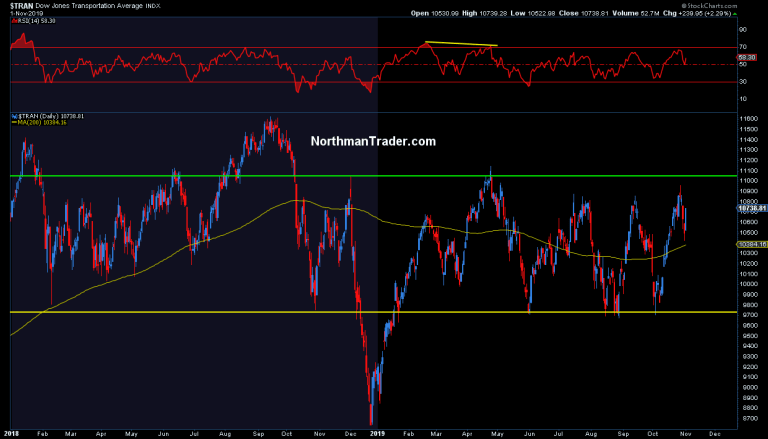
Small caps and transports still haven’t made new highs:

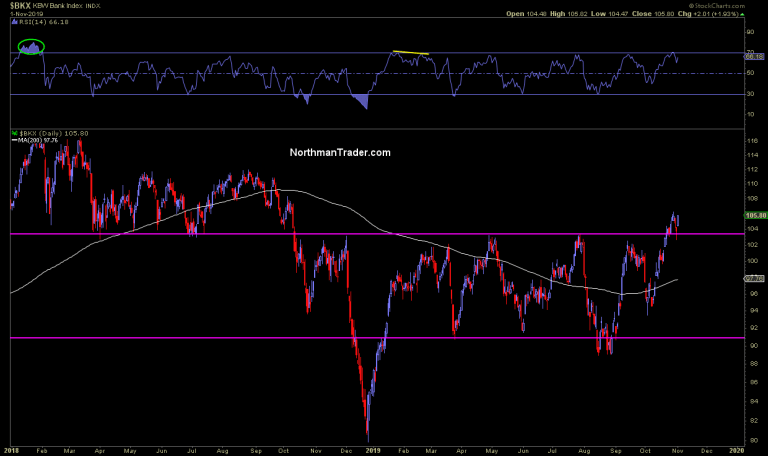
But we see a move higher in banks:

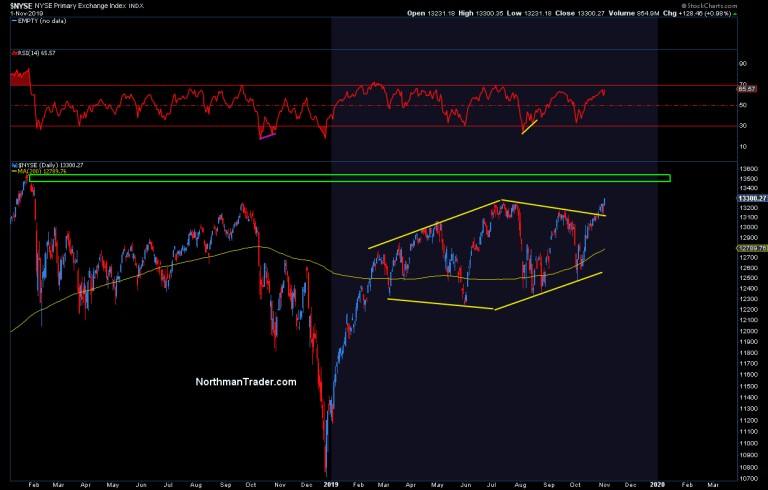
and breakouts in some indices, but ALL face major resistance just ahead:

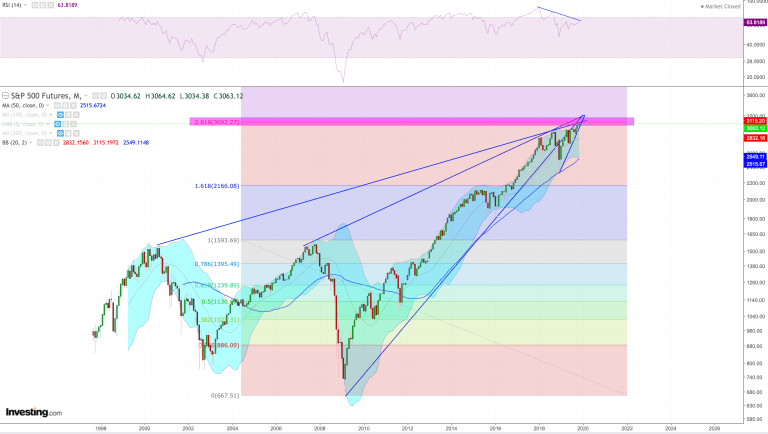
In terms of risk higher. Per my combustion case from April, $ES is within a stone’s throw of its 2.618 fib:

And, for giggles, I’ll throw a historic oddity your way.

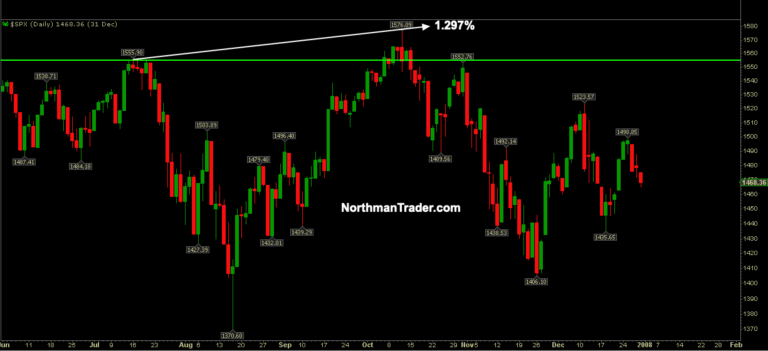
In 2007 $SPX made a new all time high in July and then, following the Fed cutting rates and other high in that October. A marginal new high by 1.297% to be precise:

That was the all-time high then. Nobody knew it then. Growth was slowing, valuations were high, Wall Street was bullish, subprime was contained and no recession was coming. But it did. In December is started.

Why is that 1.297% so giggle worthy?

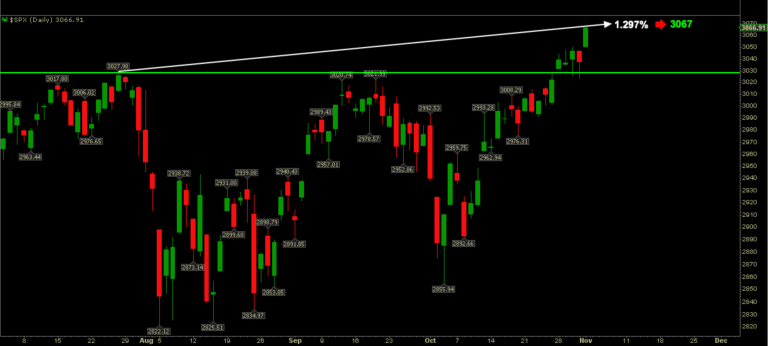
Well, you may appreciate the irony. This July $SPX hit a high of 3028. 1.297% higher from there? Friday’s close precisely:

Now I fully acknowledge that this may mean absolutely nothing, but it is an interesting fluke of history at the very least.

We’ll know more next week.

Bottomline: From my perch this breakout remain unconfirmed, but upside risk remains. The structure of the rally is poor, driven by non stop levitation gaps, ramps and camps virtually void of any intra-day price discovery. Fundamentals have yet to show any notable improvement, multiples keep expanding ever so reliant on ever more aggressive central bank intervention.

My question for 2019 has been one of efficacy and it must be acknowledged that, while the Fed has missed its inflation target for over 10 years, it continues to succeed in bringing about asset price inflation:

I know of no market history where these type of valuations are sustainable concurrent a quarter with 1% or so GDP growth and in context of the chart picture outlined above I remain skeptical of the veracity of any breakout. Volatility is too low, open gaps are too many, negative divergences too plentiful. But for now, price has exceeded our summer sell zone of 3000-3050 by 0.5% and has transitioned into our Combustion sell zone.

Without a confirmed reversal markets can continue to drift higher as they have been. For now the added liquidity machine introduced by the Fed remains in full control. On an eventual reversal bears have to prove their case and reverse $SPX back below 3,000 as this area will now act as support.

For now the forces of intervention remain in full control in spite of a significant lower growth picture in 2019 versus 2018 proving again: Global synchronized central bank intervention appears to be working again, for now. But the core issue: Markets can no longer move higher without central banks always coming to the rescue and haven’t been for over 10 years now. It’s a central committee subsidy program and the antithesis to free market capital flows and as a result of a liking fundamental unpinning to the multiple expansion markets are at building risk of a sizable risk off event

*  *  *

For the latest public analysis please visit NorthmanTrader. To subscribe to our market products please visit Services.


Tyler Durden

Sun, 11/03/2019 – 10:30

via ZeroHedge News https://ift.tt/36rmCkq Tyler Durden

The Next Shoe In The Farm Crisis Drops: Bankruptcies Soar 24%

The Next Shoe In The Farm Crisis Drops: Bankruptcies Soar 24%

The American Farm Bureau (AFB) warned Wednesday that farm bankruptcies are entering a parabolic move. 

The farm crisis, as we’ve pointed out, is only accelerating and will likely be on par with the farm disaster that was seen in the early 1980s.

President Trump’s farm bailouts, given to farmers earlier this year, appears to be failing at this moment in time, as a tsunami in farm bankruptcies is sweeping across the country. 

With record-high debt, collapsing farm income, and depressed commodity prices, US farmers are dropping like flies as there’s no end in sight in the 15-month long trade war

AFB said farm bankruptcies for the 12 months ending in September, totaled an astonishing 580 filings, up 24% YoY.

The number of Chapter 12 farm bankruptcies [580 filings] for the period was the highest since 676 filings were recorded in 2011. For 3Q19, farm bankruptcies were slightly lower, down 2% YoY. 

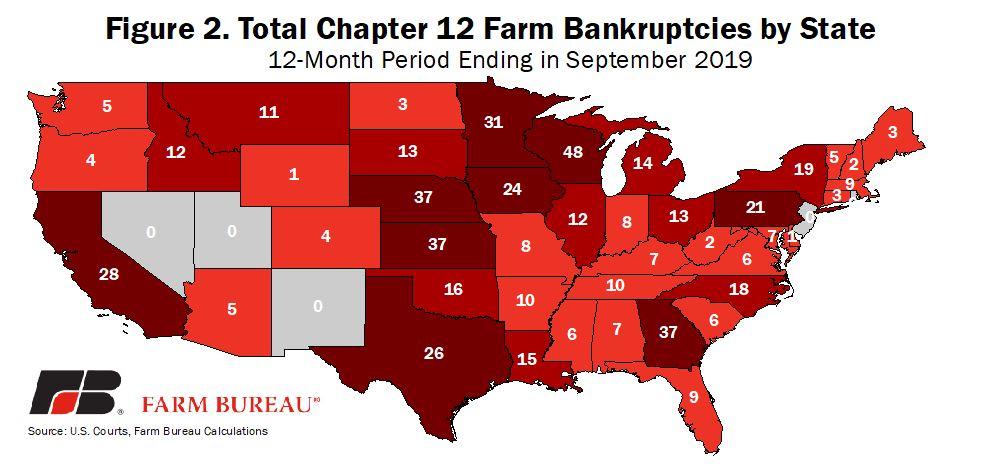
“Total bankruptcies filed by state vary significantly, from no bankruptcies in some states to more than 20 filings in others. Bankruptcy filings were the highest in Wisconsin at 48 filings, followed by 37 filings in Georgia, Nebraska, and Kansas. Iowa, Kansas, Maryland, Minnesota, Nebraska, New Hampshire, South Dakota, Wisconsin, and West Virginia all experienced Chapter 12 bankruptcy filings at or above 10-year highs,” AFB wrote. 

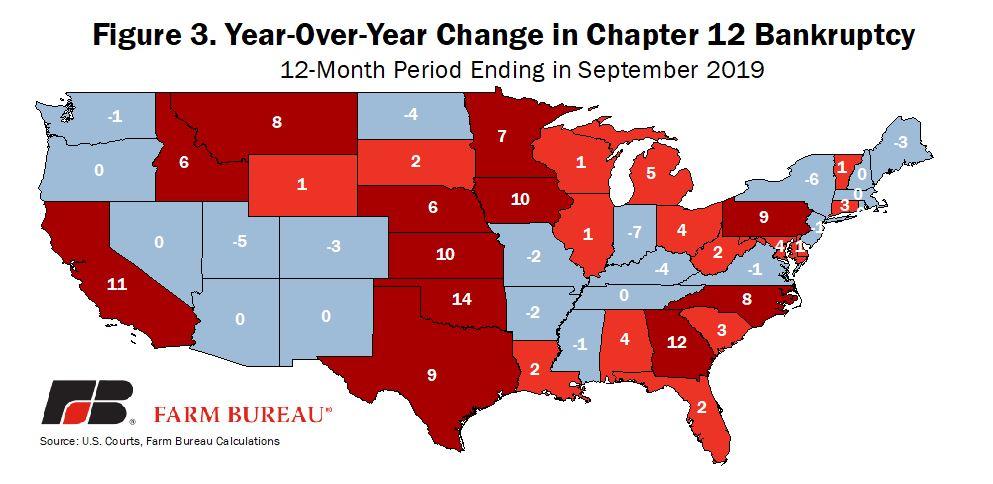
AFB’s next chart is YoY change in farm bankruptcies over the 12 months, which shows bankruptcies accelerated the greatest in Oklahoma, Georgia, California, Iowa, and Kansas. 

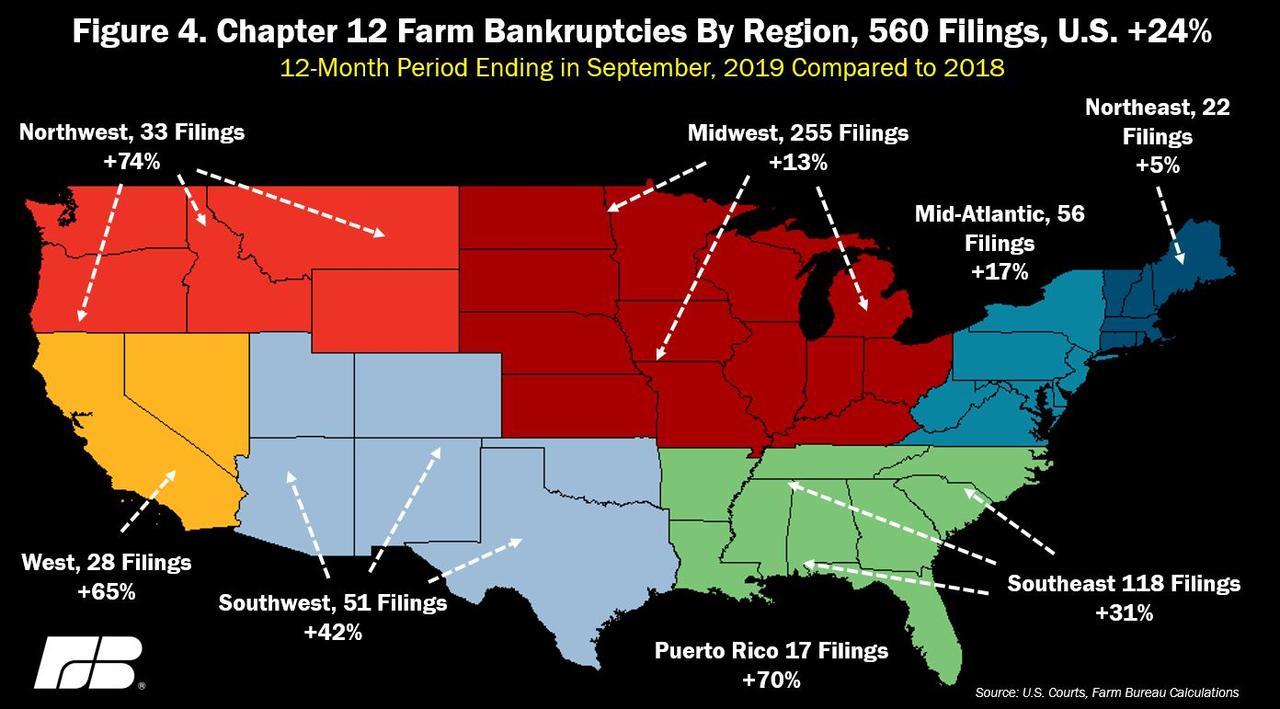
The next chart from AFB outlines how bankruptcy filings over the previous 12 months ending in September, jumped in every major region across the country. Some of the most significant increases were seen in the Midwest, up 40% over the period.

Chapter 12 farm bankruptcies are expected to increase through the next several quarters. This could be problematic to President Trump as the 2020 election year begins. Many of the bankruptcies are occurring in election battleground states like Wisconsin. 


Tyler Durden

Sun, 11/03/2019 – 09:55

via ZeroHedge News https://ift.tt/2qgHbj3 Tyler Durden

There’s No Stopping The World’s Most Politically-Charged Pipeline

There’s No Stopping The World’s Most Politically-Charged Pipeline

Authored by Irina Slav via OilPrice.com,

This week, Denmark granted Gazprom approval for its Nord Stream 2 gas pipeline project, a project that is set to bring 55 billion cubic meters of Russian gas into Europe annually. It is one of the most controversial pipeline projects in the world and is now moving ahead despite strong opposition from multiple EU members and the United States.

The geopolitical tensions surrounding the development of Nord Stream 2 are unprecedented. To begin with, Russia has very poor relations with the Baltic states and Poland, nations who will almost always fight against anything they see as empowering Russia geopolitically. Then there is Ukraine, a nation that is strongly against the pipeline due to its fear of losing the transit fees that it currently charges Russia for exporting gas to Europe. Finally, and perhaps most importantly, the United States sees this pipeline as a direct threat to its soft power in Europe as well as a threat to its growing LNG exports.

But for all the politics and attention that this pipeline is attracting, the simple truth of the matter is that Europe, and more specifically Germany, needs this natural gas. Germany plans to shut down all its nuclear reactors by 2022. Many have questioned the wisdom—and some even the sanity—of that decision, but it remains government policy. The generation capacity the is being lost in that sector will need to be replaced, in the short term at least, by natural gas.

Despite its green reputation, Germany is a country that generates a surprisingly large portion of its total energy from coal. Its total installed coal-fired capacity is close to its solar capacity, at 44.9 GW, versus 47.9 GW for solar. At today’s growth rates, it’s current solar and wind capacity will not be enough to replace the retired nuclear plants. The only other option, which would be boosting the share of coal in the country’s energy mix, is a political non-starter in Germany. Natural gas is, therefore, the only viable replacement and Germany is fully aware that its gas consumption is set to soar in the coming years.

Now, this gas doesn’t have to come from Russia, of course. It could come from the United States in LNG tankers. In fact, the European Union as a whole earlier this year promised President Trump to double its imports of U.S. LNG over the next five years. But they didn’t make the promise voluntarily. It came in response to a threat from Trump to slap import tariffs on European cars.

One may wonder why the EU, for all its anti-Russian rhetoric and sanctions, and legislative amendments aimed at curbing Gazprom’s role on the European gas market would need the incentive of a tariff threat to diversify away from Russian gas.

The answer is, again, simple. It’s the price.

U.S. liquefied natural gas has to be, well, liquefied first, then loaded on a tanker and shipped across the ocean to Europe. Russian gas runs through pipelines as is. And, even if LNG were there answer, there is Novatek’s Yamal LNG plant that is exporting the liquefied fuel to Europe, which is much nearer Yamal than the Gulf Coast.

Abundant natural gas production and the subsequent low prices have made the U.S. a growing exporter and a force to be reckoned with. Yet producers still want to make profits rather than pump gas for political purposes. Ultimately it all comes down to one simple fact, Europeans pay more for U.S. LNG.

“Given our heavy dependence on imports, U.S. liquefied natural gas, if priced competitively, could play an increasing and strategic role in EU gas supply,” said the European Energy Commissioner, Miguel Arias Canete, earlier this year.

The operative phrase is “if priced competitively”, as supported by the statement of a Total official commenting on Trump’s tariff threat at the time.

“We need to create the demand in order to justify these logistics and this investment,” said Total’s president of gas operations, Laurent Vivier in May. “That will come to European policy and setting what role we want gas to play in Europe”.

Ultimately, for all the political posturing and threats of sanctions, the Trump administration and its allies on this matter have never been in a position to stop Nord Stream 2.  While geopolitics are powerful, the fundamentals will almost always win out. If there is demand, supply will follow. The message to the U.S. from Europe when it comes to natural gas is loud and clear, “Make it competitive and we’ll take it”.


Tyler Durden

Sun, 11/03/2019 – 09:20

via ZeroHedge News https://ift.tt/32egXuC Tyler Durden