460 Billion Reasons Why Bond Yields May Jump Next Year
One week ago, we discussed the ongoing conundrum which has stumped Wall Street strategists, namely the record outflows from equity funds, surpassing even the year of the global financial crisis…
… as stocks hit all time highs, not on earnings growth but entirely due to PE multiple expansion…
… which Goldman summarized by saying that “with S&P 500 earnings on track for roughly zero growth from this time last year, solid returns likely would not have been possible without central bank support.”
We also discussed what JPMorgan thought would finally resolve this conundrum: in his weekly Flows and Liquidity report, JPMorgan quant Nikolas Panigirtzoglou wrote that as a result of the tremendous market performance in 2019 which would finally sucker retail investors in, he expects a “Great Rotation II” as investors finally flee bonds funds and rush to allocate money to equities:
If this view proves correct and the overall cyclical picture looks better over the coming months and quarters, retail investors are more likely to shift from a risk-off mode to a risk-on mode next year, by reversing this year’s equity fund selling and by reducing drastically this year’s extreme bond fund buying. Such a dramatic flow shift would be equivalent to another Great Rotation, i.e. a repeat of the abrupt shift away from retail investors accumulating bond funds to buying equity funds seen previously in 2013. In other words, 2020 would be the year of Great Rotation II, in a repeat of 2013 the year of Great Rotation I. – JPMorgan
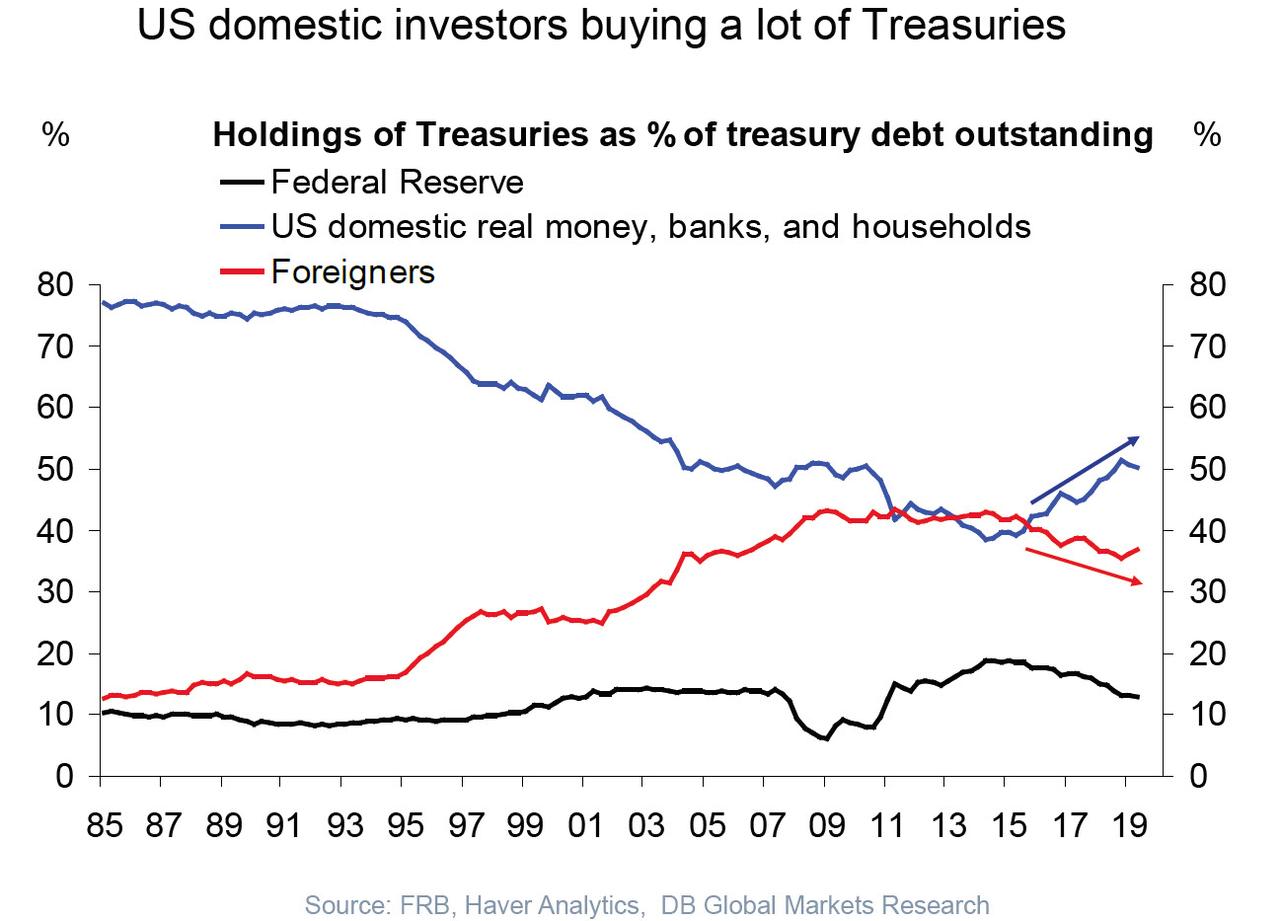
Whether or not JPM’s thesis for a great flow of funds from bonds to stocks will finally come true – recall, this is the base case assumption at the start of every year, and so far it has proven wrong for 6 years in a row – remains to be seen, it led to an interesting tangent: if investors dump bonds in a year when the US budget deficit is expected to be well over $1 trillion and when foreign buyers have been increasingly shrinking their purchases of US bonds…
… just who will buy all those Treasurys the US plans to sell in 2020 if retail says no?
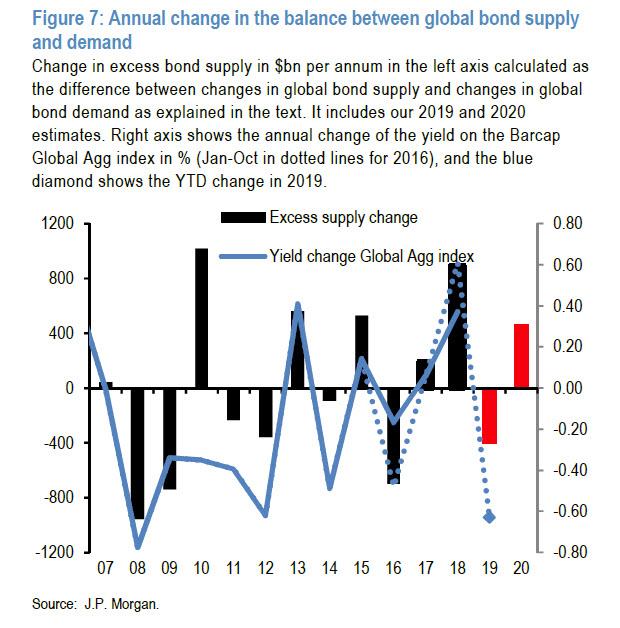
That just also happens to be the topic of Panigirtzoglou’s latest note, in which he looks at the consequences of his prior Great Rotation call, and concludes that if he is right, that would be particularly bad news for US Treasurys, which could find themselves with a supply/demand shortfall as high as $460 billion in 2020, a sharp reversal to this year’s $400 billion improvement.
Starting with the supply picture, JPM observes that on bond supply, 2019 saw the fourth consecutive year of increases in bond supply, rising to $3.13tr, the highest level since 2009.
Some more details: over the past four years, annual global bond supply has gone up by almost $1tr driven by both government bond and spread product supply. This $1tr increase over the past four years reflects both an increase in government deficits led by the US, but also an increase in corporate bond supply as companies took advantage of lower bond yields globally to pre-finance their needs and increase their leverage.
The good news here is that JPMorgan forecasts that 2020 will see a significant reversal in recent years’ bond supply trend with a $375bn decrease, bringing the global annual bond supply to $2.76tr in 2020, its lowest level since 2016. This forecast of a $375bn decline in global bond supply next year is driven by an expected reduction in both government (-$211bn) and spread product (-$164bn) supply.
The expected reduction in government bond supply reflects a decline in net supply in the US as the Fed is no longer contracting its balance sheet and as maturing MBS are re-invested into USTs (up to a monthly cap of $20bn), which is only partially offset by a higher government deficit in the UK and Eurozone. The expected reduction in spread bond supply next year is driven by lower corporate bond issuance across the US, Europe and EM, as corporates globally appear to have pre-financed some of their needs in previous years and as they try to rein in their leverage globally. The decline in corporate bond supply globally is only partially offset by higher supply in US mortgages (MBS) next year as the Fed reinvests a portion of MBS prepayments and maturities into Treasuries and the US economy improves, and by higher supply in US Munis, leaving our total spread product supply estimate for 2020 lower by $164bn relative to 2019.
What about notable demand changes?
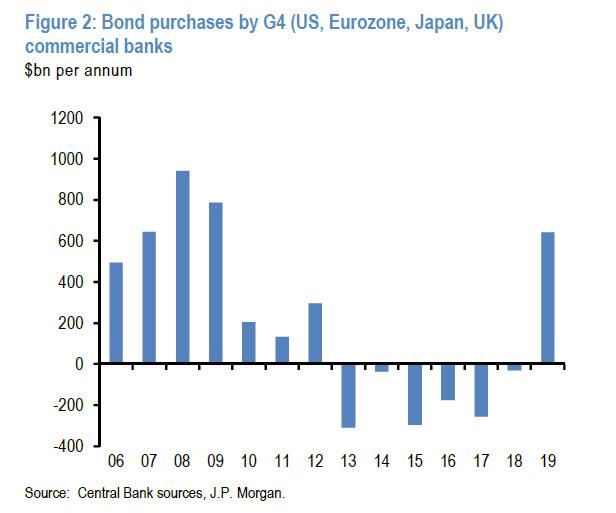
Here, the two biggest surprises of this year have been in bond fund demand by retail investors and in bond purchases by G4 (US, Eurozone, Japan, UK) commercial banks. The former saw close to a record high annualized pace of $850bn this year, while the latter at $640bn saw its highest level since 2009 (this surge in bond purchases may also be behind the September repo market fireworks as banks found themselves holding on to too much TSYs at the expense of cash).
For JPM both of these levels are unsustainable and the bank expects some normalization in 2020. In terms of the arguments for an expected normalization in the bond fund flow next year, JPM reminds us of the three reasons listed in last week’s publication, based on the historical pattern following extreme bond fund flows in a calendar year, based on the response of bond fund flows to previous year’s returns and based on our expectation that retail investors will adopt more of a risk-on behavior next year in response to an improvement in the cyclical picture. As a result, the biggest US bank pencils in a deterioration in bond demand of around $600bn next year.
In listing its arguments for a “normalization” in bond purchases by G4 commercial banks in 2020, Panigirtzoglou sees three reasons:
1) Bond purchases by G4 commercial banks in 2019 were around $300bn higher than the level that would be justified by the reduction in the QE impulse between 2018 and 2019. This QE impulse was reduced by close to $760bn between 2018 and 2019, and applying a historical beta of around -0.5 would justify an increase in bond purchases by around $380bn, i.e. from -$30bn in 2018 to $350bn in 2019. Instead, we got $640bn for 2019 which is almost $300bn higher.
2) One reason for this $300bn of “excess “ bond purchases has been a bigger than in previous years expansion of G4 commercial bank balance sheets, by $4tr this year i.e. from a total size of $85tr in 2018 to $89tr to 2019. This $4tr balance sheet expansion is more than double the average pace of the previous five years. A potential normalization in commercial bank balance sheet expansion pace from $4tr this year to $1.5tr-$2tr next year should be accompanied by a normalization in bond purchases also. This implies that much of this $300bn of “excess” bond purchases should be unwound next year.
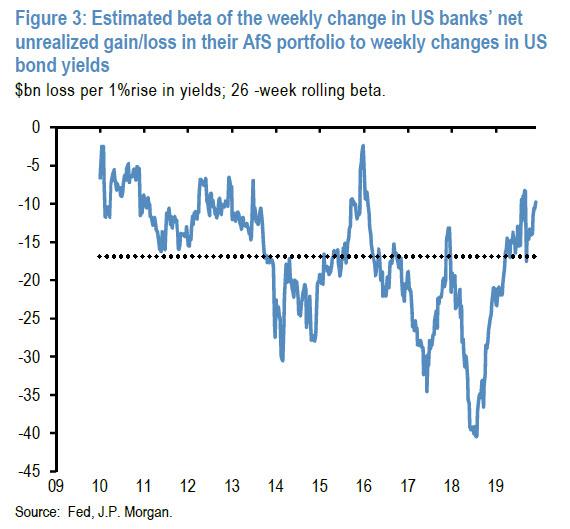
3) Commercial banks were also caught up with short duration stance at the end of last year relative to historical averages, and since then they have been struggling to move back to average by raising their bond purchases. This short duration stance is indicated by Figure 3, which measures the sensitivity of US banks’ weekly changes in net unrealized gains in their available-for-sale portfolios to changes in UST yields.
When this metric is very negative or below average it implies a long duration stance by US commercial banks and when this metric is above its historical average it implies a short duration stance. As can be seen in Figure 3 US banks appear to have shifted to short duration stance during 2018 and as a result they were caught wrong-footed this year. This short duration stance has yet to normalize according to Figure 3, something that creates upside risk to commercial bank bond purchases in 2020.
So what does this all mean for next year?
If one excludes the Fed’s T-bill purchases which – for now – do not entail duration (although they will in 2020), the increase in the QE impulse between 2019 and 2020 is $460bn. Applying a historical beta of around -0.5 would justify a decrease in G4 commercial bank bond purchases by around $230bn, i.e. from $640bn in 2019 to $410bn in 2020. Point 2) suggests that $300bn of “excess” bond purchases by commercial banks should be largely unwound next year as the pace of commercial bank balance sheet expansion normalizes. But the point on current short duration stance provides an offset as it creates upside risk to commercial bank bond purchases into 2020. As a result, JPM assumes that half of this $300bn of “excess” bond purchases by commercial banks should be unwound next year. In turn this implies a forecast of G4 commercial bank bond purchases for 2020 of $410-$150bn=$260bn, or a deterioration in bond demand of around $380bn.
Then there are the G4 central banks which saw a second year of significant downshifting in bond demand in 2019, with the 2018 reduction in bond demand of $1.1tr relative to 2017 followed by a further $750bn reduction in 2019, largely on the back of the BOJ slowdown in QE. This year’s negative impulse came as a result of the Fed continuing its balance sheet contraction up to 1 August, which saw around a $300bn decline in Treasury and MBS holdings, as well as the BoJ continuing its stealth taper and the ECB having ended its net purchases in end-2018 before re-starting purchases in November. A year ago JPM had expected around a $550bn reduction, and the majority of this year’s negative surprise came from the BoJ’s more aggressive slowing of net purchases. Moreover, when the Fed shifted back to balance sheet expansion to accommodate for the greater demand for its liabilities, it chose to do so via T-bills which is excluded for now from JPM’s supply and demand analysis.
For next year, the Fed is set to continue reinvesting maturing MBS securities up to a monthly cap of $20bn into Treasuries, which represents a re-allocation rather than a net change in aggregate bond demand. And while T-bills are excluded from a net coupon analysis, the fact that JPM’s rates researchers expect T-bill supply to be negative next year means we see a portion of the Fed’s balance sheet expansion next year likely to be conducted via Treasury purchases. For the ECB, we expect it to continue buying bonds at a €20bn/m pace for the course of 2020. Finally, the BoJ’s stealth taper process is expected to continue, with the net purchase amounts likely approaching zero. With the BoE on hold in terms of balance sheet policy, overall for the G4 central banks JPMorgan expect an improvement in bond demand of around $460bn.
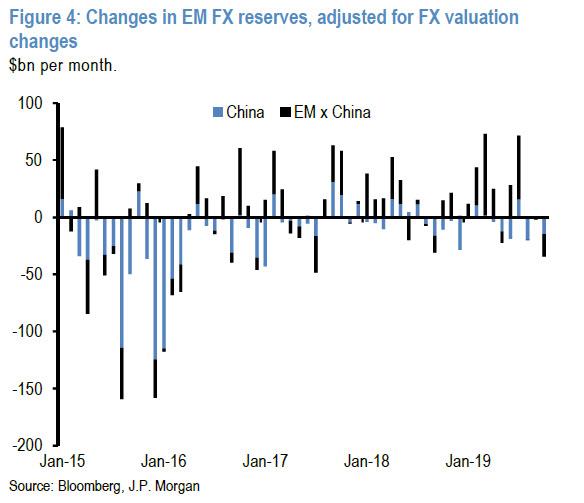
Other sources of demand include official demand, such as EM reserve managers, whose net bond purchases in 2019 amount to only $20bn, which is weaker than JPM’s projection from a year ago of $130bn. For next year, JPM see essentially flat bond demand from reserve managers, as the modestly positive current account balances for EM economies have offsets from depreciation pressures on EM currencies over the balance of the year and the prospect of weaker oil price.
Then there are pension funds and insurance companies. For these buyers of bonds, JPM estimates that net bond demand for 2020 will remain at an above average pace consistent with this year’s pace of around $620bn.
Putting it all together, the combination of a $840bn deterioration in bond demand and a $375bn decrease in bond supply results in a net deterioration in the bond supply/demand balance of around $460bn in 2020, reversing this year’s $400bn improvement
In turn this implies potentially substantial upward pressure on bond yields next year particularly if JPM’s bond fund and G4 commercial bank bond purchases estimates for 2020 prove correct; this is because of all the different components of demand or supply, these two are the ones that have exhibited the highest correlation with annual bond yield changes.
Tyler Durden
Mon, 12/02/2019 – 19:25
via ZeroHedge News https://ift.tt/33Izz6E Tyler Durden


