Is Tech About To Suffer A “Dot Com” Bubble Collapse? It’s Suddenly All In China’s Hands
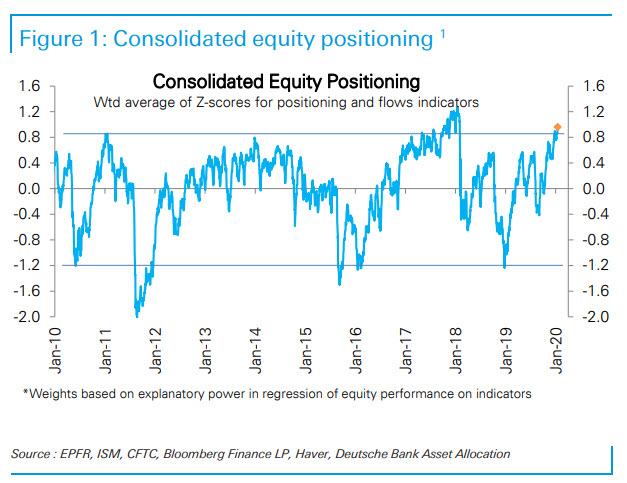
For the past two weeks we warned readers (in Institutions, Retail And Algos Are Now All-In, Just As Buybacks Tumble and Never Before Seen Market Complacency, As Everyone Goes Even More “All In“) that we now effectively at the most overbought levels on record, with virtually every class of investors – from institutions, to retail, to systematic and algos – now all-in.
It now appears that this massive euphoria, which culminated in the biggest one-day selloff since August, may have been a tad excessive, hitting just as China was forced to admit it has a major viral epidemic on its hands (although in retrospect Ray Dalio’s Gartmanesque “cash is trash” declaration just days earlier in Davos, may have been just as powerful a catalyst for the derisking as the Coronavirus pandemic).
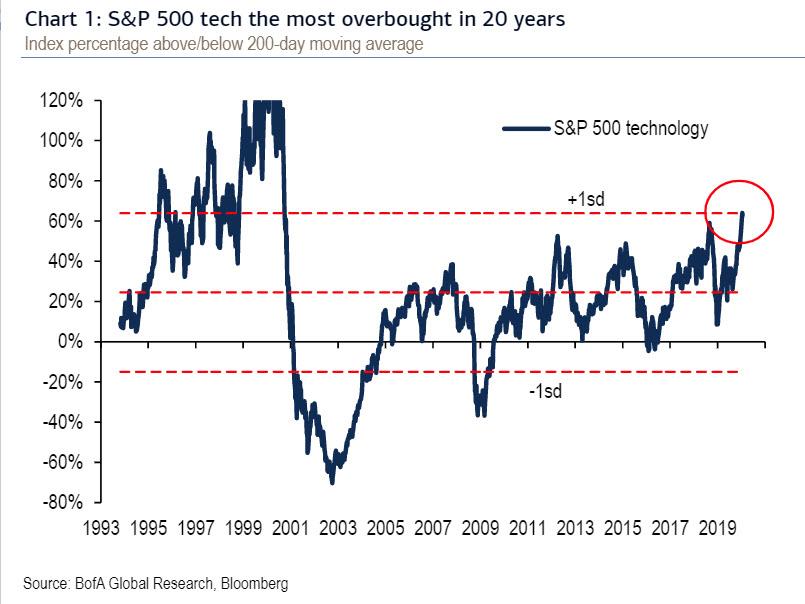
And nowhere was the investor euphoria more apparent than in the tech sector which, as the BofA chart below shoes, was the most overbought since dotcom bubble.
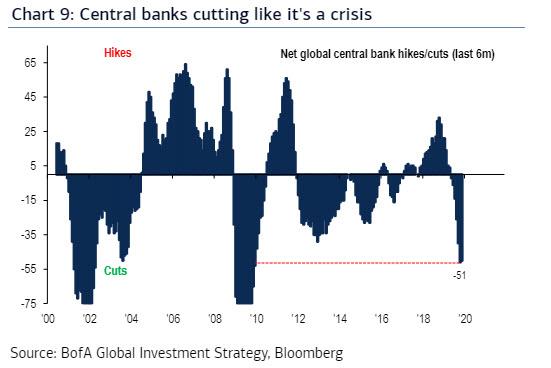
Then, on Friday, as we duly reported fears that China is losing the fight to contain the Coronavirus spread finally exploded, and sent the Dow red for the year, with the S&P 500 index now flat for 2020 as positive early results from 4Q 2019 earnings season offset the economic concerns of the coronavirus. In short, much of the euphoria that was unleashed by the Fed’s launch of QE4 in October to “fix” the repo market, coupled with central banks cutting rates as if “it’s a crisis” in the words of Bank of America…
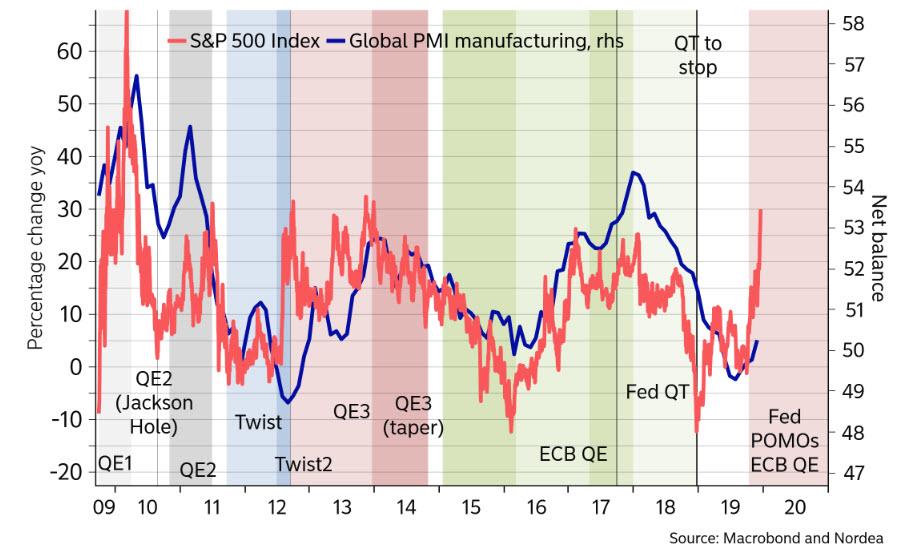
…is now gone, and what’s worse, with the market pricing in the strongest recovery since the financial crisis…
… concerns that China’s economy may slump to a 5% or lower GDP as a result of the viral pandemic, have come at the worst possible time. And so, with the market finally cracking, suddenly panicked investors are asking if what has gone up in almost vertical fashion over the past year is about to come down.
Namely the handful of tech stocks that has been at the forefront of the S&P’s tremendous ascent: the FAAMGs.
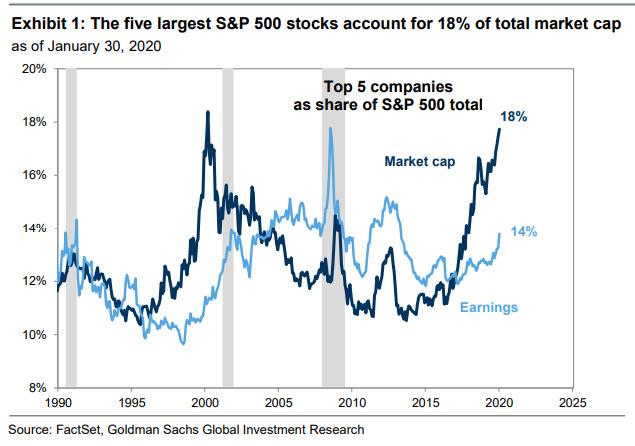
As Goldman’s David Kostin write over the weekend, picking up where Morgan Stanley’s Michael Wilson left off two weeks ago, “today, the S&P 500 market cap is concentrated in the five largest stocks to a degree not witnessed since the peak of the Tech bubble. The five firms – FB, AAPL, MSFT, AMZN, GOOGL – collectively account for 18% of S&P 500 market cap, the largest share since 2000“…
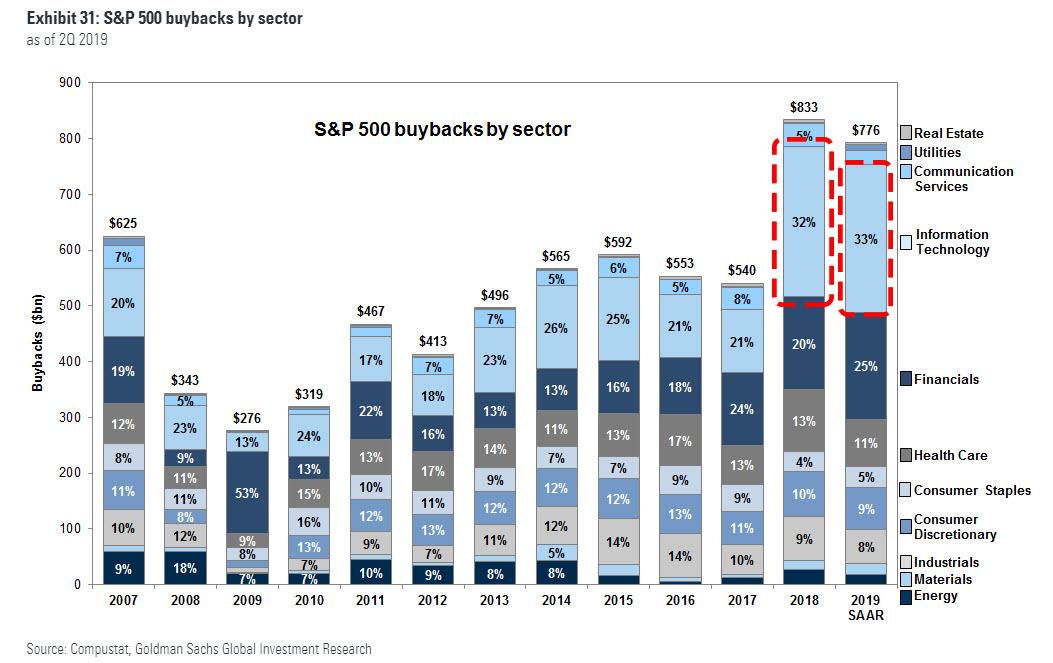
… even as earnings are slightly less concentrated, with the top five stocks represent 14% of profits, the highest level since 2015. During the past three months, aggregate FAAMG returns have been double the S&P 500 index (19% vs. 8%) and generated 37% of the gain for the entire index during that time. And with most of tech earnings roughly unchanged over the past year, the bulk of this price increase was the direct result of multiple expansion, which in turn was made possible by a record expansion in stock buybacks among tech companies.
So with everyone casting a fearful eye to the first tech bubble in 2000, investors are understandably curious what happened back then, and are we about to witness the second coming of the dot com bubble bursting.
Here, Kostin, which has a 3,400 year-end price target understandably does everything in its power to mitigate fears that the Nasdaq is about to experience a second catastrophic plunge. Here is what Kostin writes:
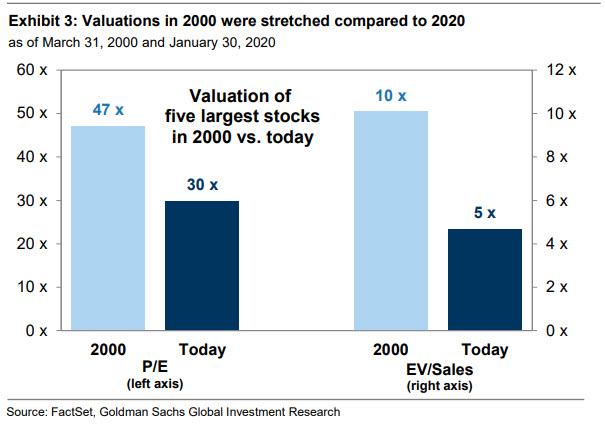
Twenty years ago, the US equity market was also dominated by five stocks: MSFT, CSCO, GE, INTC, and XOM. In March 2000, these stocks accounted for 18% of total S&P 500 market cap and were priced at a substantial premium to the index. Collectively, the firms traded at a forward P/E of 47x (vs. 24x for S&P 500) and 7.3x trailing EV/sales (vs. 2.7x). The elevated valuations reflected expectations for rapid growth in aggregate earnings and sales during 2000 and 2001.
In contrast, full-year 2001 results for the five largest stocks in March 2000 came in nowhere near the lofty initial expectations. In aggregate, sales fell by 7% (vs. expectations of +15%), net margins contracted by 150 bp (from 13% to 11% vs. the original forecast of 1100 bp of margin expansion) and net income fell by 18% (vs. forecast of +14%). Three of the five firms actually realized negative sales growth in 2001 (INTC: -21%, XOM: -10%, CSCO: -24%) and three reported negative EPS growth (CSCO: -72%, INTC: -68%, XOM: -6%).
In contrast to the devastating misses suffered by the “Big Five” in 2000, Goldman claims that “lower growth expectations, lower valuations, and a greater re-investment ratio suggest the current concentration may be more sustainable than it proved to be in 2000.” To underscore this point, Goldman shows the following chart according to which valuations of the five largest companies now are far more manageable compared to 2000.
But as even Goldman admits, “in order to avoid repeating the share price collapse experienced by their predecessors, today’s market cap leaders will need to at least meet – and preferably exceed – current consensus growth expectations,” which, however, “seem more achievable based on recent results and management guidance. In aggregate, consensus expects a 100 bp sales growth deceleration (from 15% in 2020 to 14% in 2021), a 20 bp margin expansion (19.5% to 19.7%), and a 600 bp EPS growth acceleration (10% to 16%).”
The good news is that at least for now, these market titans have not disappointed, as Bloomberg pointed out in “Like It or Not, Trillion-Dollar Titans Lived Up to Earnings Hype.” Indeed, four of the five FAAMG stocks reported 4Q 2019 results this week, which generally came in stronger than expected:
- Apple reported a revenue and EPS beat, with quarterly revenues of $92 billion (+9% vs. the year-ago quarter) beating consensus by 4% as demand for iPhones and wearables better than expected. Subscriptions came in ahead of schedule, despite a deceleration in services revenue growth to 17% year/year.
- Microsoft posted positive results across every segment. Sales grew by 14% year/year and executives affirmed guidance for continued double-digit growth in 2020. Consensus estimates currently forecast 12% sales growth and 11% EPS growth in 2020 and 12% and 14%, respectively, in 2021.
- FB reported strong 4Q results across almost every financial metric. Overall revenues jumped by 25% to $21 billion. While ad revenue beat for the fifth consecutive quarter, slowing growth in mature markets led to some investor concern.
- AMZN’s Thursday report was the best of the FAAMG lot. The company reported 4Q revenues of $87 billion (+21%), above consensus forecasts, and AMZN exceeded the high-end of its revenue guidance for the first time since 1Q 2018.
Yet while the market leaders did not disappoint in the last quarter of 2019 when stocks exploded higher with the blessing of the Fed’s QE4, what about the current quarter and the future? What happens to revenues and demand, to established supply chains, to profit margins, if the Coronavirus epidemic keep spreading and tens of millions of Chinese remain under quarantine? What happens to Apple’s iPhone sales in China if the Cupertino company is unable to reopen its store for a month, or two, or three? What happens to the already depressed global auto industry if Chinese part-makers can’t transport their parts to their core customers? What happens to China’s financial system if the local banking sector is suddenly paralyzed as the great unknown of how the pandemic will impact the Chinese economy spreads?
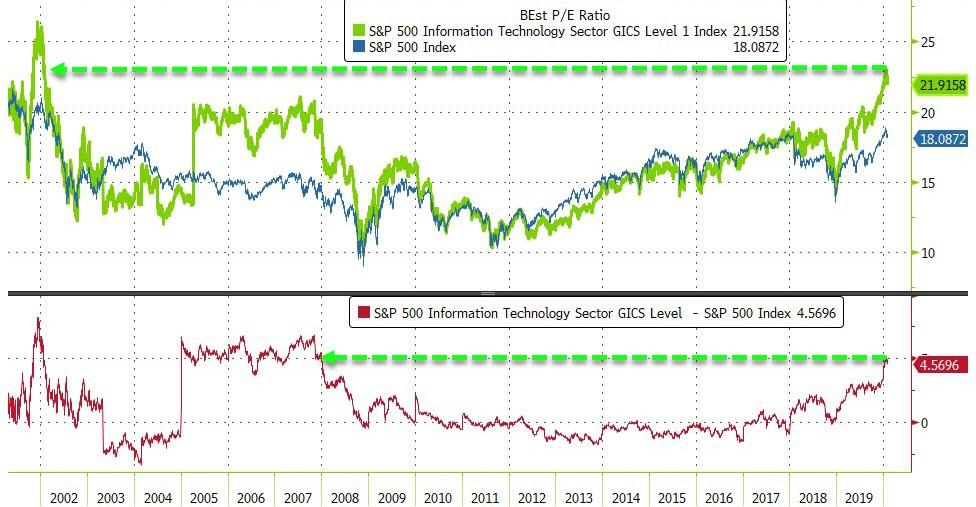
One thing is certain: with the tech sector priced to perfection, and with multiples of the IT sector at the highest level since the dot com bubble, and the tech setor the most overbought relative to the broader S&P500…
… anything less than perfection could lead to a violent selloff among the massively overbought handful of tech names that have led the market for much of the past year.
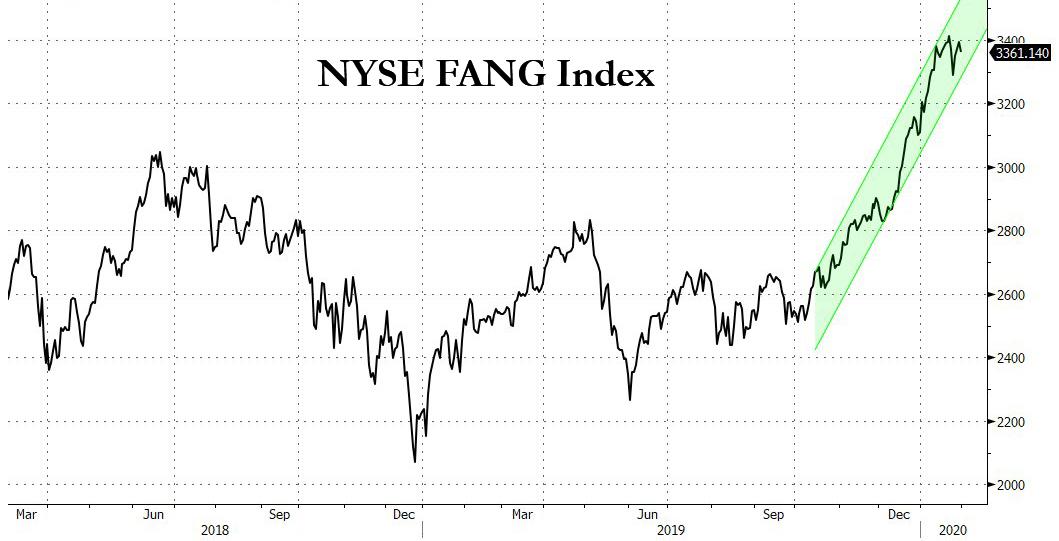
As such, it’s suddenly up to China to make sure the FAAMGs in particular, and the tech sector, and S&P500 in general, can sustain the lofty ascent that Donald Trump demands to ensure his reelection in November. That, however, may be a big ask as the NYT writes in “China Kept World in Dark as Outbreak Rippled” because, well, why would China have to keep the world in the dark if indeed the situation was contained, or containable? And one lack at the recent action in the NYSE FANG index…
… indicates that traders are increasingly starting to wonder if the mega tech party was finally ended, not by a black swan, but a black bat…
Tyler Durden
Sun, 02/02/2020 – 20:05
via ZeroHedge News https://ift.tt/36MwaFC Tyler Durden
