Global Demographic Fact Vs. Central Bank Sorcery
Authored by Chris Hamilton via Econimica blog,
Summary
-
The annual growth of the working-age population is the organic baseline for growth in national, regional, and global consumption.
-
However, since World War II, interest rate policy has moved inversely of annual working-age population growth, to incent ever more debt as working-age population growth has decelerated to nothing.
-
Interestingly, total annual change in energy consumption has mirrored annual working-age population growth.except where synthetic growth has been temporarily substituted to maintain the appearance of growth (aka, China).
-
Eventually, the inorganically rising consumption and asset prices will return to their organic baseline.and that will be a very rude new dawn for those who believed in infinite growth.
The 1st world economy lives within a fractional reserve banking system. In a fractional reserve system, one persons debt is the systems new money, as money is lent into existence. At a progressive rate since 1980, it has been the combination of decelerating working-age population growth, declining interest rates, and ramping utilization of privately loaned debt that has simultaneously been the basis for increasing consumption and the creation of new money. As borrowers undertook new loans prior to 2008, this borrowing was the primary means of monetary growth. However, the changing demography since 2008 has changed everything as population growth has shifted from young to old…and federal governments and central banks have taken over money creation via monetization resulting in asset inflation.
-
New debt is primarily undertaken in the 1st world nations where income and savings are higher but also credit is readily available and standards for this credit vary widely, by asset type (zero for student loans, low for vehicles, moderate to high for homes…since ’07).
-
It is primarily the working-age population that undertakes new debt while those in the post working age population tend to deleverage and pay down existing loans (this has the opposite monetary effect of destroying money).
-
From 1950 to 2008, it was the significantly larger developed world growth of the working-age population over that of the post working-age population that supported new debt, money creation, and rising asset prices…the current and future reversal of these proportions is the likely rationale for federal governments and central banks to engage in ZIRP, NIRP, QE, and other activist / experimental policies to offset the demographic driven collapse in the money supply.
-
The lending amid the declining working age population among the developed world and the decelerating growth among Asia cannot be made up by accelerating demographic growth in Africa. Global inequality and lack of broadly shared wealth means Africa hasn’t the income, savings, and/or access to credit to provide significant global demand.
So, it’s the growth of the working-age population in the developed world that is critical for the growth of money within a fractional reserve system. And that working-age growth need be significantly greater than the growth of the credit averse post working-age population. Growth among the working-age population in Asia (excluding East Asia + Singapore) and/or Africa has relatively little impact as the vast majority there have relatively little income, savings, and/or access to credit.
I divide the world into three mega-regions: developed world, Asia, Africa.
They consist of the following and as of 2020, with following proportions…
Developed World = Western Hemisphere, Oceania, West/East Europe Including Russia), East Asia (China, Japan, Taiwan, S/N Korea)
-
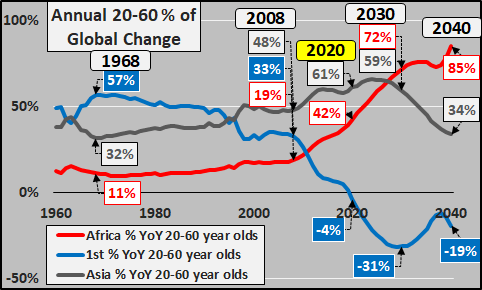
47% of global working age population but -4% of annual growth in global working age population
-
By 2030, developed world will represent -31% of annual growth in global working-age population
-
By 2040, developed world will represent -19% of annual growth in global working-age population
-
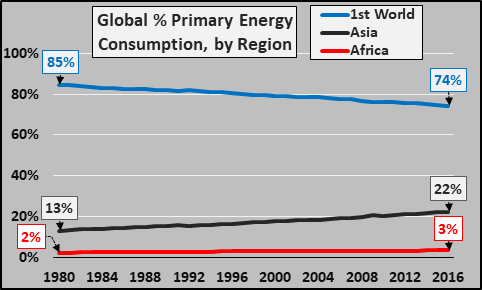
1st world is 74% of global energy consumption
-
Asia = (South Asia, Middle East, Central Asia)
-
39% of global working-age population but 61% of annual growth in global working-age population
-
By 2030, Asia will represent 59% of annual growth in global working-age population
-
By 2040, Asia will represent 34% of annual growth in global working-age population
-
Asia is 22.5% of global energy consumption
-
Africa
-
14% of global working-age population but 42% of annual growth in global working age population
-
By 2030, Africa will represent 72% of annual growth in global working-age population
-
By 2040, Africa will represent 85% of annual growth in global working-age population
-
Africa is 3.5% of global energy consumption
-
Global Working-Age Demography:
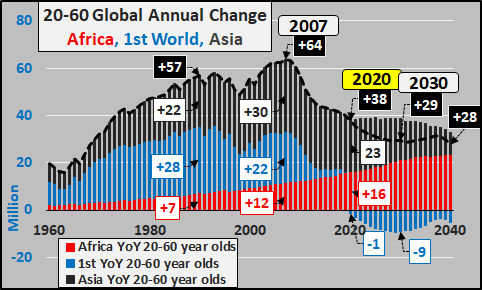
The chart below shows total annual growth (in millions) among the 20 to 60-year-old global population.
Global annual growth of working age adults peaked in 2007. Since then, annual working age population growth has been decelerating, and by 2030 will be less than half the peak annual growth. What growth remains has shifted to the poorest and turned to outright declines among the relatively wealthier nations.
-
Annual working-age growth in the 1st world has ceased as of 2020, and now outright progressively larger declines will be a secular feature indefinitely.
-
Annual growth among Asia is decelerating and will continue to decelerate indefinitely.
-
Annual growth in Africa is accelerating and will do so through mid-century.
The second chart breaks out the geographical location of the annual 20 to 60 year-old total population growth. This is so critical, because again, it is the far higher incomes, savings, and access to credit among the 1st world working-age population that drives consumption, debt, and resultant money creation (via fractional reserve banking).
Note that the majority of working age population growth was in the 1st world through 1995 and 1st world growth remained a strong feature until 2008. From 2008, the inevitable decline of the 1st world working age population (given the previous decades of declining births and fertility rates…see charts at article end), has meant a collapsing portion of working age growth in the 1st world. And as the chart below details, this 1st world decline is about to get far more severe. Note the portion of growth in Asia will soon peak and begin decelerating rapidly. This leaves a ramping portion of the working age population growth in Africa. This is so important as the population growth of the working-age in Africa is among those with the lowest global incomes (less than 1/10th those of the first world), minimal savings, and little to no access to credit. This African working age population growth is like multiplying a large number against a tiny fraction. There is little monetary capability for consumption or credit driven demand…there is also no money multiplier.
Impact of Working-Age Demography on Energy Consumption:
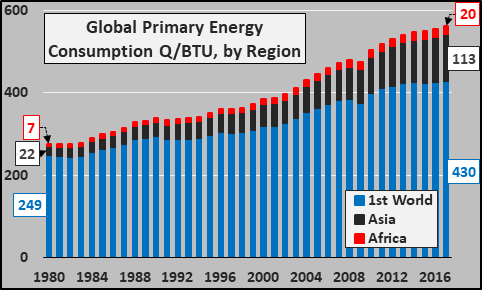
Next, I use total energy consumption as the best proxy for real economic capacity and demand. The chart below again splits the world energy consumption among the 1st world, Asia, and Africa (primary energy consumption equals all oil, natural gas, coal, nuclear, and renewable energy consumed in each region). What should be abundantly clear is the 1st world is consuming energy far beyond their share as a population, Asia rising but still far below that of the 1st. Also noteworthy is the sustained minimal energy consumption of Africa.
Next, looking at energy consumption as a percentage of total consumption by region. Note the percentage growth of consumption in Asia, inverse deceleration of the 1st world energy consumption, and the near non-existence of Africa as a global energy consumer. Africa has consistently consumed only 2% to 4% and shows no signs of imminent increase.
It is clear the 1st world plus Asia do nearly all the consuming (96.5% of the global consuming…true for energy, true for exports, etc.) and these trends show no imminent signs of change and actually it appears with the deceleration taking place in the 1st world, Africa is decelerating with them (details at end of article). The impacts of the current potential pandemic will only exaggerate the already baked-in decelerations/declines.
Elderly Global Demographics:
But what of the deleveraging elderly?
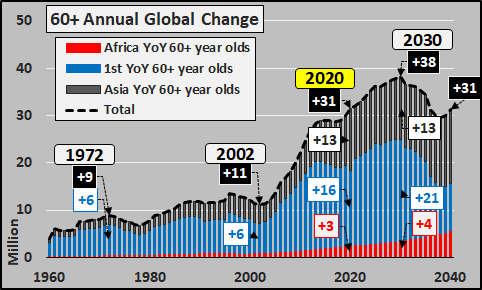
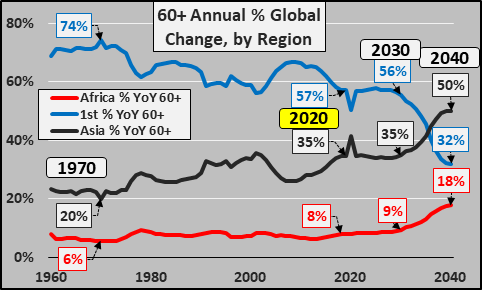
The next chart focuses on the break-down of the annual 60+ year-old global population growth. As of 2020, the share of elderly (60+ year-olds) around the world is highly skewed to the 1st-world with the following proportions:
-
1st-world; 65% of 60+ year-olds, 57% of annual growth in elderly
-
Asia; 28% of 60+ year-olds, 35% of annual growth
-
Africa; 7% of 60+ year-olds, 8% of annual growth
60+ year-old annual growth will peak in 2030 and begin decelerating thereafter with annual growth shifting away from first world to Asia and Africa.
Below, the breakdown by region of the still surging growth in 60+ year-olds. At present, the growth is trending toward Asia and away from the 1st world…however, sometime after 2030, the portion of growth in Africa is projected to begin rising and 1st world growth decelerate significantly.
So, by 2030…
-
Global working age population growth will slow by 45%
-
Global working age population growth will shift almost entirely to Africa, decelerate in Asia, and continue declining in the 1st world
-
Global growth in elderly will continue surging, particularly in the 1st world and Asia The impacts on credit/debt utilization and consumption among the declining 1st world working age population should be severely negative with little to no chance for the growth in Africa to overcome the collapsing 1st world demand. With this situation, a negative feedback loop is established for real assets such as homes, commercial real estate, consumer goods (cars, phones, appliances, etc.) and the factories and supply chains that support these. A global decline in real consumption is highly likely as these demographic trends play out and secular economic depression will be the primary feature for decades.
This is the siren song to the central banks to artificially create inflation through monetization rather than rising demand. The current rising asset prices via monetization and interest rate policy misuse is only worsening the eventual workout and rebalancing of the system.
Tyler Durden
Sat, 02/29/2020 – 11:15
via ZeroHedge News https://ift.tt/2VA4XDZ Tyler Durden
