“US Labor Market Is In Free-Fall” – 10 Million Americans Have Filed For Unemployment In Past 2 Weeks
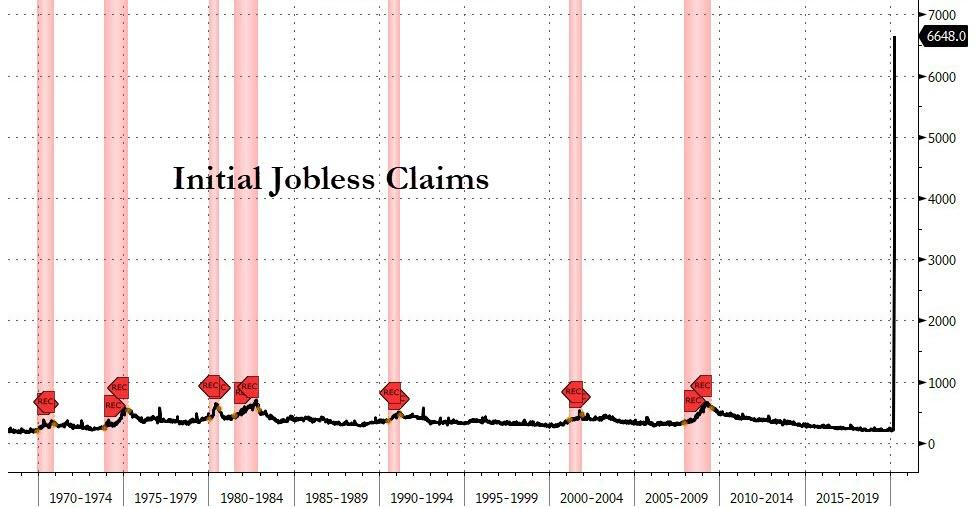
After last week’s unprecedented 3.3 million surge in initial jobless claims, this week’s is even more unprecedented-er, adding a stunning 6.648 million (just 100k away from our estimate of 6.5million) for a two-week sum of 10 million new Americans claiming unemployment benefits…
Source: Bloomberg
As @GreekFire noted, “We’ve lost 46 jobs for every confirmed case of COVID-19 in the US…“
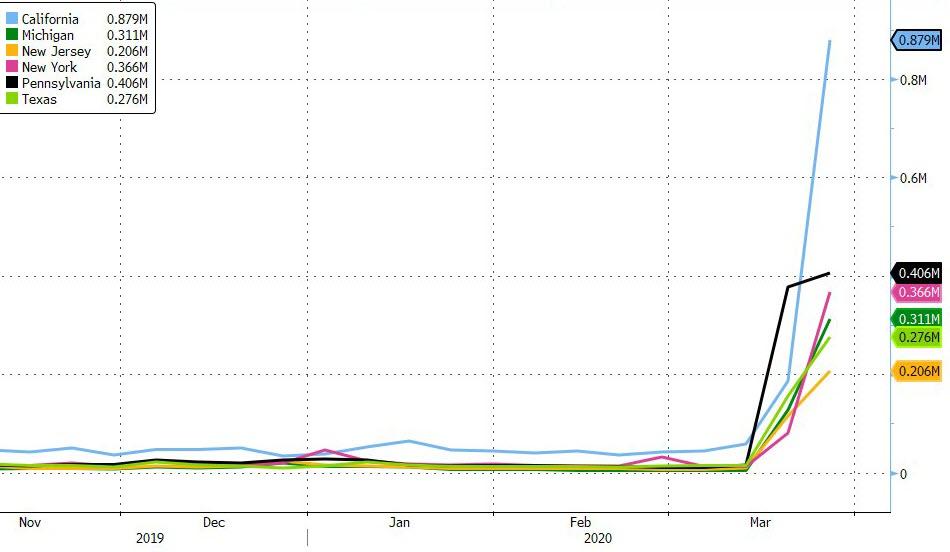
The 6.648mm print is worse than the worst of 50 estimating analysts’ expectations. Breaking down by state (which is one week lagged and so represents the prior week’s 3.3mm print detail), California, Pennsylvania, and New York dominate…
Source: Bloomberg
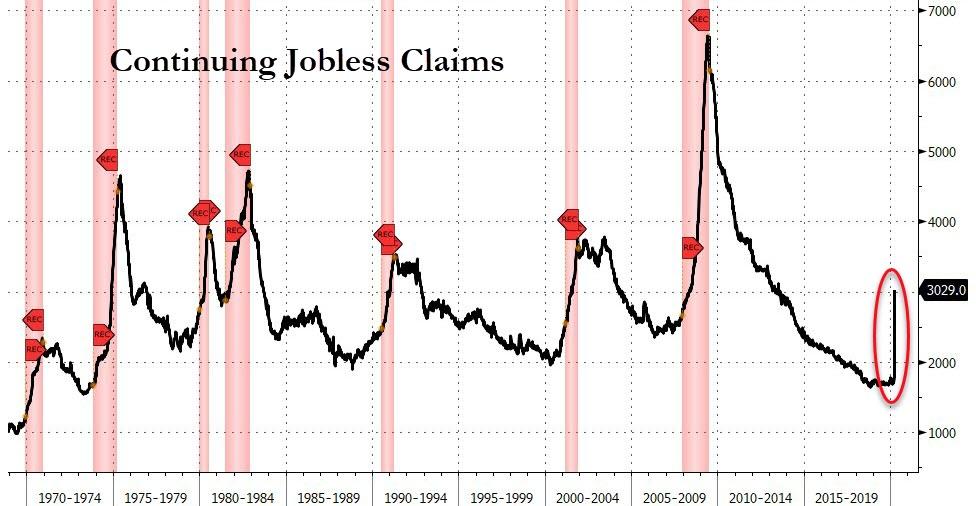
And of course, last week’s “initial” claims and this week’s “continuing” claims…
Source: Bloomberg
This is simply stunning.
“The U.S. labor market is in free-fall,” said Gregory Daco, chief U.S. economist at Oxford Economics in New York.
“The prospect of more stringent lockdown measures and the fact that many states have not yet been able to process the full amount of jobless claim applications suggest the worst is still to come.”
And another important note is that weekly jobless claims data are based on “hard facts”, UBS points out, unlike survey data
which is subject to quirks around:
a) some of the treatment of supply chains, which has flattered data,
b) the fact that many respondents will not be replying to surveys during the virus disruption period, and
c) survey data will give more accurate assessments during ‘normal’ times, perhaps not as much in unusual times.
Of course, the government is coming to the rescue. As a result of the freshly-passed ‘relief’ bill, self-employed and gig-workers who previously were unable to claim unemployment benefits are now eligible. In addition, the unemployed will get up to $600 per week for up to four months, which is equivalent to $15 per hour for a 40-hour workweek. By comparison, the government-mandated minimum wage is about $7.25 per hour and the average jobless benefits payment was roughly $385 per person per month at the start of this year.
“Why work when one is better off not working financially and health wise?” said a Sung Won Sohn, a business economics professor at Loyola Marymount University in Los Angeles.
With more than 80% of Americans under some form of lockdown, up from less than 50% a couple of weeks ago, this is far from over.
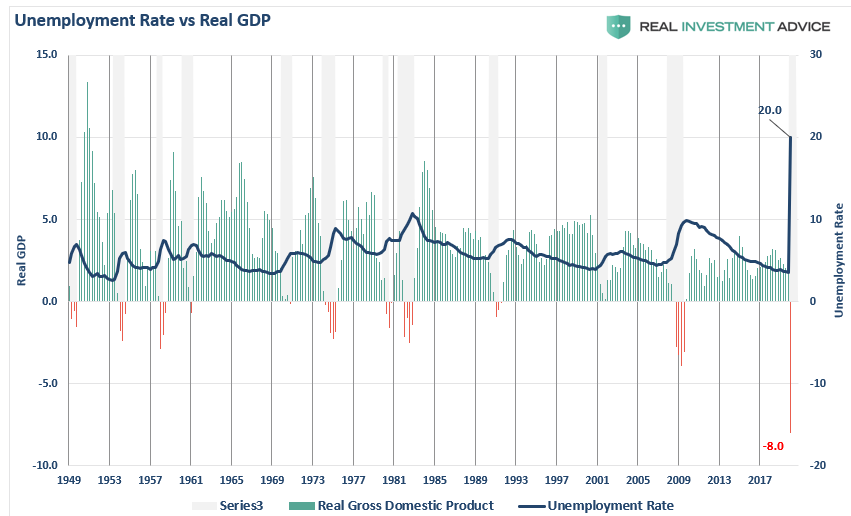
As RealInvestmentAdvice.com’s Lance Roberts warns, the importance is that unemployment rates in the U.S. are about to spike to levels not seen since the “Great Depression.” Based on the number of claims being filed, we can estimate that unemployment will jump to 15-20% over the next quarter as economic growth slides 8%, or more. (I am probably overly optimistic.)
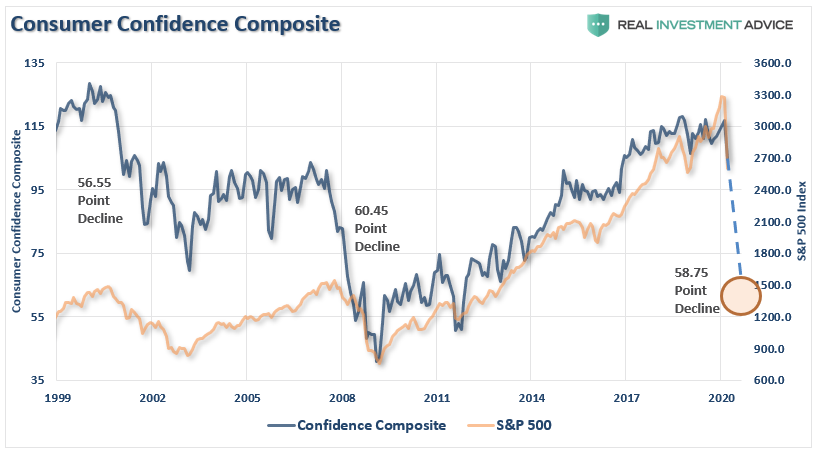
The erosion in employment will lead to a sharp deceleration in economic and consumer confidence, as was seen Tuesday in the release of the Conference Board’s consumer confidence index, which plunged from 132.6 to 120 in March.
This is a critical point. Consumer confidence is the primary factor of consumptive behaviors, which is why the Federal Reserve acted so quickly to inject liquidity into the financial markets. While the Fed’s actions may prop up financial markets in the short-term, it does little to affect the most significant factor weighing on consumers – their jobs.
The chart below is our “composite” confidence index, which combines several confidence surveys into one measure. Notice that during each of the previous two bear market cycles, confidence dropped by an average of 58 points.
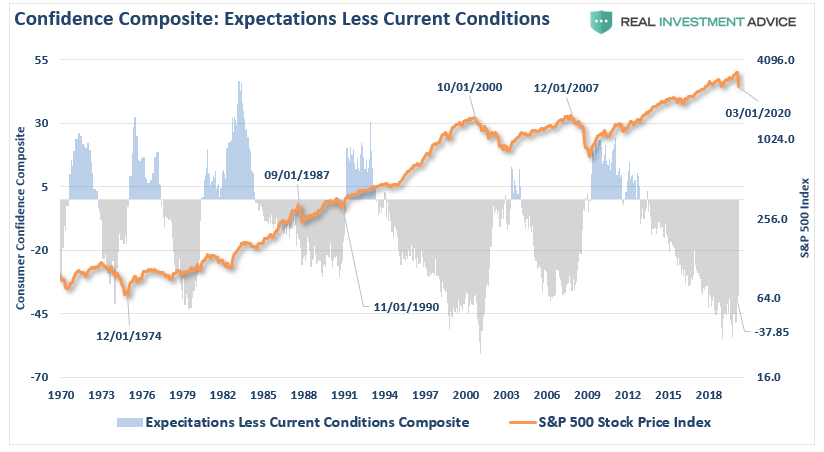
With consumer confidence just starting its reversion from high levels, it suggests that as job losses rise, confidence will slide further, putting further pressure on asset prices. Another way to analyze confidence data is to look at the composite consumer expectations index minus the current situation index in the reports.
Similarly, given we have only started the reversion process, bear markets end when deviations reverse. The differential between expectations and the current situation, as you can see below, is worse than the last cycle, and only slightly higher than before the “dot.com” crash.
If you are betting on a fast economic recovery, I wouldn’t.
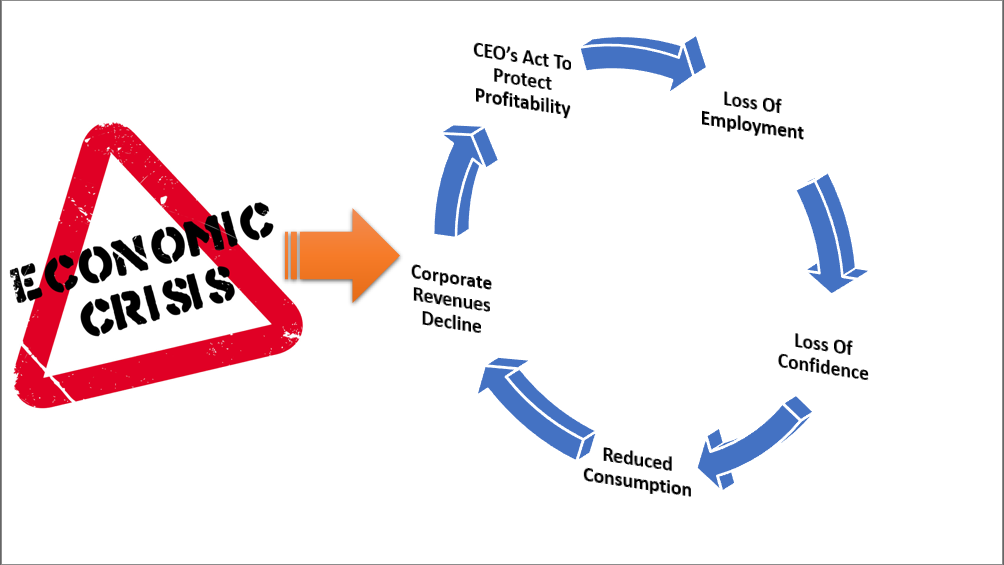
There is a fairly predictable cycle, starting with CEO’s moving to protect profitability, which gets worked through until exhaustion is reached.
As unemployment rises, we are going to begin to see the faults in the previous employment numbers that I have repeatedly warned about over the last 18-months. To wit:
“There is little argument the streak of employment growth is quite phenomenal and comes amid hopes the economy is beginning to shift into high gear. But while most economists focus at employment data from one month to the next for clues as to the strength of the economy, it is the ‘trend’ of the data, which is far more important to understand.”
That “trend” of employment data has been turning negative since President Trump was elected, which warned the economy was actually substantially weaker than headlines suggested. More than once, we warned that an “unexpected exogenous event” would exposure the soft-underbelly of the economy.
The virus was just such an event.
While many economists and media personalities are expecting a “V”-shaped recovery as soon as the virus passes, the employment data suggests an entirely different outcome.
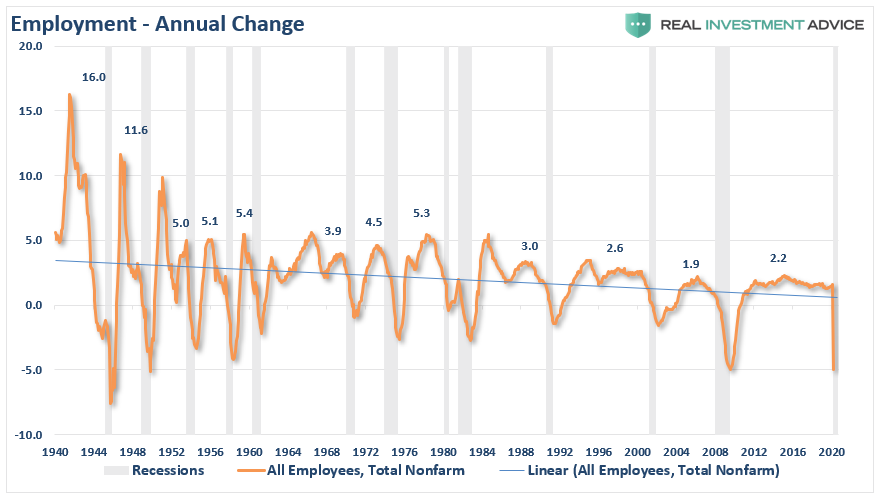
The chart below shows the peak annual rate of change for employment prior to the onset of a recession. The current cycle peaked at 2.2% in 2015, and has been on a steady decline ever since. At 1.3%, which predated the virus, it was the lowest level ever preceding a recessionary event. All that was needed was an “event” to start the dominoes falling. When we see the first round of unemployment data, we are likely to test the lows seen during the financial crisis confirming a recession has started.
No Recession In 2020?
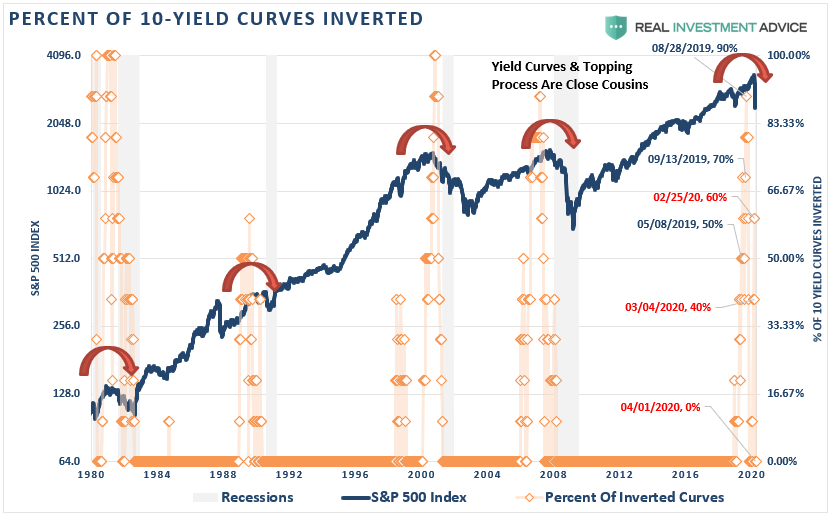
It is worth noting that NO mainstream economists, or mainstream media, were predicting a recession in 2020. However, as we noted in 2019, the inversion of the “yield curve,” predicted exactly that outcome.
“To CNBC’s point, based on this lagging, and currently unrevised, economic data, there is ‘NO recession in sight,’ so you should be long equities, right?
Which indicator should you follow? The yield curve is an easy answer.
While everybody is ‘freaking out’ over the ‘inversion,’it is when the yield-curve ‘un-inverts’ that is the most important.
The chart below shows that when the Fed is aggressively cutting rates, the yield curve un-inverts as the short-end of the curve falls faster than the long-end. (This is because money is leaving ‘risk’ to seek the absolute ‘safety’ of money markets, i.e. ‘market crash.’)”
I have dated a few of the key points of the “inversion of the curve.” As of today, the yield-curve is now fully un-inverted, denoting a recession has started.
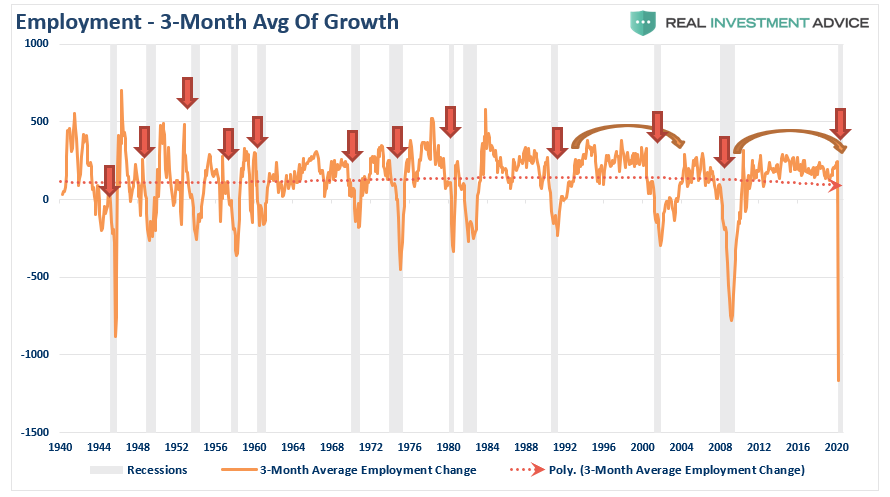
While recent employment reports were slightly above expectations, the annual rate of growth has been slowing. The 3-month average of the seasonally-adjusted employment report, also confirms that employment was already in a precarious position and too weak to absorb a significant shock. (The 3-month average smooths out some of the volatility.)
What we will see in the next several employment reports are vastly negative numbers as the economy unwinds.
Lastly, while the BLS continually adjusts and fiddles with the data to mathematically adjust for seasonal variations, the purpose of the entire process is to smooth volatile monthly data into a more normalized trend. The problem, of course, with manipulating data through mathematical adjustments, revisions, and tweaks, is the risk of contamination of bias.
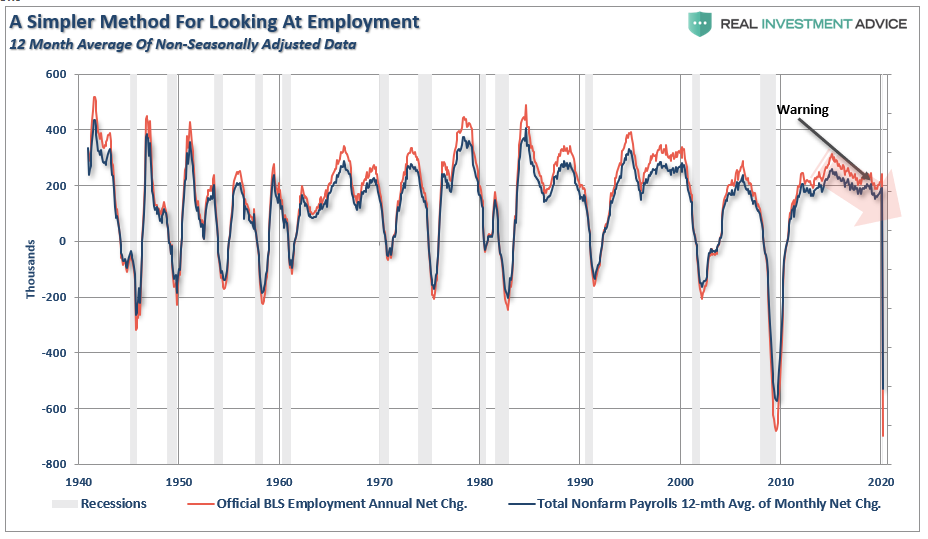
We previously proposed a much simpler method to use for smoothing volatile monthly data using a 12-month moving average of the raw data as shown below.
Notice that near peaks of employment cycles the BLS employment data deviates from the 12-month average, or rather “overstates” the reality. However, as we will now see to be the case, the BLS data will rapidly reconnect with 12-month average as reality emerges.
Sometimes, “simpler” gives us a better understanding of the data.
Importantly, there is one aspect to all the charts above which remains constant. No matter how you choose to look at the data, peaks in employment growth occur prior to economic contractions, rather than an acceleration of growth.
“Okay Boomer”
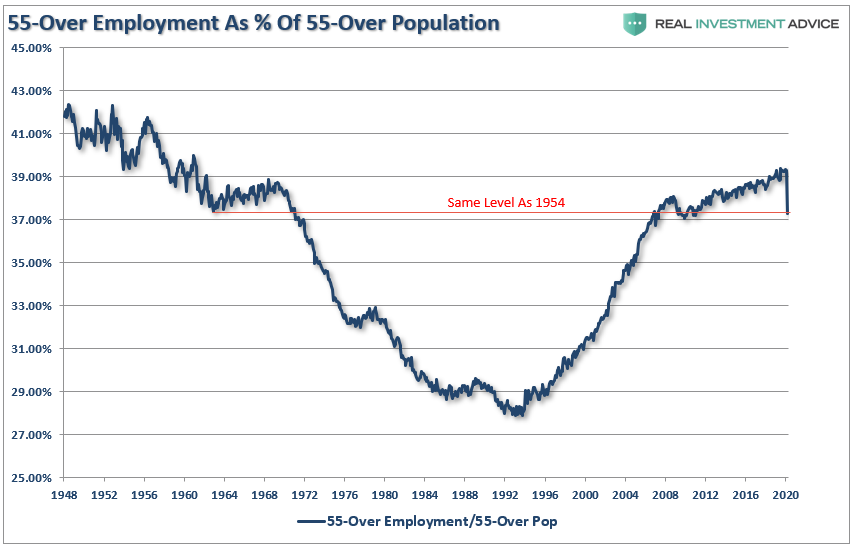
Just as “baby boomers” were finally getting back to the position of being able to retire following the 2008 crash, the “bear market” has once again put those dreams on hold. Of course, there were already more individuals over the age of 55, as a percentage of that age group, in the workforce than at anytime in the last 50-years. However, we are likely going to see a very sharp drop in those numbers as “forced retirement” will surge.
The group that will to be hit the hardest are those between 25-54 years of age. With more than 15-million restaurant workers being terminated, along with retail, clerical, leisure, and hospitality workers, the damage to this demographic will be the heaviest.
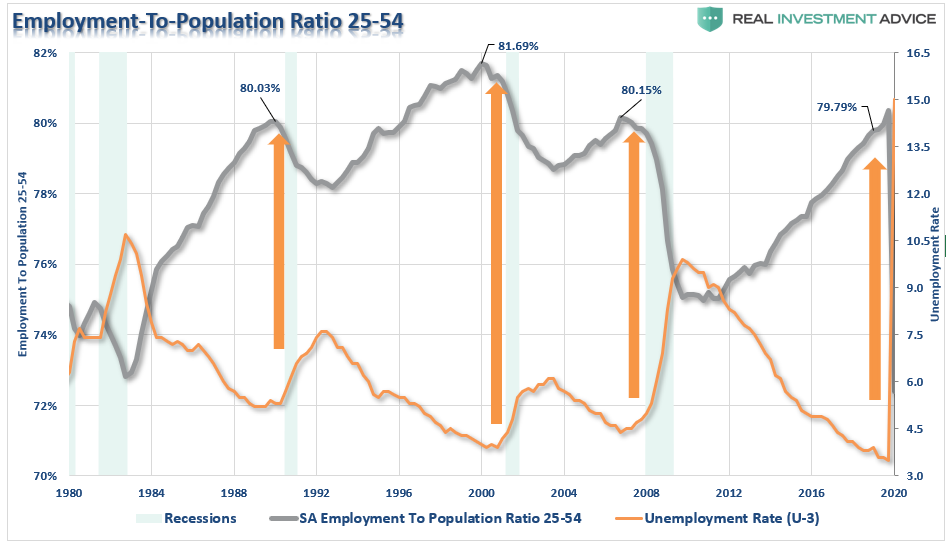
There is a decent correlation between surges in the unemployment rate and the decline in the labor-force participation rate of the 25-54 age group. Given the expectation of a 15%, or greater, unemployment rate, the damage to this particular age group is going to be significant.
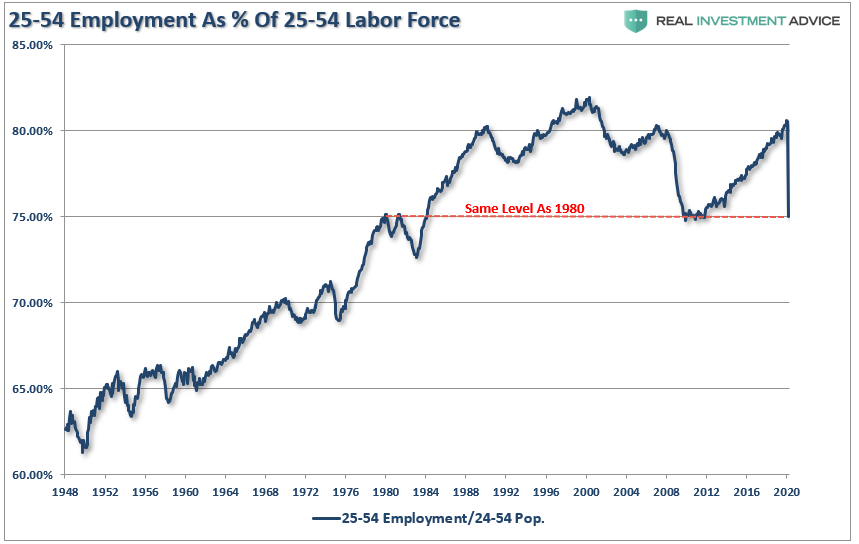
Unfortunately, the prime working-age group of labor force participants had only just returned to pre-2008 levels, and the same levels seen previously in 1988. Unfortunately, it may be another decade before we see those employment levels again.
Why This Matters
The employment impact is going to felt for far longer, and will be far deeper, than the majority of the mainstream media and economists expect. This is because they are still viewing this as a “singular” problem of a transitory virus.
It isn’t.
The virus was simply the catalyst which started the unwind of a decade-long period of debt accumulation and speculative excesses. Businesses, both small and large, will now go through a period of “culling the herd,” to lower operating costs and maintain profitability.
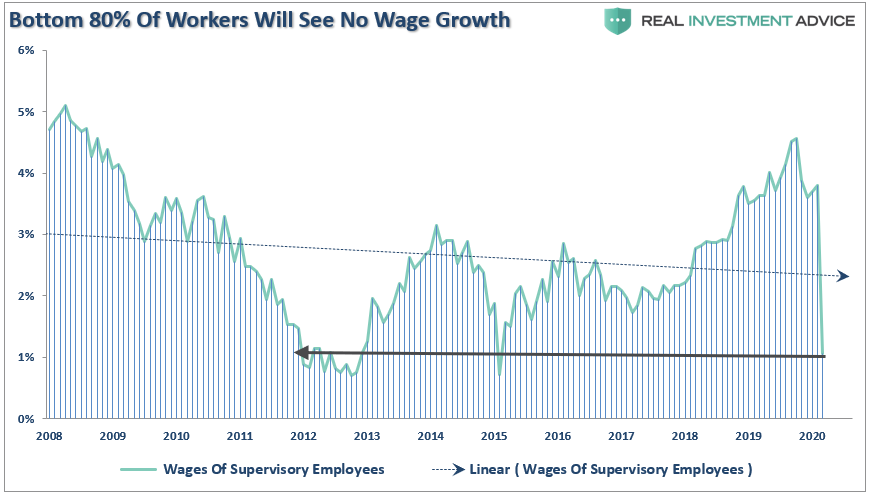
There are many businesses that will close, and never reopen. Most others will cut employment down to the bone and will be very slow to rehire as the economy begins to recover. Most importantly, wage growth was already on the decline, and will be cut deeply in the months to come.
Lower wage growth, unemployment, and a collapse in consumer confidence is going to increase the depth and duration of the recession over the months to come. The contraction in consumption will further reduce revenues and earnings for businesses which will require a deeper revaluation of asset prices.
I just want to leave you with a statement I made previously:
“Every financial crisis, market upheaval, major correction, recession, etc. all came from one thing – an exogenous event that was not forecast or expected.
This is why bear markets are always vicious, brutal, devastating, and fast. It is the exogenous event, usually credit-related, which sucks the liquidity out of the market, causing prices to plunge. As prices fall, investors begin to panic-sell driving prices lower which forces more selling in the market until, ultimately, sellers are exhausted.
It is the same every time.”
Over the last several years, investors have insisted the markets were NOT in a bubble. We reminded them that everyone thought the same in 1999 and 2007.
Throughout history, financial bubbles have only been recognized in hindsight when their existence becomes “apparently obvious” to everyone. Of course, by that point is was far too late to be of any use to investors and the subsequent destruction of invested capital.
It turned out, “this time indeed was not different.” Only the catalyst, magnitude, and duration was.
Pay attention to employment and wages. The data suggests the current “bear market” cycle has only just begun.
* * *
Finally, as Southbay Research warns, by the time this mess settles, at least 20M American workers will have been furloughed. The math is relentless.
Self-isolation is crushing the Leisure & Hospitality sector (17M workers). Most of them are set to be out of work. Indeed, confirming the sector’s pain, SouthBay’s review of local job postings found a massive collapse: Leisure & Hospitality postings fell 80% compared to the same period last year. That figure will only worsen as more States and cities impose a lock down.
And that’s just one sector. Every sector is taking a hit, some more than others, but the average drop in labor demand is >50% (as reflected in job postings).
Things will get a bit uglier before they level off.
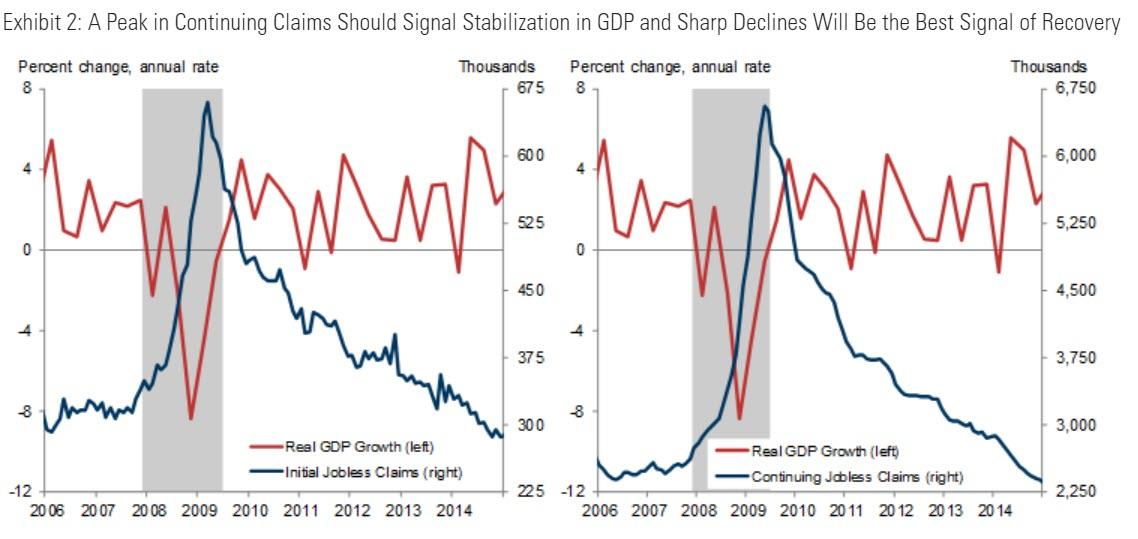
But Goldman has something positive to look for – even as this all begins to worsen dramatically – during the recovery from the last recession, GDP stabilized when initial claims first started to come down and continuing claims hit their peak. GDP started growing again when initial claims had fallen 1/3 of the way back to the pre-crisis level and continuing claims were falling quickly, as shown in Exhibit 2.
In the months ahead, we think that a levelling off of continuing claims will be a good signal that GDP has stabilized. Continuing claims will also likely be the clearer indicator that GDP has started growing again. Initial claims might normalize somewhat gradually as second-round effects of the virus shock generate ongoing layoffs. Continuing claims will better pick up an increase in hiring, which should accelerate more quickly than in a typical recession as some economic activities shut down by virus fears rebound more immediately (though this depends on the unemployment insurance benefits available at that point and on whether the economy recovers via slow adaptation or a more abrupt medical breakthrough).
Tyler Durden
Thu, 04/02/2020 – 08:31
via ZeroHedge News https://ift.tt/3aDhdbK Tyler Durden
