A Country In Lockdown: States Accounting For 86% Of GDP Are Frozen, And What The Reopening Could Look Like
Although the federal government has played the leading role in providing stimulus and relief in response to the coronacrisis, state governments have shaped the economic sudden stop through hundreds of emergency orders that imposed restrictions on commerce and social activity. The fifty states have adopted different approaches at different times to handling the threat to public health since the outbreak of the virus.
Over the past month, states shut down economic and social activity largely in three steps:
- closing schools,
- issuing stay-at-home orders,
- closing non-essential businesses.
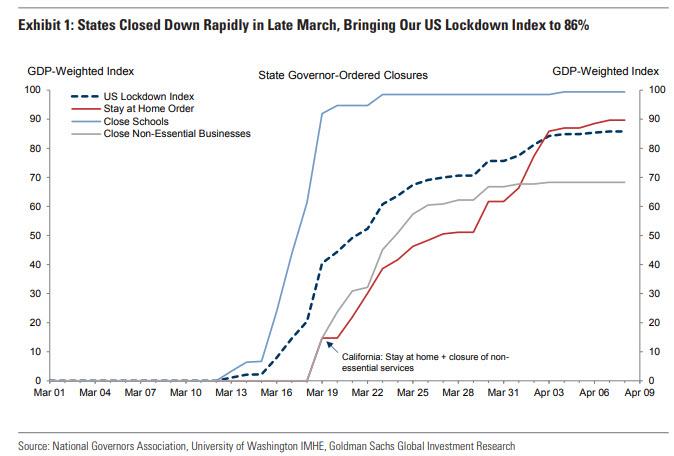
To understand when and how extensively these shutdowns occurred across the United States, Goldman compiled a database of dates when each state governor issued these three types of orders. The bank then aggregated the state orders into a daily national average weighted by state GDP to track the share of the US economy subject to each order over time. Goldman also then focuses on school closures, stay-at-home orders, and nonessential business closures because they are legally binding and fairly consistent across states.
- Governors swiftly closed schools in states accounting for over 90% of US GDP by March 20, just one week after the first statewide closure in Washington state on March 13. These orders prevented many people who had to care for children from going to work, which in some states allowed affected individuals to access unemployment insurance benefits.
- Statewide stay-at-home (or shelter-in-place) orders began with California on March 19, followed by New York and Illinois on March 20. These orders restrict movement and require some degree of social distancing. The orders range in their restrictiveness and in how they can be legally enforced. States comprising half of GDP had issued stay-at-home orders within a week of California’s order and today 90% of the US economy is subject to a statewide order.
- Orders to close nonessential businesses often occurred alongside stay-at-home orders. Each state maintains its own list of essential vs. nonessential services, though many states have followed the same federal guidelines for these definitions. Within two weeks of the first state order to close nonessential commercial activity, 70% of GDP was subject to a nonessential business restriction.
The chart below shows Goldman’s three national series that track these orders as well as an overall US Lockdown Index that averages the three. As of April 9, the US Lockdown Index stood at 86%.
Over this period the federal government also took actions that likely influenced state decisions. For example, on March 16, the White House encouraged social distancing by limiting gatherings of more than 10 people and discouraging face-to-face commercial activity.
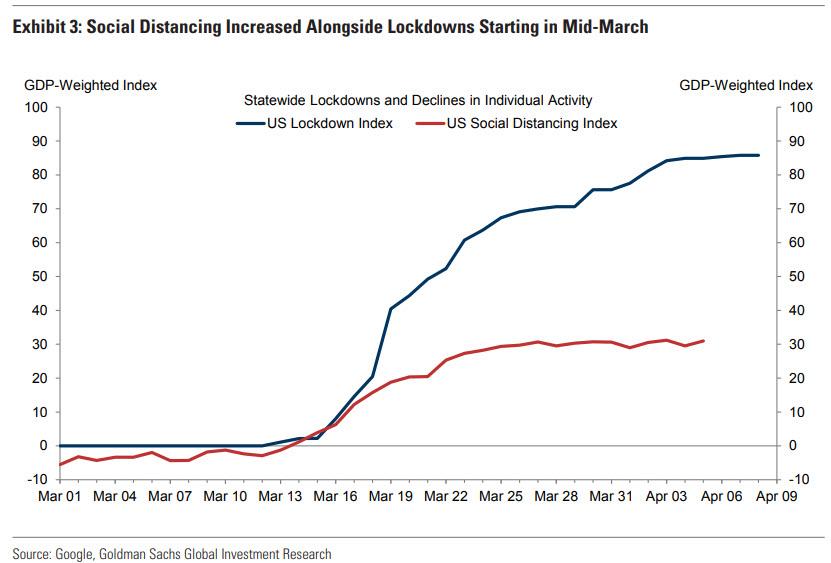
Goldman then complements its newly created lockdown index with a US social distancing index based on data from Google’s Community Mobility Reports that track individuals’ visits to and time spent at work, at stores, in transit, and at home. The measures show that people began curbing most out-of-home activity slightly before states ordered lockdowns, and that both lockdowns and social distancing continued to gradually increase over the second half of March.
Following up on its lockdown index, the bank next creates an overall US social distancing index comparable to our US lockdown index by taking an average of the residential activity measure and the inverted values of the four measures of out-of-the-home economic activity. The red line in Exhibit 2 shows the social distancing index.
The next chart compares Goldman’s US lockdown index with our social distancing index. People began curbing their out-of-home activity slightly before states began ordering lockdowns. This is particularly true of workplace and transit activity, though the initial stocking-up at grocery stores causes the overall social distancing index to fall slightly later. Over the second half of March, social distancing continued to rise as state orders went into effect.
Looking at the data, Goldman then draws three conclusions.
- First, all three types of state orders reduced economic activity and increased time spent at home.
- Second, while state-level shutdown orders played a meaningful role in the decline in activity, they account for only a minority of it.
- Third, there was greater social distancing in states with faster daily growth of new virus cases.
In summary, each state was locked down and began practicing social distancing within a fairly short period of time. In contrast, state governments will likely remove these lockdown measures in a much more disparate manner than they applied them, reflecting differences in local virus conditions and differences in balancing public health risks against the costs of keeping the economy shut down.
Goldman’s analysis leads to two key implications for the eventual reopening of the economy.
- First, lifting state lockdown orders—likely in a more disparate manner across states than they were applied—should provide a boost to economic activity, but will not be sufficient on its own to bring most economic activity back unless the virus is also under control.
- Second, reducing the local rate of spread of the virus should increase economic activity, even with lockdown orders still in place.
Tyler Durden
Mon, 04/13/2020 – 14:07
via ZeroHedge News https://ift.tt/2VoSEsL Tyler Durden


