How The Federal Reserve Unilaterally, De-Facto Amended The US Constitution
Tyler Durden
Sat, 05/30/2020 – 13:55
Authored by Chris Hamilton via Econimica blog,
The US Constitution is the spectacular framework upon which our nation is built. The framers even built in a means to right the terrible wrongs that were beyond their capabilities at the time…the amendment has been utilized 27 times in all (most recently in 1992), righting freedoms of religion, equality of all races and sex, among others. But not included anywhere in the Constitution was the Federal Reserve, allowing it the power to guide interest rates ever lower or infinitely purchase assets. The implications of the Federal Reserve policies have been to undermine the Congress’ primary function, that of compromise in an attempt to balance spending versus taxation. The Federal Reserve policies have removed market based discipline, (market based interest payments), encouraging Congress to raise seemingly infinite federal debt. Thus Congress’ role as an institution for compromise is broken. This de-facto Constitutional amendment has spurred ideas of infinite spending like MMT. Flawed as the framers were, this insertion of a de facto, unelected, quasi private/federal branch of government was explicitly never intended because of the cancer it represented.
The Impacts of Declining Interest Rates on Debt
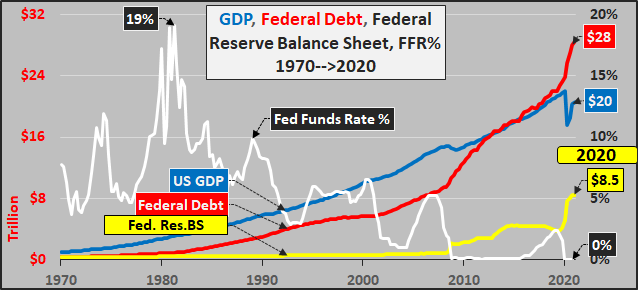
For four decades, the Fed has reduced the cost of undertaking deficit spending (via its direct intervention in the supply of Treasury debt), taking short term rates to zero. Not surprisingly, Congress has seen the nearly “free money” and spent with reckless abandon without runaway interest payments. What I will detail is that with each Federal Reserve dictated and implemented interest rate cut, the Congress took the “free-er money” and spent ever more…regardless the lack of economic return (as measured by GDP). Debt (particularly unproductive debt) has progressively grown disproportionately faster than the economy (the tax base from which to repay and/or service the debt).
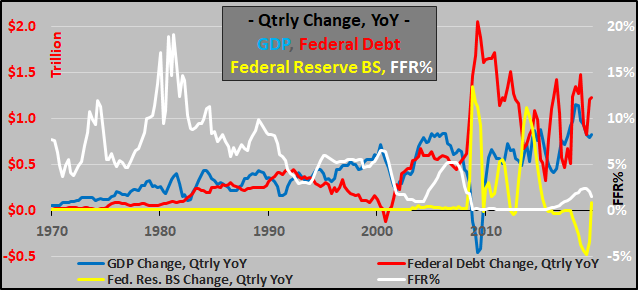
Speaking of the disproportionate debt…below, the quarterly change (on a year over year basis) of GDP, federal debt, and the Federal Reserve balance sheet from 1970 through 2019. The “market” discipline of higher interest costs (dependent on free market purchases of US Treasury debt) constrained the growth of debt until 2000. But the near zero rates in the wake of ’00 and then the zero rates since ’08 have encouraged spending far beyond the proportionate economy or tax base to repay that debt.
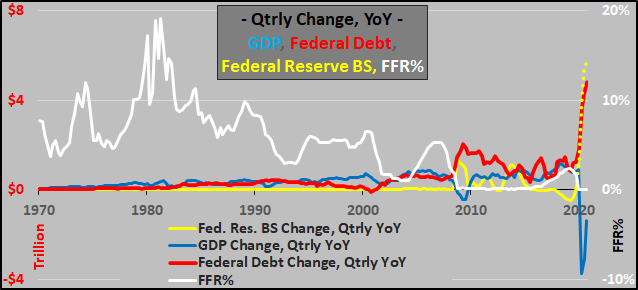
But when the same chart is extended to show 2020, the current blow-out of federal debt and the Federal Reserve asset purchases versus unprecedented collapse in GDP dwarfs everything that came before.
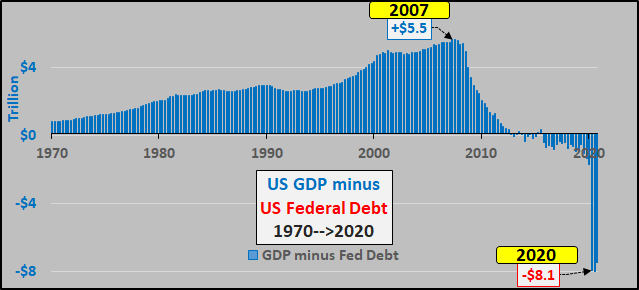
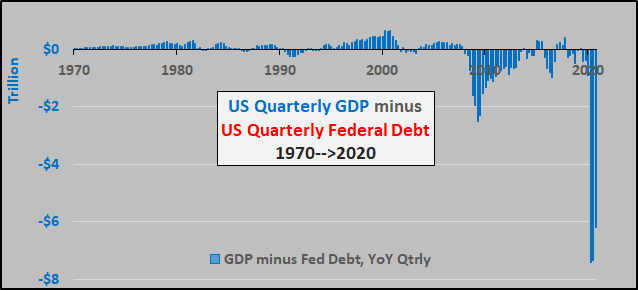
To measure the “proportionate” growth of the economy versus the growth of the debt to spur the economy, rather than using debt to GDP, below I show GDP minus the federal debt. Using this gauge portrays an ugly reality since 2007…the US economy is falling fast and only ever greater debt and ever greater interest rate manipulation is able to mask the truth (and avoid the hard, painful, but necessary decisions to right the ship).
Some will suggest the chart above is unfair as I’m showing an annual (GDP) versus a cumulative (federal debt). So, the chart below shows the quarterly change in GDP, on a year over year basis, versus the same change in federal debt. This is essentially the “growth” that was achieved after backing out the debt incurred as part of that growth. I wonder if Trump will sign this chart as he did a recent stock market surge? There is nothing “MAGA” about this.
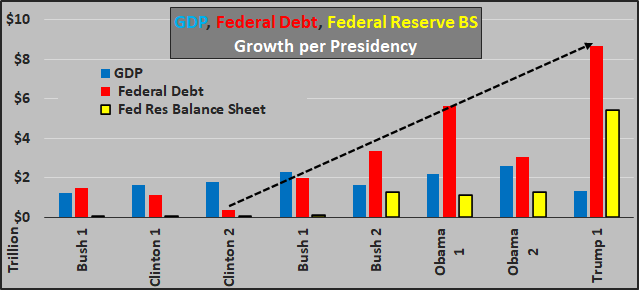
And not to make this political, (as neither party represents much of anybody in America…except well funded special interests), but the trend of lower interest rates has allowed for significantly higher incursions of debt, with rising growth in the Federal Reserve balance sheet, sadly culminating in continually decelerating GDP growth.
A Look Into The Fed’s Balance Sheet…And Gauging Impacts
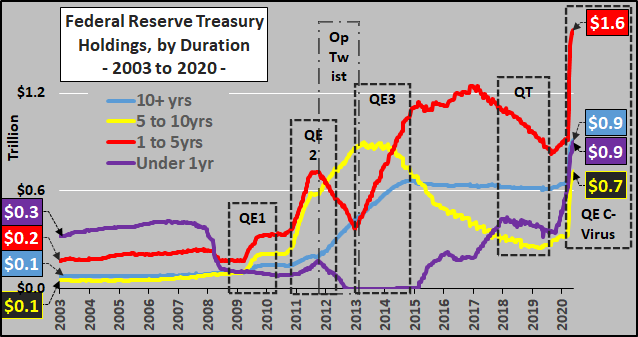
Prior to 2008, the Federal Reserve holdings of Treasury debt was uneventful and predictable. The Fed primarily held T-bills (up to 1 year in duration) and Notes (2 to 10 years in duration), with a small and stable assortment of long bonds (10+ years in duration). But in early 2008, the Fed initiated what has been a wild and seemingly chaotic ride, buying certain durations while dumping others in an attempt to directly establish rates across the curve (no “free-market” appreciated here). And this doesn’t include the MBS and assorted “other” assets.
Prior to QE1, the Fed sold off two thirds of it’s holdings of Bills and shorter duration Notes and trimmed the balance sheet. From there, the Fed undertook a total selloff of bills and used the proceeds to load up on Notes and Bonds. But prior to the completion of QE3, the Fed began a massive sell-off of longer duration Bonds through the end of QT…but prior to Corona-virus, the Fed pivoted to begin purchasing nearly all durations…and then with C-virus the Fed accelerated what was already underway…a wholesale monetization of all new debt being created by the Treasury.
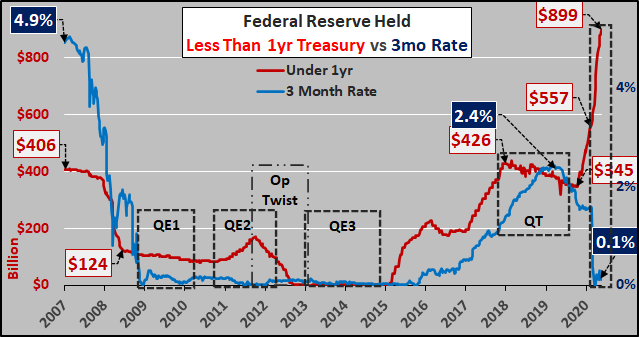
First, Fed holdings of Bills versus the 3 month Treasury rate. About 24% of Treasury debt outstanding are bills and the Fed now owns about 22% of the outstanding bills. Prior to the ’08 GFC, the Fed sold highly liquid short duration and bought longer duration…but not this time. This time the Fed is loading up on Bills all while many complain of a lack of liquidity.
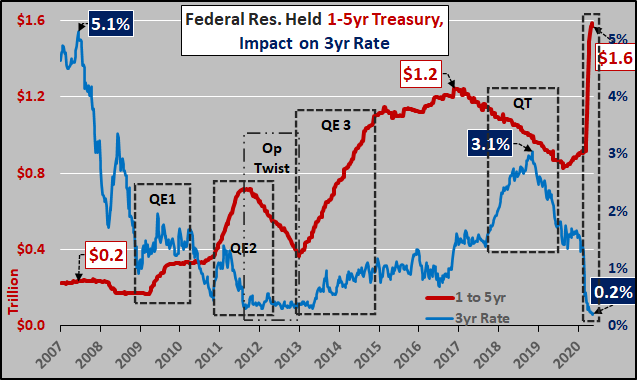
Why would the Fed need to purchase $900 billion in bills during a liquidity crisis? Is the Fed attempting to create a liquidity crisis…or is there just too much supply and too few buyers at an elevated market set rate the Fed is unwilling to accept? Unfortunately, I don’t know but near the sudden and abrupt end to QT, the three month rate reached 2.4%…and since then but beginning well before Corona-virus, the Fed went to work.
Fed held Notes of one to five years versus the three year Treasury rate. Again, during QT, rates spiked until the reversal of QT to QE, well before Corona-virus. Notes (1 to 10 years in duration) make up 60% of outstanding Treasury debt and the Fed now owns 23% of total outstanding Notes.
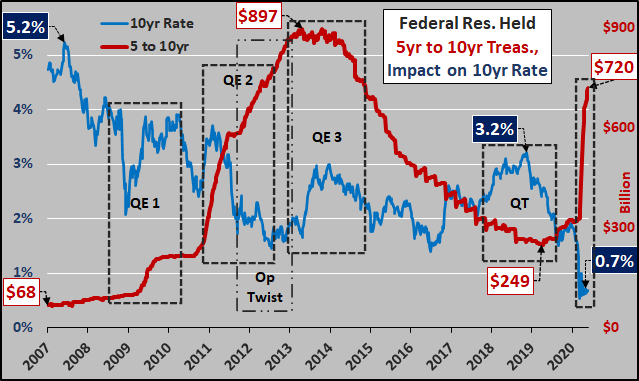
Fed held 5 to 10 year Treasuries. The 10 year rate is so critical as it is the foundational basis for the 30 year fixed rate mortgage, upon which all bank costs / fees are added.
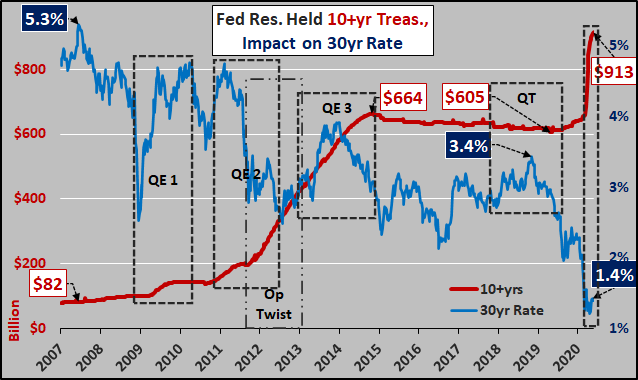
Fed held Bonds. Bonds make up about 15% of outstanding Treasury debt but the Fed owns 37% of outstanding Bonds, a significantly larger portion than it does other durations.
So What?
The point of these charts is to illuminate the length the Federal Reserve is willing to go. As Chairman Powell recently stated on 60 Minutes, “there is no limit” to what the Fed can do…and “there’s a lot more we can do to support the economy, and we’re committed to doing everything we can as long as we need to”. But remember, this is an in an effort to avoid a “free-market” pricing of US Treasury debt, that would almost surely cause large portions of federal taxation to be utilized just to pay the interest on the debt…leaving Congress with nothing but difficult compromises between taxation (likely significantly higher) and spending (likely significantly lower). That would be bring a whole lot of third rail issues into immediate focus, not exactly the platform that gets many sitting Congressman or Presidents re-elected.
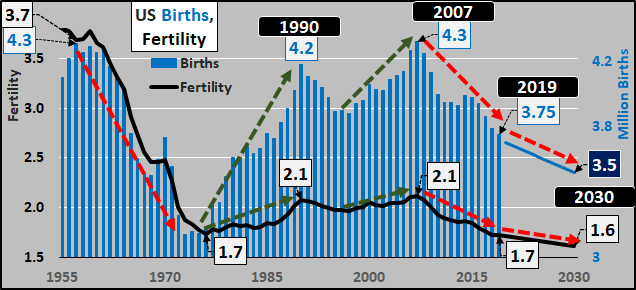
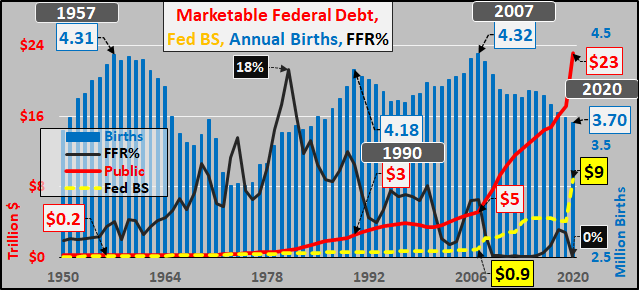
I have written repeatedly on the impacts of the Federal Reserve interest rate and balance sheet activities on the economy, raising asset prices absent higher wages to offset the fast rising rent/ insurance/ daycare/ education/ etc. etc. This is resulting in an inequitable burden on young adults and they are responding by focusing on scraping together an income…at the expense of marriage and/or children. Using births as the ultimate indicator of confidence, check the rises in births/fertility into 1990, 2000, and 2007. Since 2007, young adults are showing unequivocally this isn’t working for them.
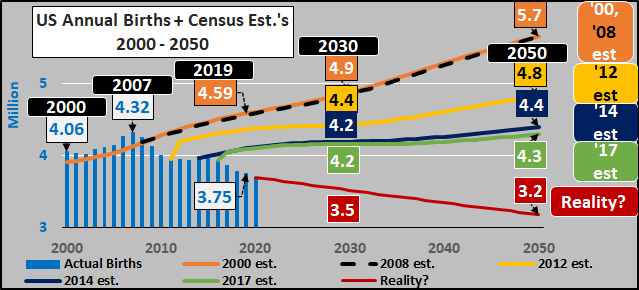
But looking at the Census estimates for births from 2000, 2008, 2012, 2014, and 2017…the Census has continually misunderstood the surging costs of the Fed’s policies negatively impacting family formation. Instead, Census models (like Fed models), continually predict a sharp and sustained upturn.
While debt and asset valuations (held by a small minority) are surging, the footprint of America’s future has never surged and despite the US population of nearly 320 million persons, the births (complete with those of all immigrants) has never really surpassed that 1957 peak…and is now tumbling while interest rate policy, federal debt, and Federal Reserve purchasing are being substituted for the lack of actual growth (2020 #’s are year-end guestimates).
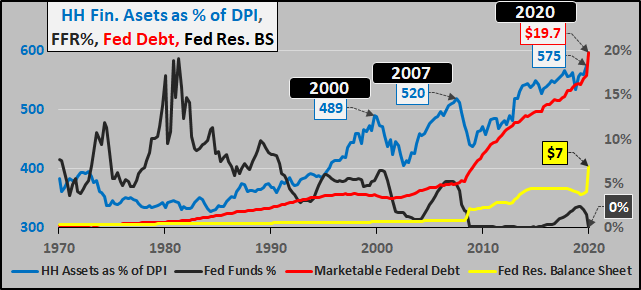
This fourth branch of governments policy is just blowing larger bubbles (record household financial assets as a percentage of disposable personal income), rewarding the asset holders (primarily elderly, wealthy, institutions, corporations) and punishing the vast majority for their lack of assets (2020 #’s are current through today except HH assets through Q4, 2019).
Perhaps its about time for a discussion of who the Fed is, who they serve, and either amend the Constitution to include them…or follow the Constitution and discard them?
via ZeroHedge News https://ift.tt/2MhsHa4 Tyler Durden
