The Best And Worst Performing Assets In June, Q2 And 2020 YTD
Tyler Durden
Wed, 07/01/2020 – 15:07
Citi had a lovely recap of what happened in the second quarter, which as we noted yesterday, was the strongest for stocks since 1998 thanks to trillions in global central bank liquidity injections, even as the global economy collapsed.
Citi also commented on what comes next, saying that “our US equity strategists characterize the sentiment as euphoric with more than 80% probability of negative returns in the next 12 months. In our view, everything has to go right for equity markets to be right.”
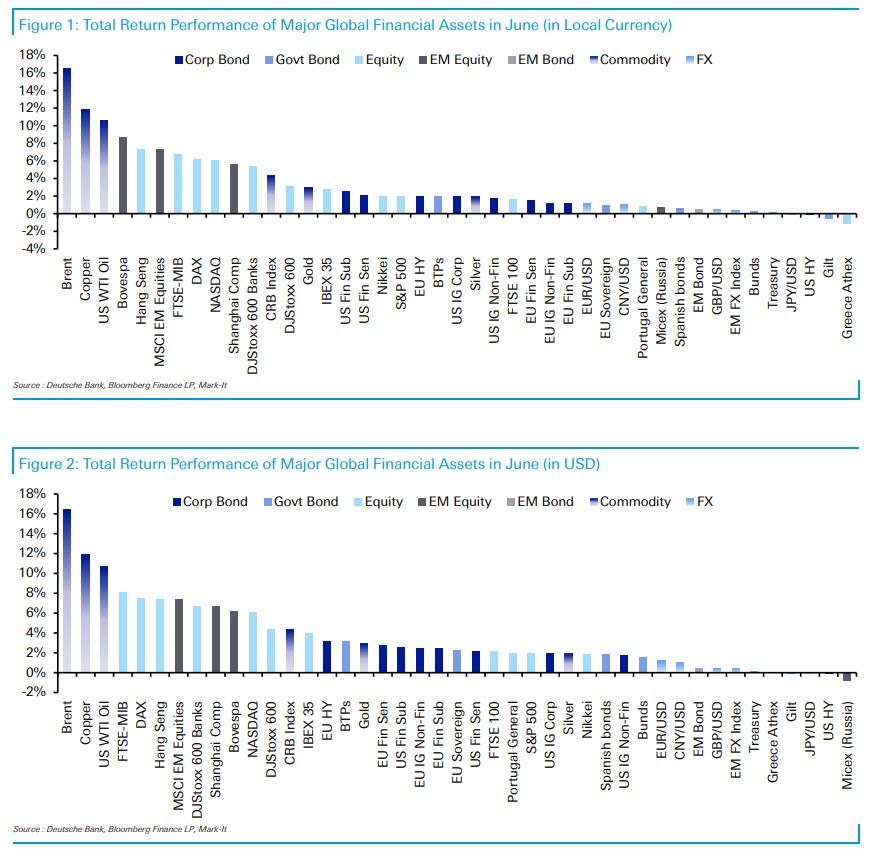
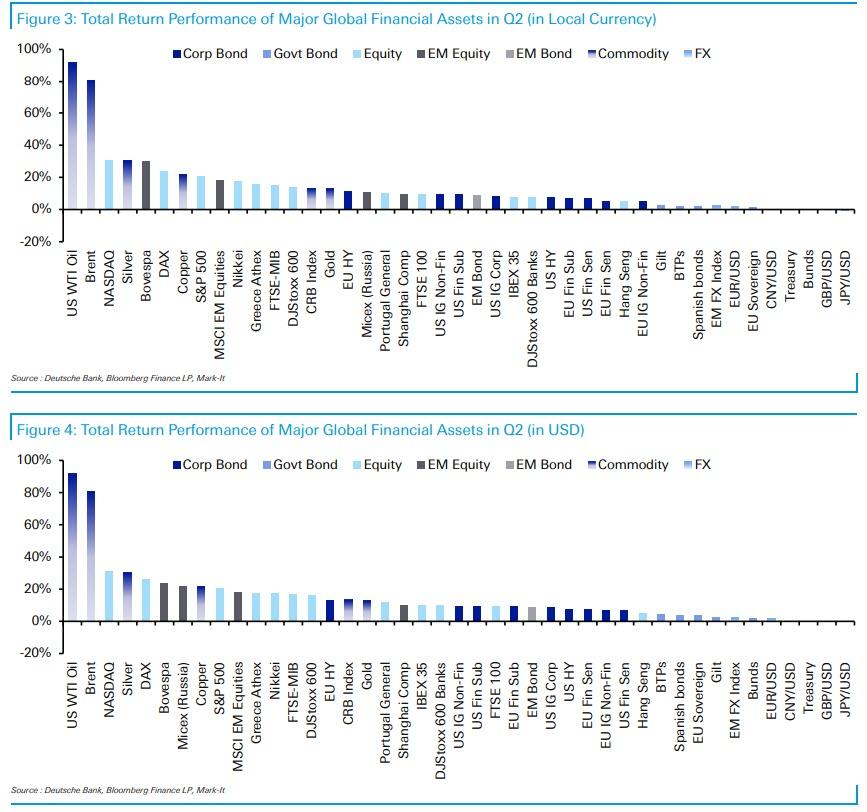
But while the disconnect between risk assets and underlying fundamentals has never been greater as even major banks admit, here is a recap of what worked in June, in Q2 and 2020 YTD courtesy of Deutsche Bank’s Jim Reid, who writes that “June saw another strong performance for risk assets, capping off an astonishing quarter that has seen all 38/38” of DB’s non-currency assets with a positive return over the last three months.
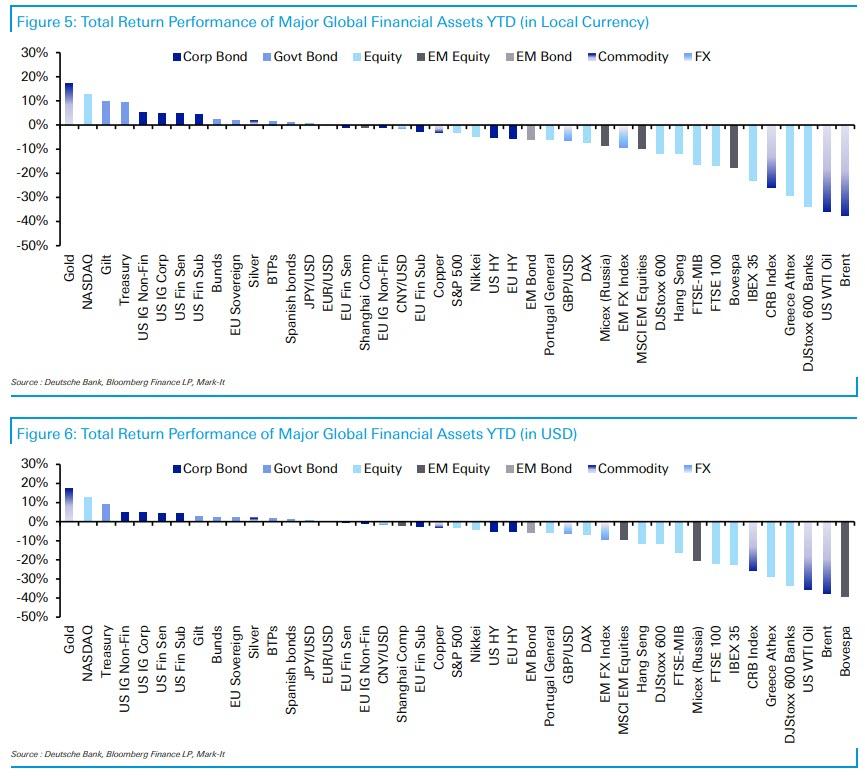
While that comes on the back of an appalling Q1 when financial markets reacted to the coronavirus pandemic, the gains from Q2 now mean that 13/38 of DB’s non-currency assets are now positive on a YTD basis as well in local currency terms. Much of these gains have come about thanks to slowing rates of case growth and moves to reopen major economies, as well as remarkable levels of stimulus from governments and central banks across the world. However, in the last couple of weeks there’ve been signs once again of an acceleration in case growth in some countries, including the United States, raising fears for where things might be headed in the second half.
Reid starts with oil, which has seen the biggest swings this year of all the assets and even tumbled in negative territory at one point in April. Looking at the quarter as a whole, WTI and Brent are top of the leaderboard, with returns of +91.7% and +81.0% respectively, making it the strongest performance for both since Q3 1990 when the Gulf War broke out.
Nevertheless, it’s worth noting that in spite of their best quarterly performance in almost 3 decades, both WTI and Brent are still at the bottom of DB’s league table on a YTD basis thanks to their falls in Q1, and are down YTD by -35.7% and -37.7% respectively.
Staying on commodities, gold continues to be the top performer on a YTD basis, with a +17.4% advance in the first half of the year. That comes on the back of another positive performance in June, with a +2.9% return, that saw prices end the month at a 7-year high. Other commodities have also performed strongly, with copper up +11.9% this month, in its own best monthly performance since November 2016. And on a quarterly basis, its +21.8% return is the best since Q3 2010.
Moving on, it was a strong quarter for equities on the whole as they recovered their losses from Q1. In fact, on a total returns basis, the S&P 500 just had its best quarter since Q4 1998, thanks to a +20.5% advance. However, even this strong performance still leaves the index down -3.1% on a YTD basis. Meanwhile, the only index in DB’s core sample that is actually positive on a YTD basis so far is the NASDAQ, which extended its YTD gains in June, and now has a +12.7% return since the start of the year.
Looking at FX, it was a bad month for the US dollar, with the dollar index falling by -1.0% in its 3rd consecutive monthly decline. On the other hand, the Euro had a strong month, gaining +1.2% against both the US Dollar in June as the continent has proven more successful at suppressing the virus than the US, which has recently seen an outbreak of new cases in many states.
Finally on the fixed income side, sovereign bonds underperformed equity indices for the most part in June. US Treasuries were up by just +0.1%, with bunds also up +0.3%. Nevertheless, they remain among the strongest performers on a YTD basis with gilts (+9.7%), Treasuries (+9.2%) and bunds (+2.3%) all in positive territory since the start of the year.
via ZeroHedge News https://ift.tt/31AQgUc Tyler Durden


