What If It’s Not Enough? Most Stocks Topped A Month Ago
Tyler Durden
Thu, 07/09/2020 – 13:55
Authored by Sven Henrich via NorthmanTrader.com,
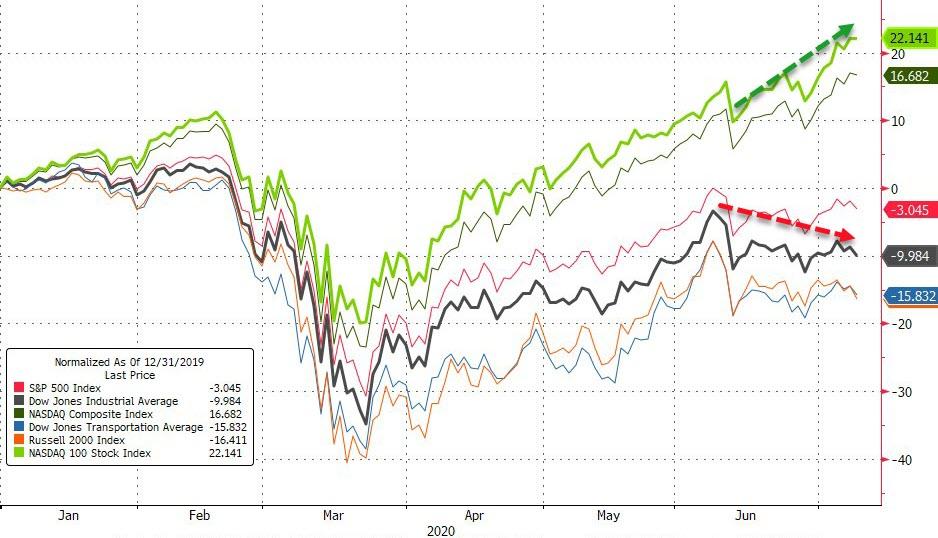
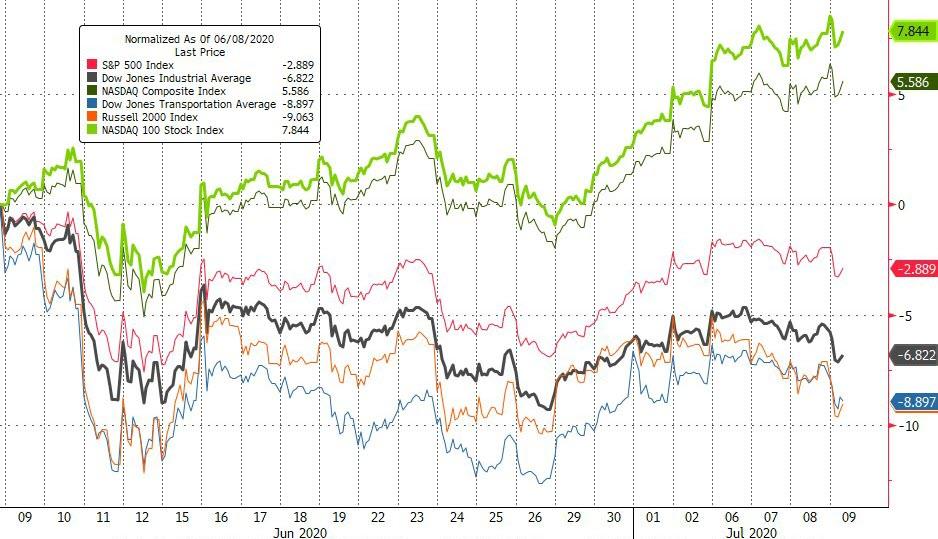
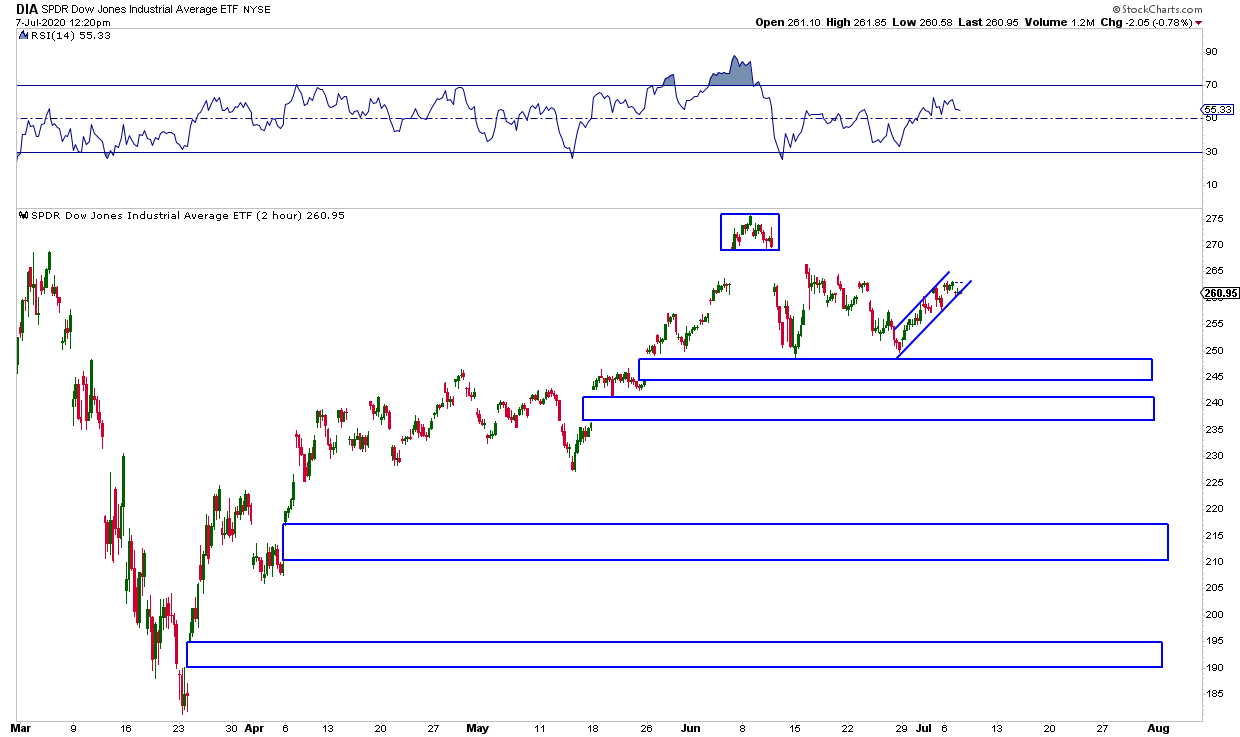
Newsflash while the tech bubble is running: Most major indices still peaked on June 8th, a month ago.
Hey, it may mean nothing as yet another stimulus package is just around the corner or so conventional wisdom goes.
Who can say, but I’ll share some charts on the $DJIA here that suggest the perhaps unthinkable and currently unprovable: That all this is still a bear market rally.
Why the $DJIA? Well, for one, it has some of the longest charting history and it contains key components of the larger economy. Yes it includes the tech monsters $AAPL and $MSFT but even they haven’t been strong enough to push the $DJIA to new highs in July.
Rather the $DJIA includes major industrials, banks, financials and a lot of the big companies representing large swaths of the American economy. And folks, it’s looking rather ghoulish.
Let’s start with some basics:
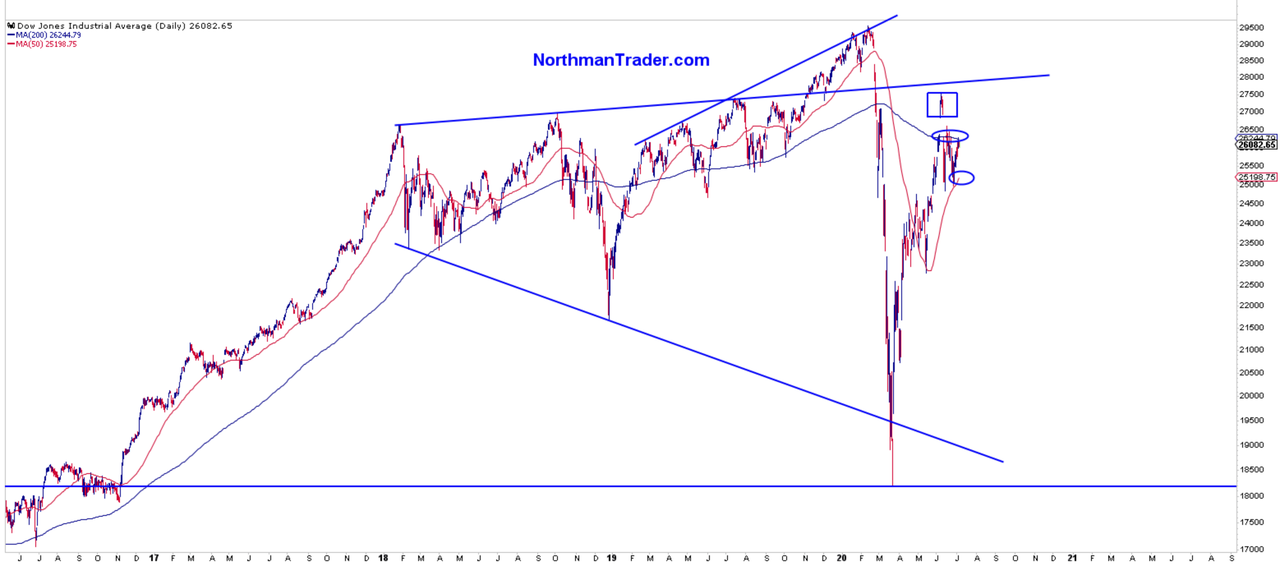
Here’s a daily chart:
Firstly note the $DJIA has not gone anywhere for two and half years. Big range. Blow-off top in early 2020 then the big crash bringing $DJIA all the way back to 2016 levels. That was a big shock as nearly 4 years of gains were wiped out in a month.
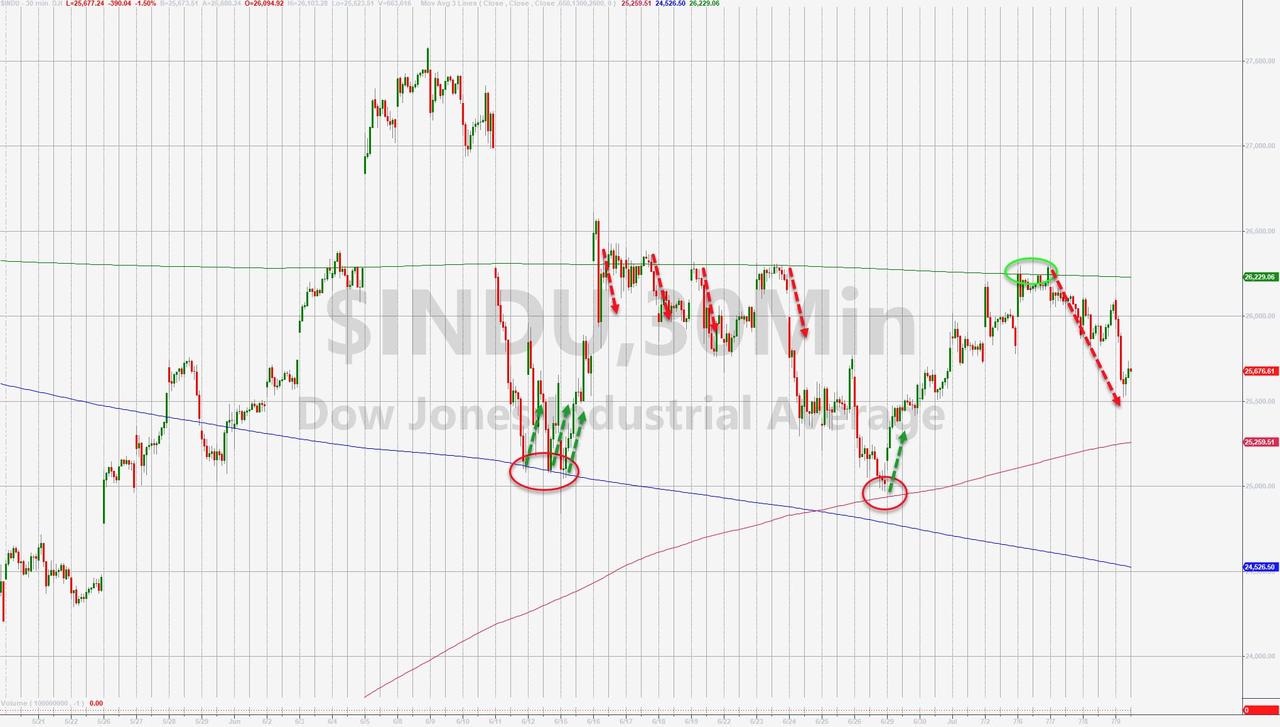
Then the big rescue operation culminating in an island reversal in June. That reversal has held and the June correction has brought $DJIA back below its 200MA and it has failed every attempt to regain it so far despite tech keeping making new highs.
$DJIA remains above the 50MA as support and that MA is rising. As long as that holds $DJIA has potential to rally higher later in the year.
But note the $DJIA, like many indices still have many open gaps below which puts it at technical risk of future gap fills.
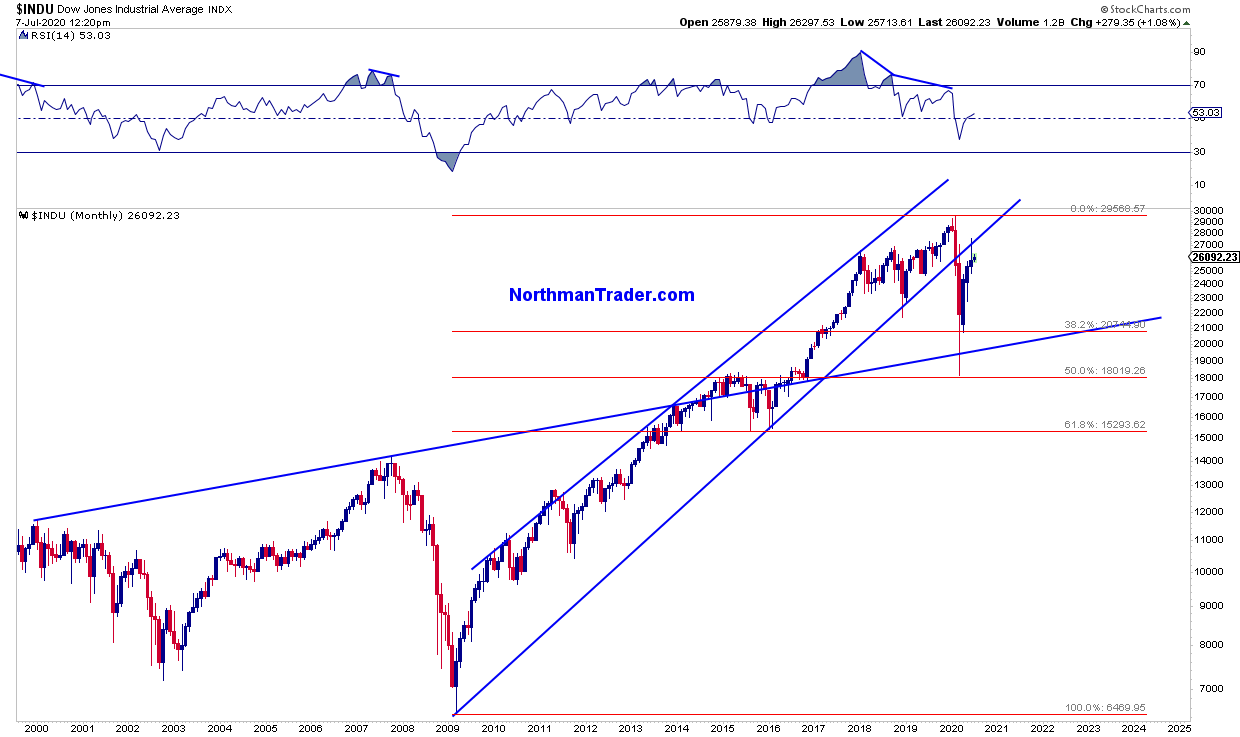
Why the island reversal in June? Why that spot? No technical accident as it coincided with key trend line reisstance:
Note also the perfect bottom at the .50 retrace in March. See, technicals can matter greatly on bottoms as well as on the top ends. Indeed the trend line that was broken in February dated all the way back to 2009 and has now shown to be resistance in June. Classic technical stuff. The implication: $DJIA has broken an 11 year old trend and has failed to recapture it.
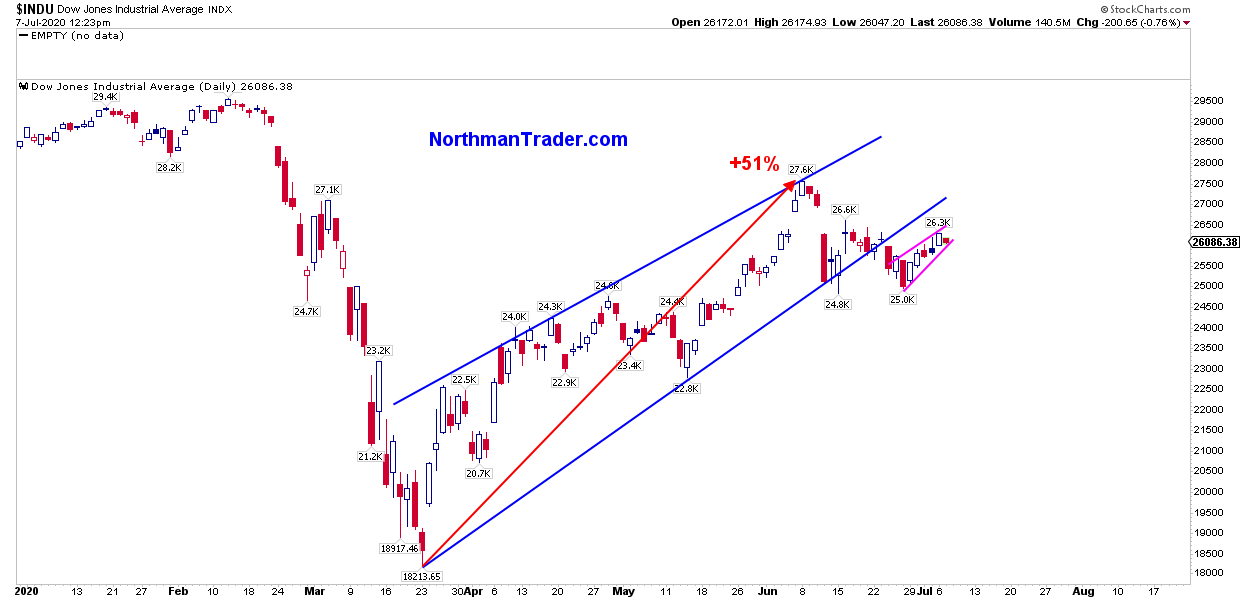
But the rally off the lows was powerful, very powerful, over 50%. So that must be bullish right?
Maybe, maybe not, for that rally came on a rising channel that $DJIA now has also broken:
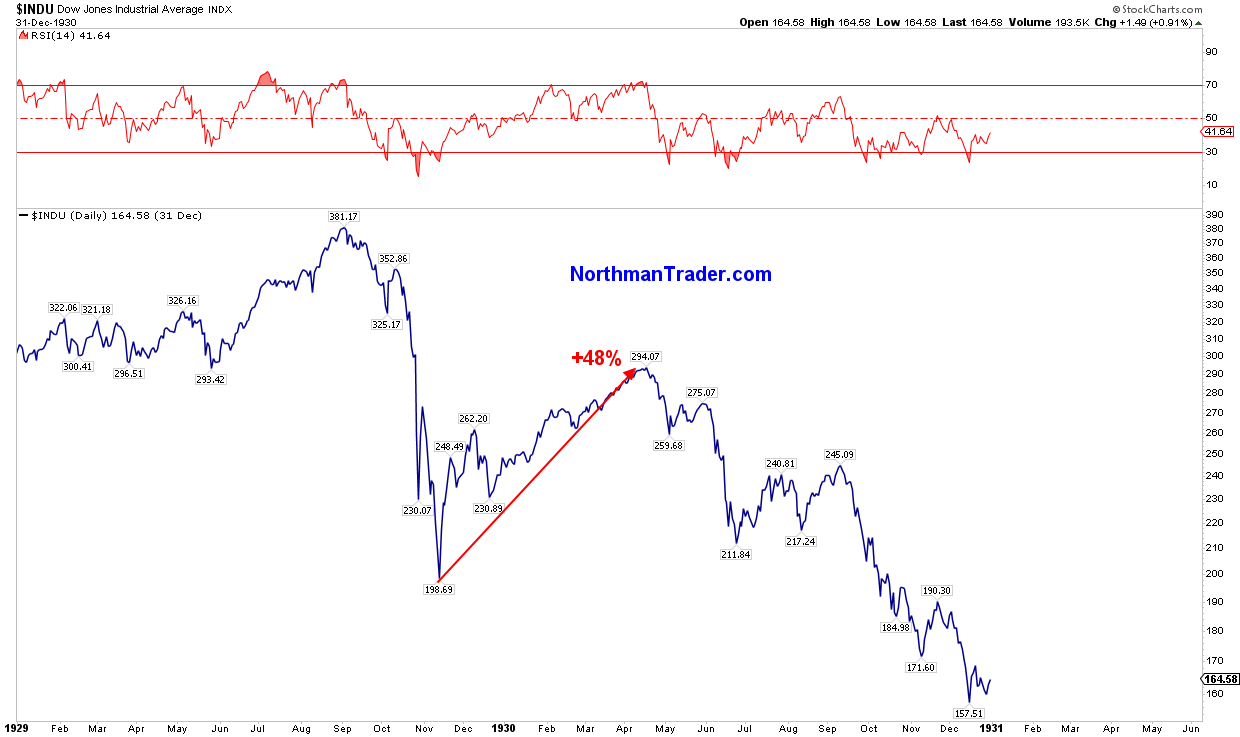
Furthermore 50% rallies are not necessarily a sign of better things to come in context of a structural bear market.
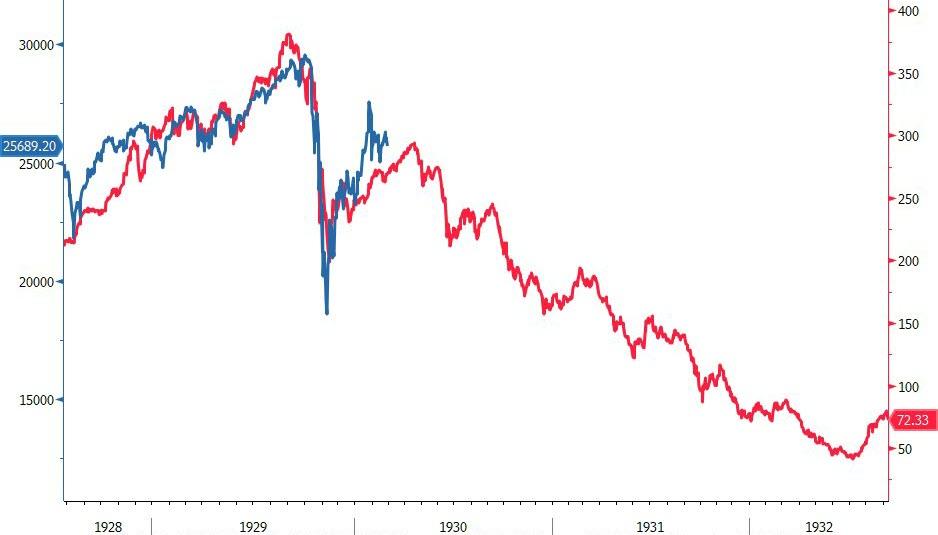
After all we saw a near 50% rally in 1929:
That rally too lasted several months before peaking and then starting to make lower highs which is what I submit the $DJIA has done so far in July.
Maybe a new stimulus package will change that, I can’t say, but we now have tech massively extended and indices such as the $DJIA making lower highs with plenty of open gaps below.
So we’ll see.
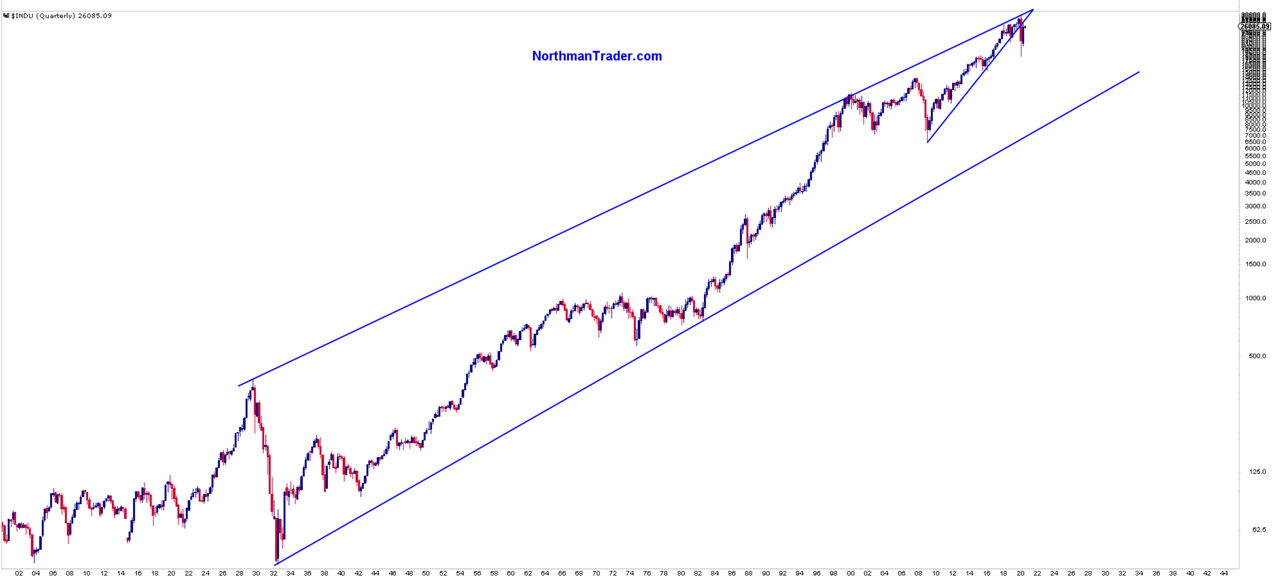
But 1929 is so long ago you say, how can a comparison apply? Don’t we have a Fed that saves every dip? Well, that appears to be the case for now. But in the big context of things, including 11 years of central bank printing and a global economy ever more indebted and dependent on zero rates it is perhaps notable that that $DJIA hit its 1929 trend line perfectly when it topped in early 2020.
It was a chart I pointed out on January 3rd as a warning sign:
Since we’re back in the roaring 20’s here’s a chart that dates back to that time.$DJIA and what can happen when it make new highs on pronounced negative monthly divergences.
Incidentally this chart points to a major decision to come in the next year or 2.. pic.twitter.com/Nv6K6VGIaQ— Sven Henrich (@NorthmanTrader) January 3, 2020
And now $DJIA has not only rejected that 1929 trend line, but it also broke its 2009 trend line and now has failed to recapture it as resistance:
While most are focused on the day to day action this little journey of the bigger picture I trust offers a bit broader perspective which is to say things are far from as bullish as many project them to be. $DJIA needs to fill the island gap and move above the June highs or it remains technically broken which is suggestive of sizable downside risk in the months to come. Stimulus package or else?
Or what if the stimulus package is not enough? After all while $3 trillion in Fed intervention have managed to juice the Nasdaq to new highs but preciously little else and have failed to technically repair the broken trend on $DJIA. and that makes the $DJIA the gargoyle of this rally to be watched closely.
via ZeroHedge News https://ift.tt/31Xz0ZL Tyler Durden
