Stephanie Kelton On MMT & Blurring The Lines Between Debt And Money

Stephanie Kelton On MMT & Blurring The Lines Between Debt And Money

Tyler Durden

Sat, 10/31/2020 – 14:55

Thanks to the public fascination with MMT, Stephanie Kelton has become one of a handful of rockstar economists, known for her frequent appearances on cable news on behalf of the Bernie Sanders campaign (she served as one of the campaign’s top economic advisers), Kelton is also the author of “the Deficit Myth”, a bestselling book arguing, essentially, that the US government can run perennial deficits, then order the Fed to simply vacuum up excess debt, leaving plenty for the global dollar-based financial system. In such a system, taxation would be fine-tuned by Congress to carefully stave off inflation, preventing the dollar from devaluing like the Argentine peso, or worse, the Venezuelan bolivar.

Kelton’s ideas have been widely discussed in the financial press and we’d rather not reiterate, or relitigate, them here. Rather, Kelton’s MacroVoices interview serves as a helpful overview of her ideas, and touches on very basic concepts at the center of her thinking, like answer the question “if the government can simply print money to finance its budget, then why do taxes exist?”

Kelton and interviewer Erik Townsend delve into this pretty early in the interview.

Why Pay Taxes?

Erik: Now, let’s go a little bit deeper on those taxes and bonds because what a lot of people would say is, well, if you figured out that there’s kind of a magic source of income here and we don’t need those taxes. Let’s eliminate taxes and never have them again, because we don’t need taxes, we can print new money. But the study of MMT says actually taxes are very important, but maybe for an unobvious reason pertaining to inflation. So why do we still need taxes?

Stephanie: Okay, well, remember I just want to go take one tiny step back and just sort of reassert the point that it’s not that we can print money. It’s that there is no other way for the government to spend but to create new money as it’s been so its newly created digital dollars, and there’s no other way for it to work.

And so your question is a very good one, so once you recognize that the government spends its currency into existence, then you say, well, then why do we have to pay any taxes at all? Why not just let the government spend and forget the tax piece, which, by the way, is exactly what Congress has been doing.

Let’s just take the cares act as one example, the biggest relief package that has so far gotten through both the House and the Senate and signed into law that was $2.2 trillion. And that bill was Congress writing what we in the DC beltway circles call a clean bill, in other words, it was not offset the spending was not offset. The Congress said, listen up fed, we are ordering up $2.2 trillion, get ready, because you’re going to carry out the payments that we have authorized on behalf of the US Treasury, that’s how it works.

So, this is an example of Congress committing to spending money it did not have, it’s just what it has is the power of the purse it can commit to spending $2.2 trillion. And the Fed as the government’s fiscal agent will carry out those payments by changing the numbers in the appropriate bank account. So for people who got that $1,200 stimulus check, the way that the money got into your account is that the Federal Reserve and the bank that you bank at change the numbers upward in your account.

And so there was no pairing of higher taxes to go along with this, so why do we sometimes increase taxes? Why do we have taxes at all?

So in the book, I go into a lot of detail on this, if you wanted to start up a currency from scratch then a tax or something like it fees, fines.

Also, other obligations governments impose to get a population to put a population of people in a position where they need to earn the state’s currency in order to settle their tax or other obligation to the state.

And we could talk a lot about this, but we don’t have time, so I’ll just say that one reason for taxes is that they allow governments to start up a currency from scratch. Once that currency has been started up and now people are accustomed to having this currency around, they begin making their own payments and transacting in that currency. And the government can use the tax lever to pull some of those dollars back out of our hands.

“A Much More Nuanced Conversation” About Inflation

Erik: Now, I know that one of the ways that you do think about taxes in MMT is as a preventive measure to overcome the tendency of that spending to bring about inflation. What I haven’t seen addressed and maybe I just haven’t read enough about it is, wait a minute, inflation tends to be a vicious cycle with a long lead time.

That has to do with inflation leading to inflation expectations, leading to acceleration of velocity of money, and it feeds on itself and once it gets going, it’s hard to break it. So it seems to me like I worry about whether, how do you know the taxes enough to prevent that cycle from starting and how do you break out of that cycle. If some of the money that’s being created through MMT by the government financing more of its spending just by printing new money does start to lead to that widespread inflation?

The other problem that I have understanding this inflation argument is at least some people, and maybe this is the politicians as opposed to the MMT scholars are saying, well, it’s really what we have to do to prevent the inflation, we’ve got to tax the rich specifically. Tax the rich, well, wait a minute, the rich are the people whose spending habits are not really directly impacted by their tax burden and their inflation because they’ve got enough assets that they can continue spending. So how do you overcome the potential of creating a vicious cycle of inflation? Is it just taxes? Or are there other measures that MMT uses to overcome that inflation risk?

Stephanie: Okay, so let me start by saying there’s a terrific, short, accessible piece, but your audience is very smart so they can handle the higher order stuff. There’s a piece in the Financial Times that was coauthored by three MMT scholars and I think the title of the piece is something like “How MMT Thinks About Inflation” or “How MMT manages inflation” [ZH: “An MMT Response On What Causes Inflation”] Something along those lines, people can find it because I wouldn’t have time to do it all justice here.

But look, okay, let’s start by recognizing that inflation, as you say, is a dynamic process, it is a continuous increase in the price level, it’s not a one off. It’s a complex phenomenon, there isn’t economist on Earth who can write down for you a model of inflation that will apply in all times across, space and time, nobody can do it.

The Federal Reserve, Daniel Tarullo, who was a Fed Board of Governors member, he rolled off the board of governors and went out. And one of the early speeches he gave just made huge headlines, because he went out and he said, the Fed does not have a working model of inflation, we don’t know.

So once upon a time, there was a quantity theory of money and man, you could write that equation down, everybody could see it. And you said, inflation happens because velocity is constant, and the real economy tends to full employment.

And once you apply a little calculus to the quantity theory to the equation of exchange, then you know that inflation is always in everywhere, a monetary phenomenon. Money supply growth rate accelerates, inflation will accelerate to the same degree, well, that’s clearly silly and wrong. And you know, we have decades of experience with QE where people who relied on that thinking expected quantitative easing to drive inflation or possibly hyperinflation.

Of course, it didn’t do any of that, then you had the Phillips Curve and you say, well, it’s the Phillips Curve, that’s the model I’ll write down and that’s my inflation model. Well, listen, nobody believes this stuff anymore and you can expectations augment the Phillips Curve all you want, and it still isn’t workable.

So I don’t believe that we should think of inflation as something that happens because expectations become unanchored and people formulate ideas about where prices are headed, and then it becomes self fulfilling. That’s just silly stuff that we make up, I think we need to be more serious than that, price has changed, because producers raise prices, people change prices. They don’t just happen and they certainly don’t just happen across all categories of consumer goods, so let’s think a little bit harder.

If I go down stairs after this interview, and I hope this doesn’t happen, but if I go downstairs and find my basement is flooded, I don’t just run to one part of the house and say, oh, I have to stop the flooding in the basement. I don’t know what caused the flooding in the basement, I don’t know if a kid left a faucet running if a toilet overflowed, if a pipe burst, if you know the dishwasher is leaking, I got to find the source of the problem.

And I think that’s the way we in MMT think about inflationary pressures, you have to look under the hood, you have to go to what is driving that headline price inflation. I’ll give you just one quick example, the supreme court’s going to take up the case on the Affordable Care Act that’s going to happen soon. And there is a chance that the Supreme Court will say the ACA is unconstitutional, and provisions like protections against pre existing conditions that could go away some of the cost controls around medical reimbursements and prescription drug prices and so forth.

Blurring The Line Between Debt And Money

Erik: I want to move on to what you actually have identified as the next myth in the book, which would also be the feedback that you’d probably get from a lot of people who would say, look, what you’re talking about doing here amounts to stealing from future generations. You’re just scribing away without having to raise taxes, which makes it more politically viable for the government to spend more money that we don’t have and increase the national debt. That’s going to have to be paid off someday by our children and grandchildren, that’s immoral. Why is that a myth?

Stephanie: Well, it’s a myth because none of it makes any sense whatsoever. I mean, I’m sorry, I’ll just be as kind of upfront and candid as I can, I think that’s just really silly. And I know that it’s common, and I know that people repeat it and I know that sometimes serious people repeat these kinds of things.

So this falls right back into the household analogy, right back into that trap of thinking like government as a household. And when we use words, like borrowing, like paying it back, calling this thing the dead, we are falling back into that household trap. The Federal Government’s nothing like a household, it doesn’t operate its budget like a household.

So here’s just one example, okay, when the government runs a deficit, it matches up the deficit spending by selling treasuries, right. We know that and that’s something it chooses to do not something it must do. The government sovereign government doesn’t need to borrow its own currency from anyone in order to spend but the government currently matches up its deficit spending with bond sales.

So what happens? So the government spends $100 into the economy, taxes let’s say $90 back out, we say the government has run a deficit, we look at it as a shortfall. That’s not a shortfall, this government’s the scorekeeper for the dollar, right? It’s adding 100 and subtracting 90, somebody gets 10 points, that’s those $10.

Now the government comes along and says, well, because I ran a deficit I’m going to sell these treasuries, which means the government is going to subtract back out the $10 and replace them with 10 treasuries. So what the way that I look at it isn’t that the government is borrowing in any meaningful sense. If I go to a bank for a loan and I sit down with the loan officer I don’t plop the money down on the desk in front of the loan officer and then ask for the loan I came there because I don’t have the money, that’s why I’m there to borrow.

The federal government is the issuer of the currency, it doesn’t borrow because it doesn’t have the money. What it’s doing is first supplying its currency and then transforming those dollars into a different financial instruments into US Treasuries. So it’s allowing us to hold dollars that amplify themselves over time, that those are amplifying dollars. Why? Because they pay interest.

So I look at the treasuries as a form of payment, not a form of debt, there’s nothing being borrowed, there’s something being paid out. And when the Treasury matures, when the bond matures, it simply converts back into its original form, it converts back to the currency form. So paying it back quote, unquote involves nothing more than shifting funds from one account at the fed a securities account into what’s effectively a checking account, a reserve account at the Fed. That’s all the more complicated it is to quote, unquote pay it back, but I think that we have a communications problem. We don’t have a debt problem, we just have chosen very unhelpful words to narrate what’s actually taking place?

* * *

Source: MacroVoices

During the opening of the interview, Townsend noted that he and his team had reached out to Warren Mosler, an economist whom Kelton credited as one of the Godfathers of MMT thinking.

Readers can listen to the interview in full below.

via ZeroHedge News https://ift.tt/37XK8Zr Tyler Durden

Cop Roasts Leftist Protester After She Demands To Deal With Female Police Officer

Cop Roasts Leftist Protester After She Demands To Deal With Female Police Officer

Tyler Durden
Sat, 10/31/2020 – 14:30

Authored by Paul Joseph Watson via Summit News,

A cop hilariously roasted a leftist protester during recent unrest in Seattle after the demonstrator demanded to deal with a female officer, to which the cop responded, “How do you know they don’t identify as female?”

The video clip begins with a confrontation between what appears to be two female protesters and two male officers.

“Shut the fuck up, you’re really fucking pushing it, you piece of shit!” the protester yells at the cops before appearing to spit at them.

Although it’s difficult to tell what is happening, the cops then appear to arrest and handcuff one of the women as her friend yells, “Don’t touch her!”

“Get a female police officer now, I am demanding you get a female police officer now!” she adds.

“How do you know they don’t identify as female?” responds the cop.

“What? What did you just ask me?” the protester says, baffled.

“You’re assuming those officers genders,” the cops responds.

Respondents to the clip enjoyed the roast.

“I love how at the end they say fuck in such a defeated voice knowing damn well it’s thanks to their bullshit that people can throw that card,” commented one.

“Absolutely brilliant. You could hear her brain short-circuit,” remarked another.

“Well it is Seattle after all. He may be honestly asking the question,” said another.

*  *  *

New limited edition merch now available! Click here.

In the age of mass Silicon Valley censorship It is crucial that we stay in touch. I need you to sign up for my free newsletter here. Also, I urgently need your financial support here.

via ZeroHedge News https://ift.tt/3oMTf56 Tyler Durden
Here Is The Result If The Polls Are As Wrong In 2020 As They Were In 2016

Here Is The Result If The Polls Are As Wrong In 2020 As They Were In 2016

Tyler Durden
Sat, 10/31/2020 – 14:05

While very fluid, we can track the latest results of the electronic prediction markets and polling data.

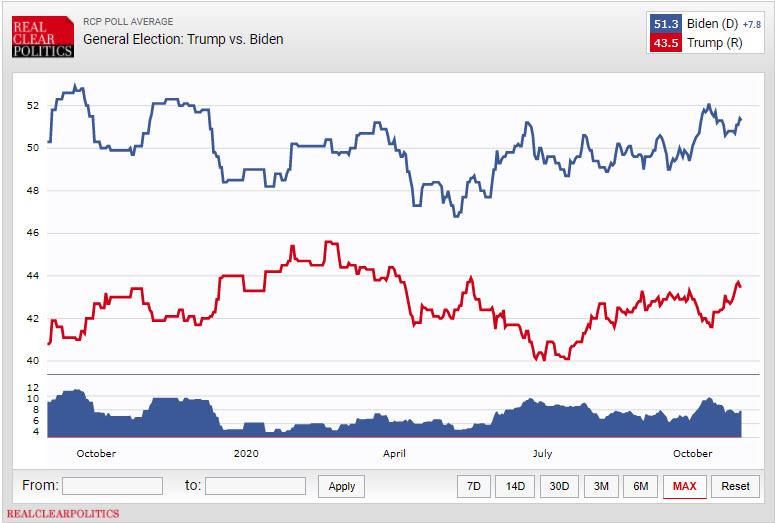
PredictIt currently has a 66% probability for a Biden victory, which is up from a week ago at 62.9% and also higher than four weeks ago, although as usual one has to be aware of just how little capital needs to be deployed to manipulate the illiquid PredictIt market (something every prominent Democratic financier with deep pockets would be well aware of in seeking to manipulate public sentiment in the cheapest possible way). A Trump victory has a roughly 39% probability according to this data, which is up slightly from 37.1% a week ago. The national polls – compiled by Real Clear Politics – suggest a similar tilt in the race with Biden having a 51.3%-43.5% lead against Trump.

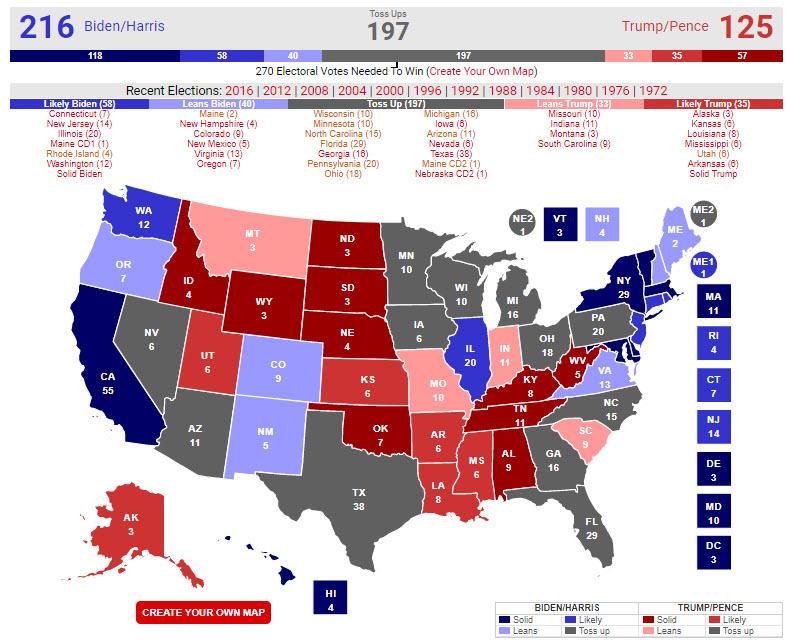
Digging into the state polling in competitive states, Biden currently leads in all the battleground, or “toss up” states except for Ohio, Arizona and Texas. This would give him a comfortable Electoral College (EC) victory of 357-181…

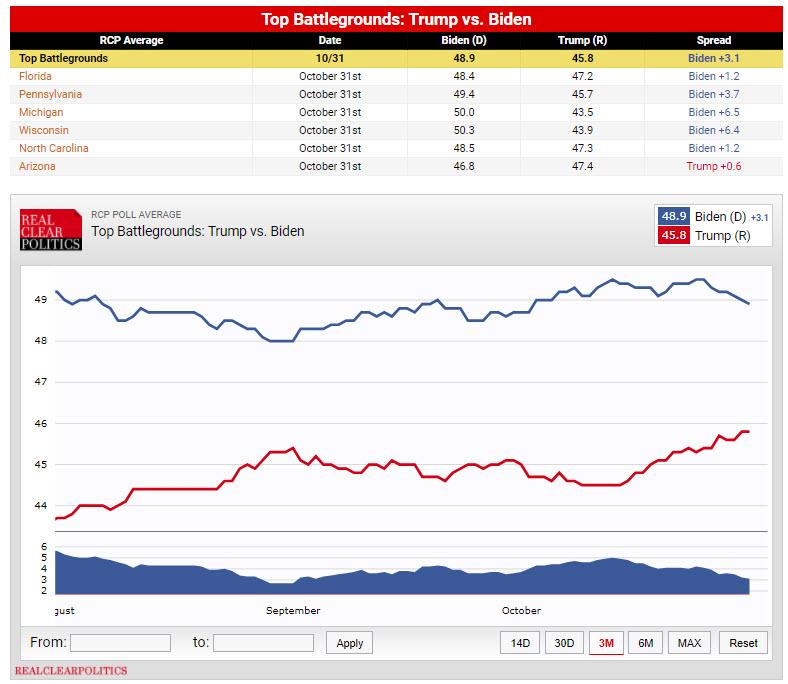
… even though RCP’s average polls of Top Battleground states (FL, PA, MI, WI, NC, AZ), is now just +3.1 in Biden’s favor down from 5% to weeks ago, with Arizona just flipping to Trump.

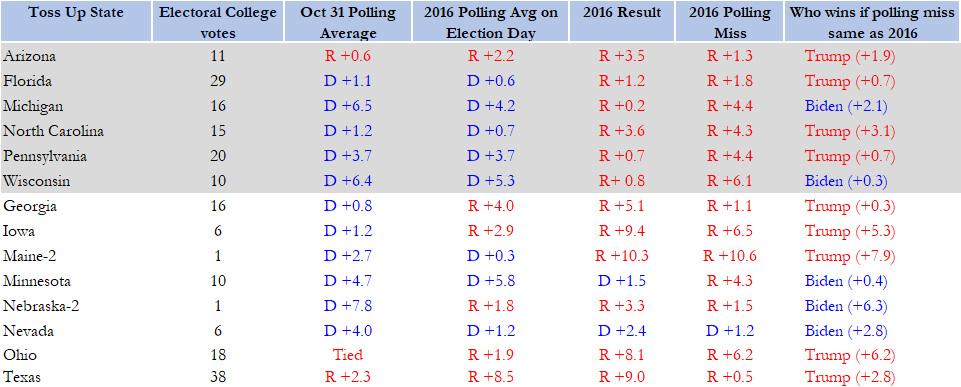
That said, polls are imperfect as 2016 demonstrated – indeed, if we apply the polling miss from 2016 as Bank of America did last week, Florida, North Carolina, Pennsylvania, Georgia, Iowa and and Maine would flip. For this exercise we have used the latest RCP polling average data as of Oct 31, which continues to swing in Trump’s favor:

These numbers are then adjusted by applying the same error rates as were observed during the 2016 polling, and the results are shown in the table below:

Remarkably, if the polls are as wrong as they were in 2016, Trump would win with 279 of the 538 electoral votes, while Biden would get 259.

Still, the margin of victory would be within 0.5 percentage points in Wisconsin (for Biden) and Georgia (for Trump), which would trigger an automatic recount and delay results. In addition, the margin in Pennsylvania would be less than 1.0%.

In short, no matter what happens on Nov 3, expect recounts and extensive delays before we have a clear winner.

Putting this together, Bloomberg said it best: “All of that means a Trump win on Tuesday would represent a historically staggering failure by public opinion polls, eclipsing even the 2016 miss. While the president’s chances of being re-elected aren’t zero, pollsters say it’s a long shot.”

“If Donald Trump wins, in 2020, anything close to a decisive Electoral College win knowable on election night, that would have repercussions for the research profession that would ripple forever — and deservedly so,” said Jay Leve, chief executive officer of SurveyUSA, a polling firm.

As Bloomberg notes, Level and other pollsters say the election outcomes range from a blowout Biden win to a closely fought contest that could hinge on recounts and court rulings that either candidate could win. They don’t consider a clear, quick and decisive Trump victory among the possibilities.

“It would be astonishing,” Leve said.

via ZeroHedge News https://ift.tt/2Jp1sMR Tyler Durden
The Great Financial Crisis vs. COVID-19: The Impact On Commercial Real Estate & CMBS

The Great Financial Crisis vs. COVID-19: The Impact On Commercial Real Estate & CMBS

Tyler Durden

Sat, 10/31/2020 – 13:40

Submitted by Trepp CMBS Research

With the devastating impact and lessons learned from the 2007-2009 economic downturn still fresh on the minds of Wall Street, the current COVID market crisis has drawn a fair amount of comparisons to the Great Financial Crisis (GFC). While most had expected the pandemic to serve more as a temporary, short-term disruptor to global economies, it soon became apparent that a sudden global health crisis would leave its mark in a way that differs from anything else we have experienced in recent memory – that it would have the potential to not only have long-lasting physical effects, but also a deeply rooted social and psychological one.

With uncertainty being the name of the game in our current world, policymakers are left to navigate uncharted waters with no benchmark or other handbook on how to weather the coronavirus market crisis.

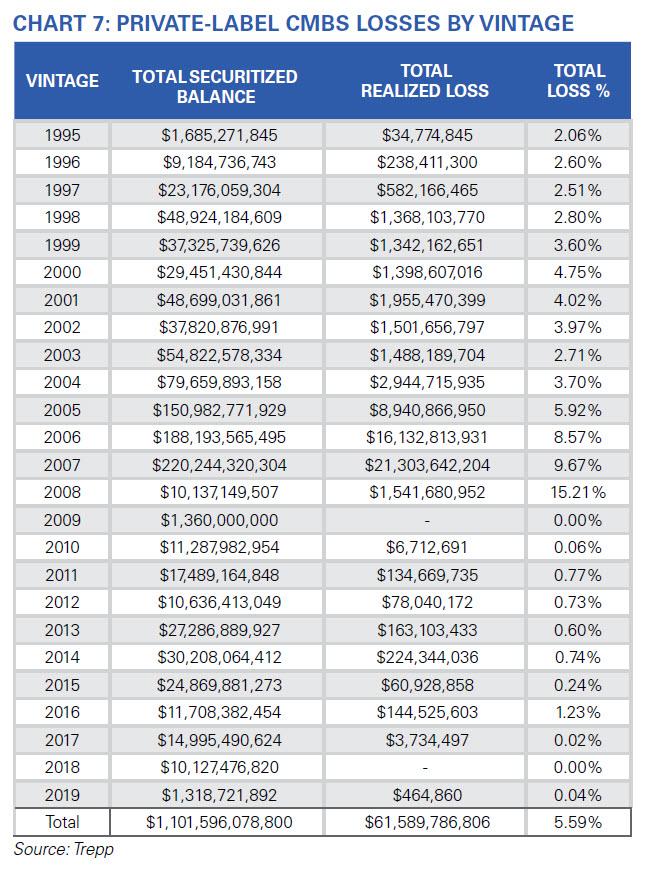
In this report, Trepp examines how the commercial real estate (CRE) and commercial mortgage-backed securities (CMBS) sectors were impacted by the GFC in terms of delinquencies, spreads, losses, cumulative appraisal reduction amounts (ARA), and new structural and regulatory enhancements, and how market conditions at the time compare to the current crisis caused by the coronavirus pandemic.

The major difference between the GFC and the current economic recession triggered by the COVID-19 pandemic has to with its origins. The previous financial fallout of 2007 was caused by endogenous market factors that resulted from excessive risk-taking by financial institutions in an increasingly deregulated macroeconomic backdrop, a byproduct of banks seeking easy profits which ultimately led to the proliferation of subprime lending, overleveraging, and other performance weaknesses. The current market downturn, by contrast, was prompted by an unexpected shock that came from outside the financial system during a time of economic prosperity, more stringent regulations, as well as stronger underlying credit and risk conservativeness.

CMBS Market Distress – What Time Frame Are We Looking At?

For the CRE and CMBS sectors, the COVID crisis has had a broad-ranging disturbance, with the effects rippling into the way we engage with others in social settings, how we work and interact with coworkers, how we travel, to how we shop and buy groceries. Consequently, this has accelerated existing CRE trends that have been taking some time to take form in an increasingly digitalized world, such as the shift away from brick-and-mortar retail spurred  by ecommerce growth, while also reversing other industry trends (at least in the near-term), including a flight to less densely populated suburban areas. This has forced property owners to repurpose or find creative uses for space in malls and hotels that are expected to remain vacant for some time in order to adapt to a changing and unpredictable industry landscape.

The Great Financial Crisis

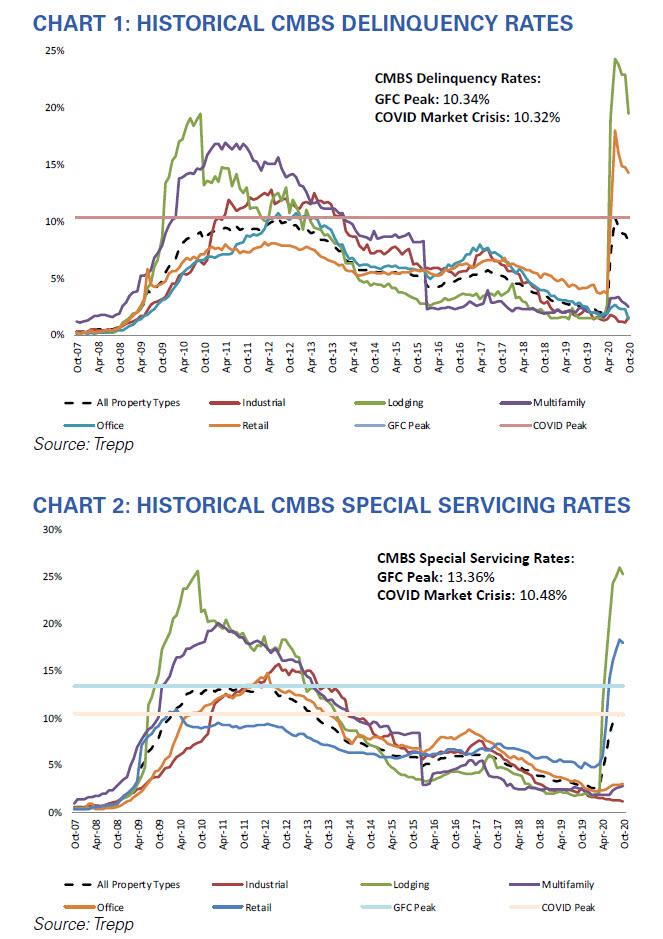
During the GFC, the distress took a notably longer time to play out as CMBS delinquencies and special servicing rates didn’t reach their peak of 10.34% and 13.36% until mid-2012, several years after the start of the turmoil in 2008. Multifamily and lodging were the two most troubled asset classes, with delinquency rates for those two property types peaking at 16.93% (20.07% peak for special servicing) and 19.46% (25.59%), respectively, between the second half of 2010 and first half 2011. Apart from retail, overall delinquencies for each of the major five property sectors were elevated in the double-digits until early 2013. Since the economy was still churning despite a slowdown in activity, borrowers held onto troubled properties for much longer before finally coming to the decision to give up ownership. On the same token, the eventual economic rebound and job recovery process that
followed similarly took years to unfold.

The State of the Markets Amid COVID

By comparison, due to a near complete shutdown of parts of the economy earlier this year, lodging and retail became the two property segments that were immediately hit hard by mitigation policies preventing travel and large social gatherings. This culminated in the fastest rise in delinquency rates we’ve seen in CMBS history, with 30+ day delinquency rates hitting a near all-time high of 10.32% by June 2020 or within three months that the economy transitioned into lockdown mode. Much of the increase was driven solely by a surge in lodging and retail delinquencies, which moved up to 24.30% and 18.07%, respectively, that same month – the highest on record for the CMBS industry. The distress for all other property types such as multifamily and office, however, remain more contained as tenants stay locked into long-term contracts for the time being or in the case of industrial, somewhat abated by the expansion in online shopping. Similarly, special servicing rates during the COVID crisis also clocked in at new all-time highs for lodging (26.04%) and retail (18.32%) in September, bumping the overall reading to a post-GFC crisis high of 10.48%.

With all pockets of the economy coping with the challenges of a public health crisis together, large volumes of CMBS loans suddenly needed forbearance and other financial respite as master and special servicers stepped in to process workouts and other modification requests. After a thorough review of thousands of special servicer commentary and supplementary loan materials, Trepp estimates that more than $31.2 billion across 800 loans have been granted forbearances thus far based on September remittance data, which represents about 5.5% of the non-agency CMBS universe. Roughly 64% of that forbearance tally is backed by lodging and another 28% is comprised by retail loans. This has helped to reduce overall delinquency rates starting in July as new 30+ day delinquencies have been leveling off thanks to a gradual reopening of parts of the economy and borrowers becoming authorized to tap into reserves to meet debt service needs.

Issuance and Spreads

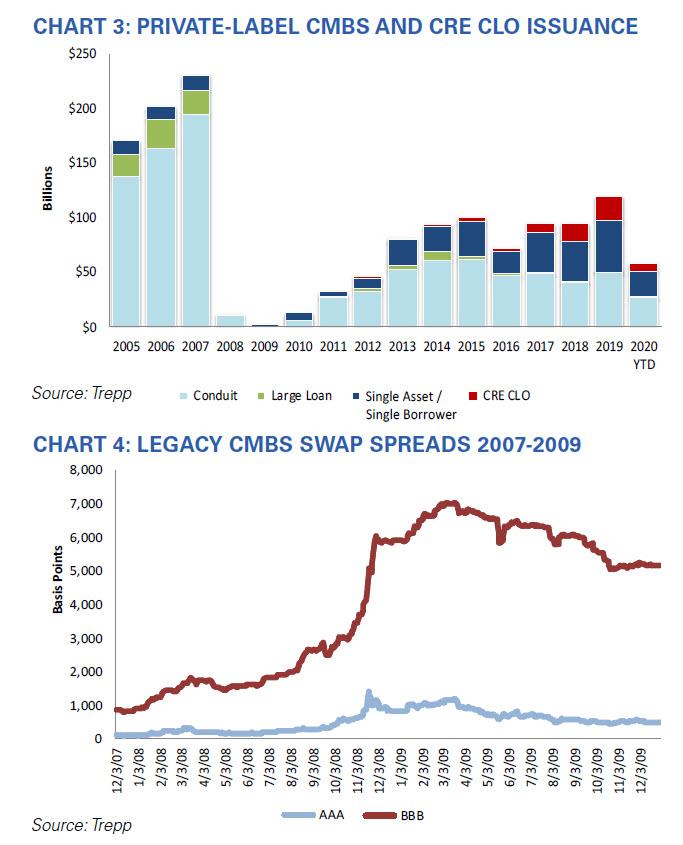
In the case of the primary issuance segment, issuers resumed bringing new deals to the market by May in hopes of clearing out their loan inventories ahead of an uncertain November election outcome. Though a good chunk of loans being securitized in new issue transactions have been pre-COVID originations and are limited to seemingly more “safe” property types that exclude lodging and retail, AAA spreads have generally retraced all widening that took place during the early months of the crisis and have returned to levels from early this year. New conduit offerings in September/October were being executed in the S+86 to S+92-range for the LCF AAA, significantly tighter than the S+138 to S+145 prints in May and June of this year that came during the height of the volatility (while subordinate spreads continue to remain wider). This stood in stark contrast to the primary market rebound following the GFC as the segment was essentially frozen with nil issuance for 21 months between 2008 and 2010.

Other Indicators for CRE Performance

With the COVID volatility coming so abruptly, many industry watchers have turned to other indicators and data points as a measure for how the CRE segment has been holding up, especially given how difficult it can be to accurately diagnose and track loan performance in today’s more opaque environment. This gave rise to new ways of interpreting and analyzing CMBS servicer data, such as looking at loans in grace period as a gauge on the direction of future delinquency rates; reading through servicer notes for extra color on modifications, DIL proposals, and context on individual CMBS borrowers and properties; and reviewing valuation haircuts and appraisal reduction amounts (ARAs) assigned post-COVID. In addition, many have also started to keep watch on loan paid through dates as a benchmark for “shadow” delinquencies – also known as loans for which a payment has not been made to the latest month but that reflect a “current” payment status as per the terms of a forbearance approval.

Based on an October 2020 snapshot, there is another $2.7 billion in lodging loans and $3.0 billion in retail loans that are considered “current” that are not paid through the month of October, which amount to about 4.15% and 2.77% of the bucket for all “current” loans for those two property types, respectively. If those loans were added to the delinquency calculations, the overall reading would be 2-3% higher for each of those two property types than what is reported.

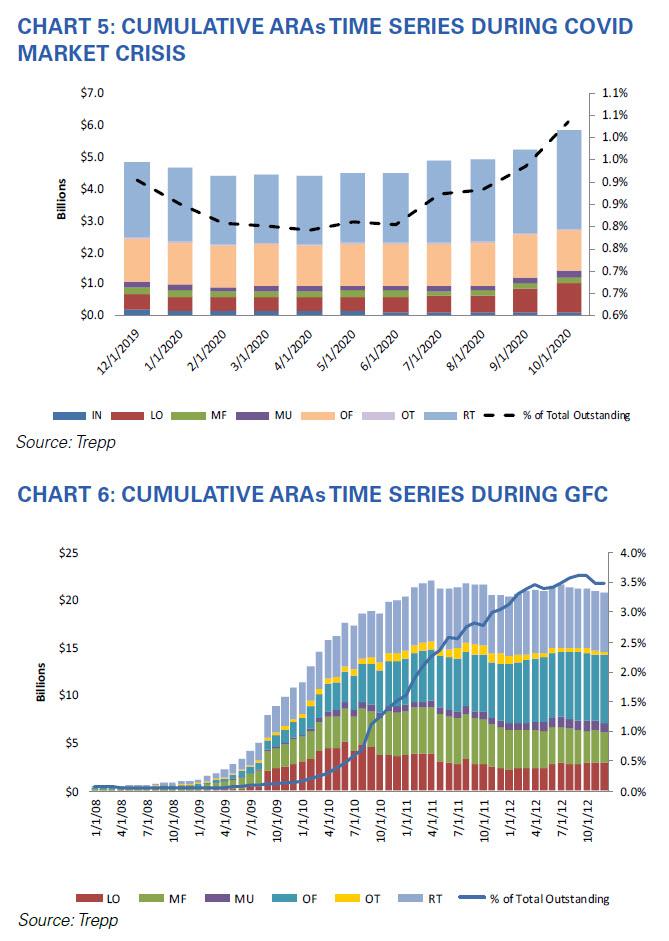
Since the start of the pandemic, appraisal reduction amounts (ARA) have already been climbing up steadily as current levels only mark the beginning of this increase. ARAs are expected to continue to rise over the next several months as servicers work out loans for borrowers that cannot meet debt service payments after forbearance periods come to an end.

Due to the compressed time frame of the current market disruption and there being limited signs of activity resuming back to pre-pandemic levels any time soon, Trepp has started to see more instances of CMBS borrowers expressing a willingness to “throw in the towel” or return the collateral to the lender earlier on. A review of special servicer notes for recent months show that more than $3.9 billion in outstanding balance across 100 loans have a deed-in-lieu pending that currently do not reflect a REO loan status. The list of loans tied to borrowers who are considering handing back the keys encompasses many large mall and hotel loans such as the $126.4 million loan behind the Westfield Citrus Park shopping center in Tampa Florida (MSBAM 2013-C10) and the $36.4 million loan behind the Sheraton Suites Houston in TX (GSMS 2014-GC2).

Conclusion

From a glass half full perspective, the CMBS industry has come a long way since the GFC and banks today are both more disciplined and better equipped to handle financial stressors through new regulatory mandates requiring greatly enhanced capital positions and the passing of annual stress tests to ensure bank robustness. The US Federal Reserve has also moved swiftly and proactively over the past few months to stabilize the US economy via means of injecting liquidity, keeping interest rates low, and other government-sponsored quantitative easing and bond buyback programs, a likely response to its experience dealing with the previous recession. For CMBS, the industry has undoubtedly proved its resiliency weathering through a number of stumbling blocks and hurdles just in the past decade, which are not limited to refinancing the Wall of Maturities and the introduction of new legislative measures. Over the years, there have also been several structural and sector-wide improvements that have been built in, which include better tranche-level credit enhancements, more investor protections, tighter underwriting, greater issuer “skin in the game” through risk retention, and ongoing efforts to boost transparency and reporting.

So, what new changes are in store for the CMBS and CRE sectors as a result of the current crisis? Though most pundits still believe it’s too early to tell, some experts have already pointed to potential revisions to existing reporting guidelines and greater flexibility on the part of the master and special servicers to carry out loan workout and forbearance arrangements. For the broader CRE segment, property owners will have to act nimble and come up with innovative strategies to stay relevant despite the ambiguity of how the pandemic will shape the use of physical real estate space in the years to come. While the road to recovery is expected to be a long one, the hope is that the economy will bounce back more quickly this time around with strong Central Bank support, financial systems in better footing, and markets more prepared to shoulder another economic crisis.

via ZeroHedge News https://ift.tt/35SEDsw Tyler Durden

Black-Owned Businesses Lead Rebound To Pre-Pandemic Levels

Black-Owned Businesses Lead Rebound To Pre-Pandemic Levels

Tyler Durden

Sat, 10/31/2020 – 13:15

Black-owned businesses, which were hit hardest during the peak COVID-19 lockdowns, have rebounded to their pre-pandemic numbers according to research based on data from the US Census Bureau.

Brandi and Jermail Shelton, owners of Just Add Honey Tea Company in Atlanta

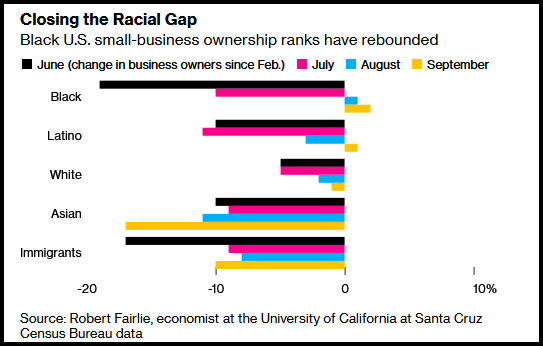
In April, the number of black-owned businesses cratered by 41% – only to decline to 19% by June, and finally increase to approximately 1.1 million nationwide – a 2% increase from February’s pre-pandemic figure, according to Bloomberg.

Of course, no feel-good statistics which might help Trump would be replete without a sprinkle of doubt, such as UC Santa Cruz economics professor Robert Fairlie, who collected the data – and “cautioned that the Census numbers fluctuate from month to month, so it’s possible Black owners didn’t see an absolute increase over the pre-pandemic period.” He adds that ‘the data don’t address whether the owners are actually making money or not.’

Beyond the caveats on the lumpy data, the reasons behind the surprising recovery are uncertain. The movement to support Black-owned businesses that sprung up during nationwide protests over police brutality may have been a contributing factor, according to Fairlie. Many African-American entrepreneurs noted a surge in business over the summer. –Bloomberg

“The rebound might be due to a concerted effort by customers to buy from Black-owned businesses,” said Fairlie, adding “I’m not sure if this explains everything, but it certainly helped.”

Bloomberg, still scratching their heads, notes that it’s unclear if the boost comes from businesses reopening or new firms being created at a faster pace than those which have closed permanently. One possible explanation is a recent spike in entrepreneurship in the US – with new business formation filings climbing 77% in the third quarter vs. the preceding quarter – an 82% jump from a year earlier.

Latino businesses also saw a September boost, up 1% from February pre-pandemic levels following a drop of as much as 32% in April, according to Fairlie.

The number of white business owners, meanwhile, were down 1% in September, while Asians and immigrants have also seen sharp declines of 13% and 17% respectively vs. February.

via ZeroHedge News https://ift.tt/3ec4sHE Tyler Durden

Glenn Greenwald: The Aftermath Of My Move Back To Independent Journalism

Glenn Greenwald: The Aftermath Of My Move Back To Independent Journalism

Tyler Durden

Sat, 10/31/2020 – 12:50

Authored by Glenn Greenwald via greenwald.substack.com

The last twenty-hours have been exhilarating. I had no idea what to expect when I decided to leave The Intercept and move my journalism here, but the outpouring of support — both words of encouragement from readers and those subscribing and supporting my work here — has been beyond what I can describe and it is incredibly gratifying and appreciated. Thank you to everyone who has subscribed and reached out.

This morning I discussed various aspects of my resignation from The Intercept on the outstanding YouTube program Rising with Krystal Ball and Saagar Enjeti. We discussed more in-depth my rationale for leaving, my response to various criticism and accusations from former colleagues and other assorted journalists, why I speak to both conservative and liberal media outlets, and what this episode reflects about broader media pathologies:

Last night, I was on with Tucker Carlson to discuss not only the reporting of mine that was censored, but also the severe acceleration of intelligence community propaganda and interference in our domestic politics and the increasingly restrictive media and political climate:

My appearances on Tucker Carlson’s programs typically provoke some controversy and even consternation among some of my long-term readers on the left. In addition to discussing my rationale for doing so in that above Rising interview, I also explained my reasoning on the Rolling Stone podcast “Useful Idiots” with Matt Taibbi and Katie Halper. Those interested can hear part of my answer in these two short clips:

Finally, for those who did not see it, I appeared earlier this week, for the first time, on Joe Rogan’s program. It was an extraordinary three-hour discussion that covered a very wide range of topics, from my experience in reporting on the Snowden story and our exposés last year in Brazil, the state of free speech generally in the U.S. and in journalism, regulation of our discourse by unaccountable Silicon Valley overlords, the 2020 election, the need for dialogue across partisan and ideological lines, and a great deal of personal introspection and examination. Having done the show, I understand much more why he has built up such a massive and loyal audience. It is very worth thinking about why that has happened and what it says about what is missing from our media ecosystem (we discussed that as well):

The last twenty-four hours have been intense, exciting, draining and so energizing — not just for me but for my family as well. The predictable attacks from journalists trapped in repressive institutions were easily endured as a result of the far more organic and principled support I received. I am very enthusiastic about what is possible on this platform and the journalism it will enable. And I want to thank all of you again with great sincerity and gratitude for making the launch of this platform so successful, and for making my resolve and determination to deliver honest, unique and impactful journalism and commentary higher than it has been in quite a long time.

Click here to subscribe to greenwald.substack.com

via ZeroHedge News https://ift.tt/3kL1EDV Tyler Durden

Priest Killed In Lyon As France Rocked By 3rd Terror Attack This Month

Priest Killed In Lyon As France Rocked By 3rd Terror Attack This Month

Tyler Durden

Sat, 10/31/2020 – 12:31

Another terror attack has apparently been carried out in France, the third in two weeks and fourth in 2 months, leaving a Greek Orthodox Priest dead.

The AFP reported that the priest was shot at a Greek Orthodox church in Lyon. He was shot with a sawed-off shotgun, according to reports, which means the attack was likely a gruesome scene.

The alleged perpetrator of the attack is on the run. France is already on its highest terror alert due to the two other terror attacks, which both involved knives, and one of which was also carried out in a church.

In a tweet sent minutes ago, the Ministry of the Interior warned citizens that an incident was underway in the 7th arrondissement in Lyon.

French President Emmanuel Macron reportedly infuriated Muslims around the world when he said he would defend the right to freedom of expression, including the right to show Charlie Hebdo cartoons of the Prophet Mohammad, a gesture that’s considered serious blasphemy by the Islamic faith. A decision to share the cartoons in class as part of a discussion on freedom of expression led to the decapitation of teacher Samuel Paty by an 18-year-old Chechen national.

A manhunt for the suspected terrorist is reportedly underway.

via ZeroHedge News https://ift.tt/3mJCCW7 Tyler Durden

10 “Big” Things For Stocks In The Coming Decade

10 “Big” Things For Stocks In The Coming Decade

Tyler Durden

Sat, 10/31/2020 – 12:25

In his latest weekly Flow Show, and the last such report before what may be the most important election in history, Bank of America CIO Michael Hartnett writes that according to the latest EPFR data, investors allocated $6.7Bn into bonds, and $0.1Bn into gold, while pulling $2.1Bn out of equities, and $1.5Bn out of cash.

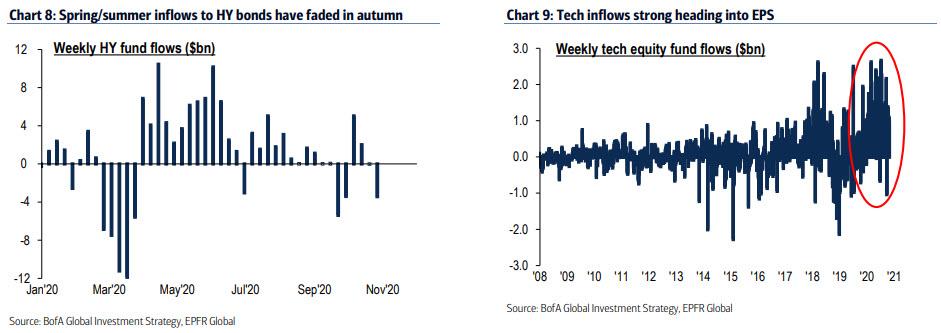
Of note, Hartnett points out that HY bond outflows accelerated to $3.4bn, while tech inflows were a strong $1.0Bn heading into EPS (oops)…

… while the inflows to Japan were largest since Apr’19, $3.5Bn, inflows into EM equities at $2.8BN were the largest in 7 weeks, $2.8bn), while European equities saw the largest outflow in 5 months ($3.4bn) as virus lockdowns returned.

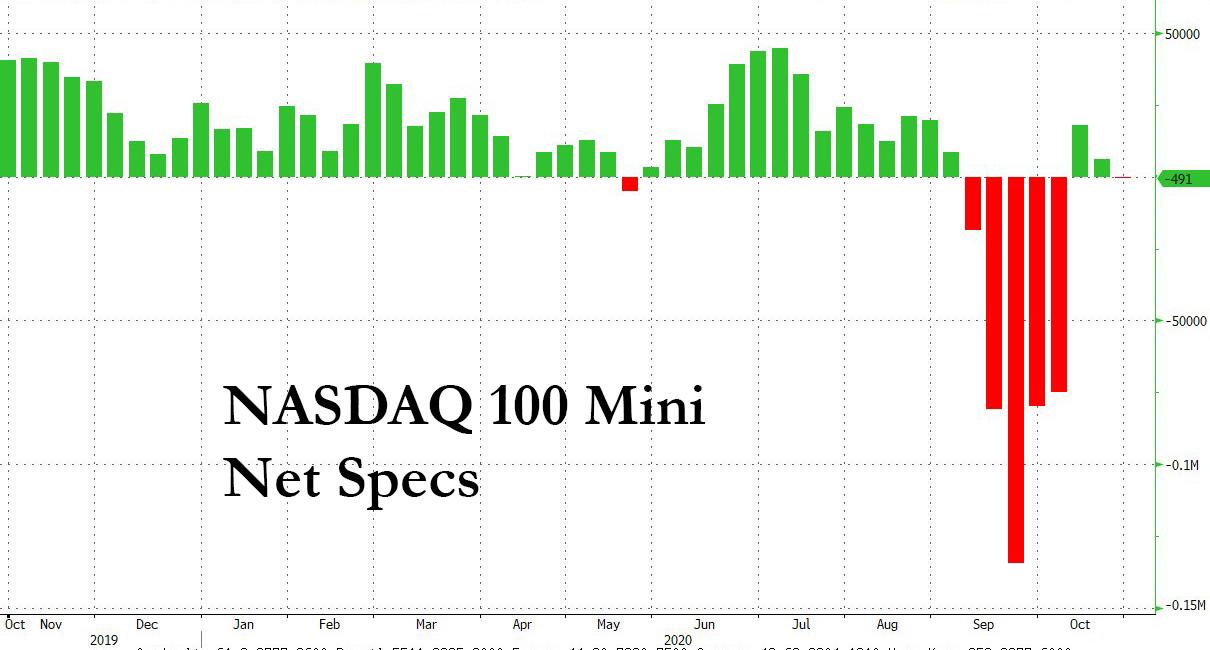
Yet while the weekly flows are informative, we can now definitively conclude that they are nothing more than noise, as the so-called “smart money” idiots merely chase momentum. How do we know this? Because 4 weeks after the Nasdaq 100 mini futures saw a near record number of shorts, those same “valiant” bears promptly covered their positions and even went long the NQ… just in the time for the biggest Nasdaq rout since March. In short: while flows may have had some signal value in the past, it’s now nothing more than noise.

With that said, we do want to point out something else in Harnett’s latest note, namely his list of ten “Big” things every investor should be aware of heading into the election, and hopefully crawling out of in the next few weeks, as they decide how to allocated capital. And so, without further ado, here are 10 big things to watch for:

  • Big top: IPOs (Ant $35bn largest ever, IPO ETF +163% since Mar), M&A (Oct’20 acquisition premium 142% vs 23% LTA), record $3.2tn funds raised in IG/HY/bank loans/equity/SPACs), US house prices up 15%, narrow equity leadership (top 5 SPX stocks = 24% of index), greedy IG & tech inflows, technical “double-top”, bearish narratives flipping to bullish (e.g. “blue wave”)…all classic “toppy” signs.
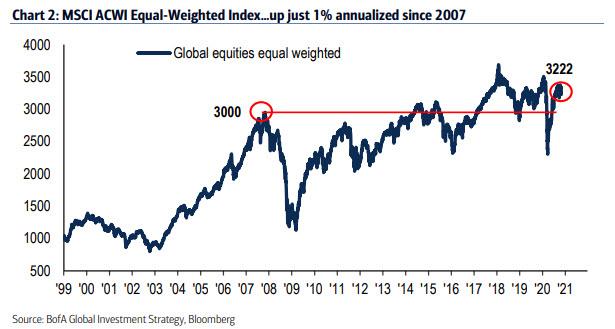
  • Big not: strongest case against “top” is Fed not tightening (as it was ‘80, ‘87, ‘94, ‘98, ‘00, ‘08, ‘18); and most stocks not in bull market…annualized gain in global stocks since 2007 is <1% (Chart 2); 1984 of 3042 in MSCI ACWI index in bear market, i.e. are >20% below their all-time highs.

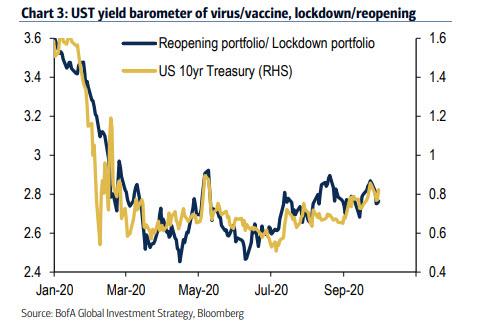
  • Big contrarian: most contrarian trade in 2020’s very clearly is “Fight the Fed” because past 13 years central banks have cut rates 972 times, bought $19tn of financial assets via QE, introduced NIRP, ZIRP, YCC, TLTROs, and they are still easing…both BoC & ECB “eased” this week; once again virus fear>vaccine hopes, lockdown assets>reopening assets, Treasury yields fail to break to new high (>1% – Chart 3); big contrarian rotation awaits vaccine/sustained recovery & fiscal panic/MMT.

  • Big tells: max bearish signals that it’s time to “Fight the Fed”…
    • 1. weak macro causes Treasury yields fall and credit spreads rise (deflation “tell”),
    • 2. MMT/digital currency causes Treasury yields rise and US dollar falls (inflation “tell”); investors will buy dips until Fed failure visible.
  • Big levels: Q4 tactical SPX trading range of 3300-3600 holding; SPX 3300 floor to hold so long as LQD >$130, HYG >$80, NDX >11000; in coming weeks monetary & fiscal easing + vaccine expectations mean Oct trading sell-off in credit & equity ends.
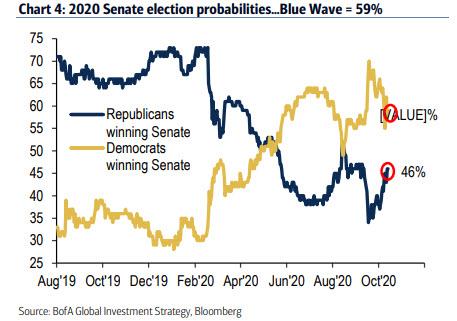
  • Big event: likelihood of Democrats winning the Senate now at 59% (was 29% in Jan, 64% in July, 49% end of August – Chart 4);  optimal medium-term election outcome for Wall St is “gridlock = goldilocks”; optimal outcome for big rotation = Blue Wave

  • Big inflation themes: election won’t change secular themes…“smaller world” (China war, reshoring), “bigger government” (monetary/fiscal/corporate/social/environment intervention), “dollar debasement” (debt/MMT/digital currencies)…all inflation trends.
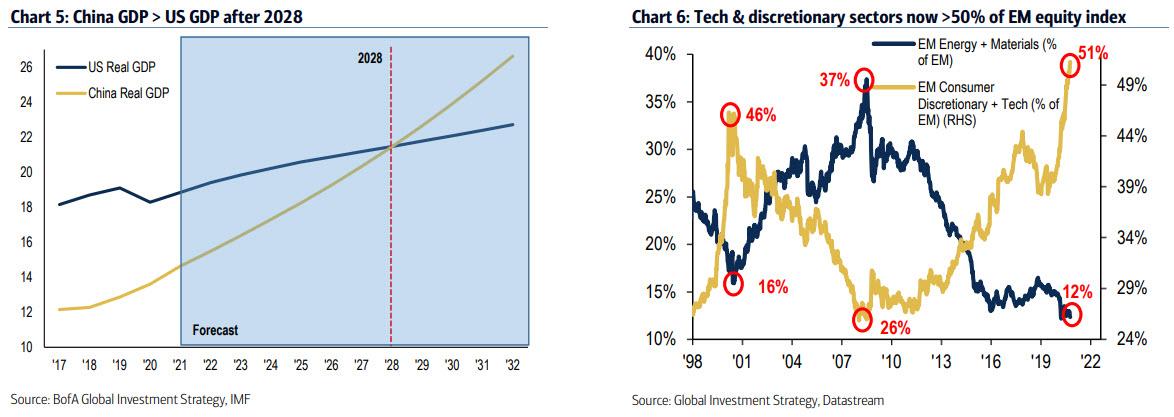
  • Big deflation theme: “China tech disruption” (Chart 6 – new 5-year plan for 5% growth driven by tech-led domestic urban consumption/production)…bullish deflationary trend (c/o “new paradigm” US late-90s); note
    • a. China FX strength;
    • b. China GDP set to surpass US in 2029 (Chart 5 – source IMF);
    • c. China’s old plan (weak FX, excess credit, social finance, infrastructure spend) set to become America/Europe’s new plan.

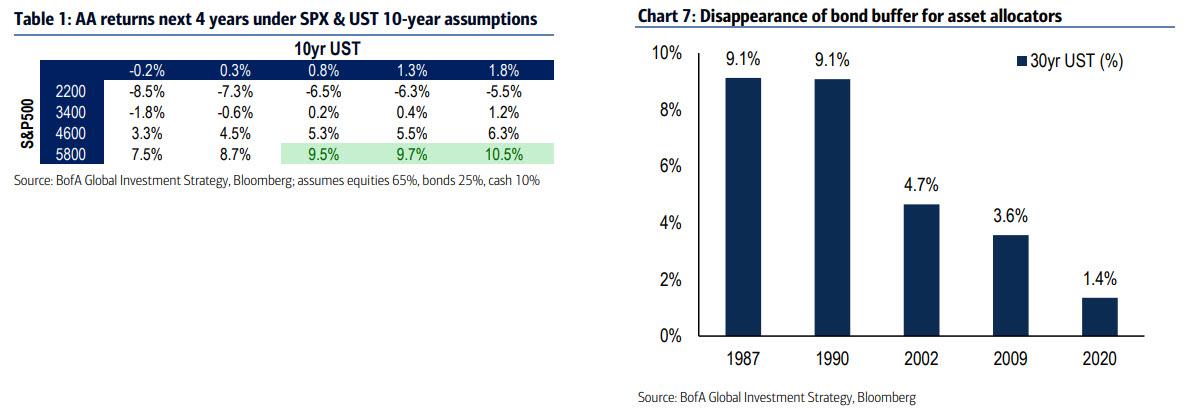
  • Big dilemma: AA of 65/25/10 stocks/Treasuries/cash returned 9.4% past 10 years; potential AA returns much lower next 4 years unless SPX @ 5800 and 10-year UST yield <0.8% (Table 1); we say 3-5% asset returns more likely; disappearance of bond buffer for asset allocators (30-year yield was 10% in ’80, 9% in ’90, 6% in ’00, 5%, in ‘10, now 1.5% - Chart 7) means higher volatility on Wall St in 2020s (watch risk parity RPAR ETF as lead indicator).

  • Big change: 2020s will be characterized by bigger government, MMT, 99% >1%…central bank digital currencies facilitate “helicopter drops” (instantaneous payments to distribute tax refunds, stimulus, UBI, student loan forgiveness) and make negative interest rates more efficient (adjusting reserves at CB accounts at negative rate dispenses with issue of bank intermediation).

via ZeroHedge News https://ift.tt/323gRZM Tyler Durden

The Fed Will Monetize All Of The Debt Issuance

The Fed Will Monetize All Of The Debt Issuance

Tyler Durden

Sat, 10/31/2020 – 12:00

Authored by Lance Roberts via RealInvestmentAdvice.com,

There has been a rising concern as of late about surging inflation as the Government injects more stimulus into the economy. While it seems logical, the reality will be quite different as weak economic growth rates force the Fed to monetize the entirety of future debt issuances.

The Inflation Premise

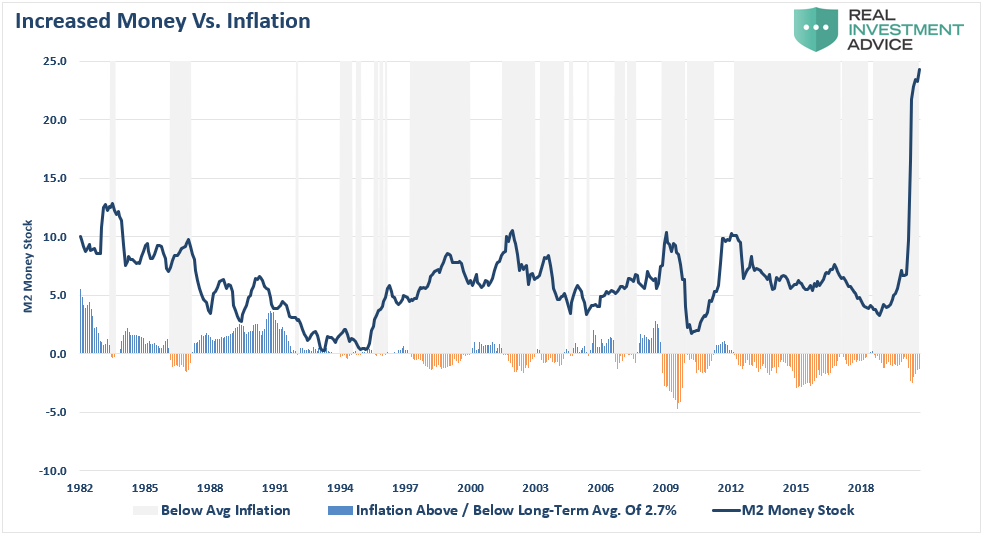
To fully explain why the Fed is now trapped, we must start with the inflation premise. The consensus expectation is the massive increases in monetary stimulus will spark inflationary pressures. Using the money supply as a proxy, we can compare the money supply changes to inflation.

What we find is since 1980, increases in the money supply tend to precede periods of below-average inflation. Such tends to contradict the mainstream belief that increases in the money supply will lead to hyper-inflation due to the currency’s devaluation.

Collapse Of Velocity

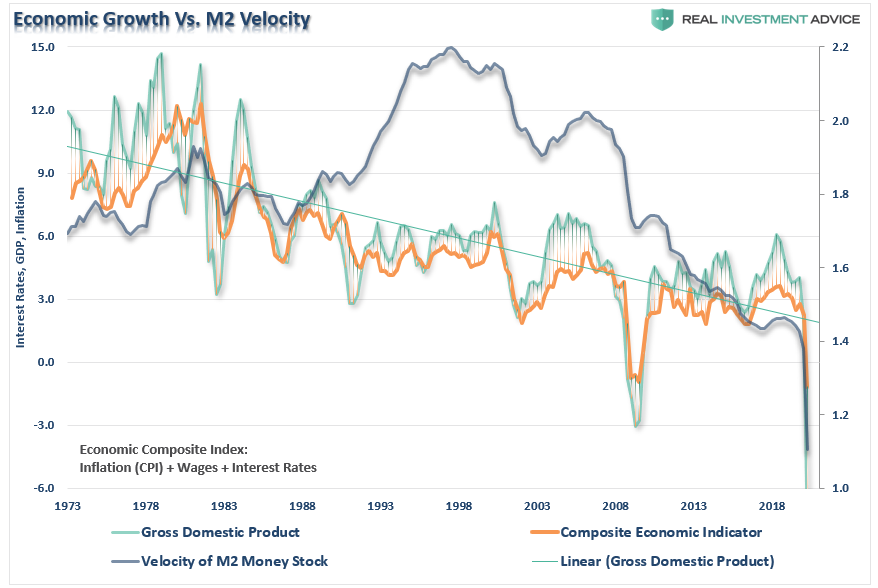
Such has not been the case since 1990 as the byproduct of the money supply, known as “monetary velocity,” has been non-existent. As discussed previously:

“The velocity of money is important for measuring the rate at which money in circulation is used for purchasing goods and services. Velocity is useful in gauging the health and vitality of the economy. High money velocity is usually associated with a healthy, expanding economy. Low money velocity is usually associated with recessions and contractions.

In each monetary policy intervention, the velocity of money has slowed along with the breadth and strength of economic activity.”

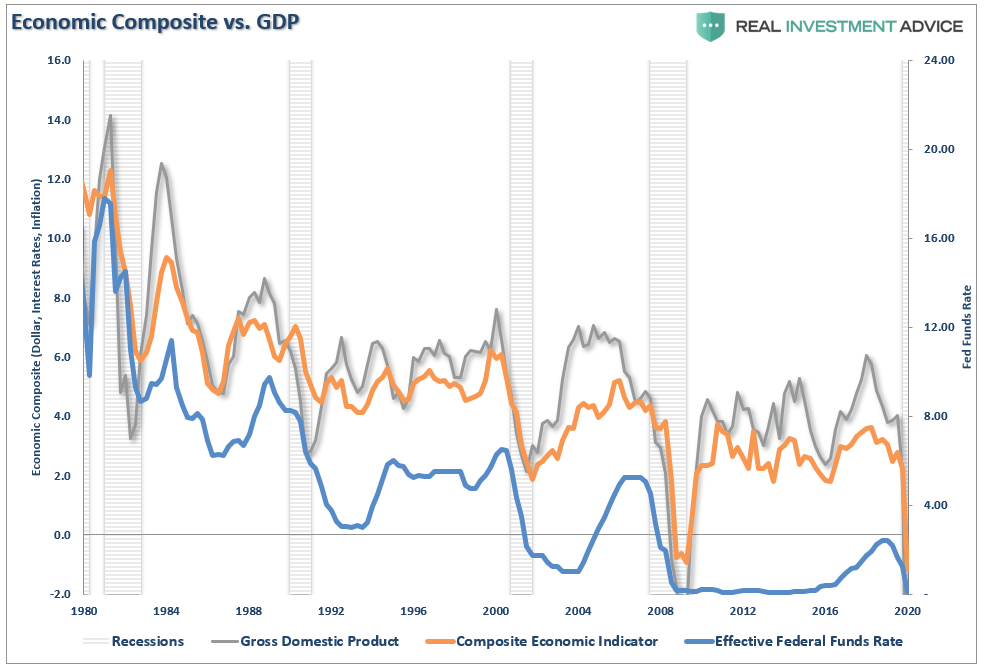
The chart below shows the problem. Despite increases in the money supply, the “velocity of money” has plunged along with economic growth. The “economic composite,” which tracks GDP, comprises the components derived from “economic growth,” namely wages, inflation, and interest rates.

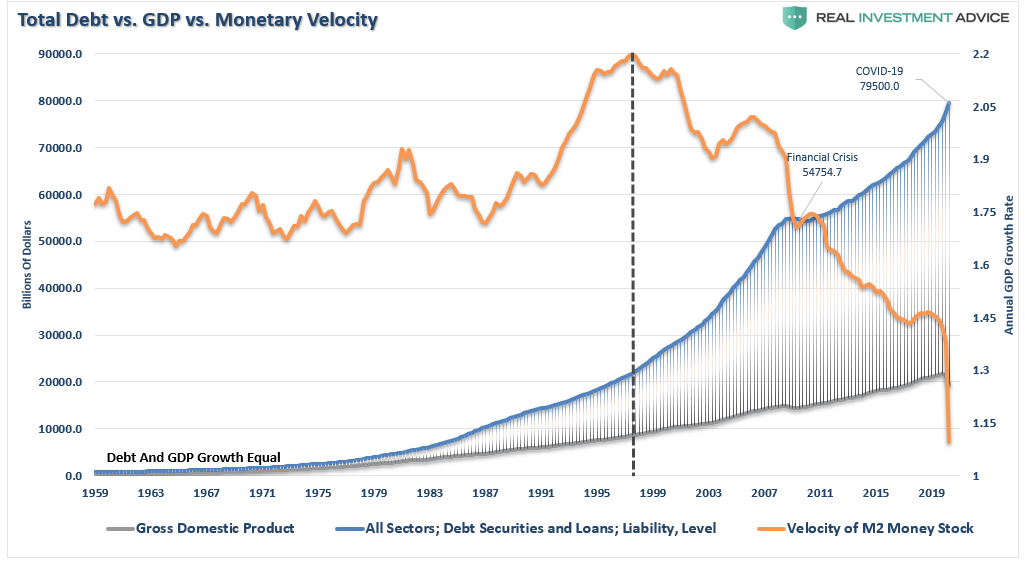
The question we must address is, “what happened in 1998” caused monetary velocity to collapse?

Fed Has Crossed The Rubicon

We often assume that “bad outcomes” happen overnight. Such is not the case.

Whether it is the outbreak of war, an economic recession, or a “bear market,” there is always a long-period of events leading up to the crisis. As is often stated, “a crisis happens slowly, then all at once.” 

Such is the “trap” the Federal Reserve finds themselves in today. In 1980, the Federal Reserve became active in monetary policy, believing they could control economic growth and inflationary pressures. Decades of their monetary experiment have succeeded only in reducing economic growth and inflation and increasing economic inequality.

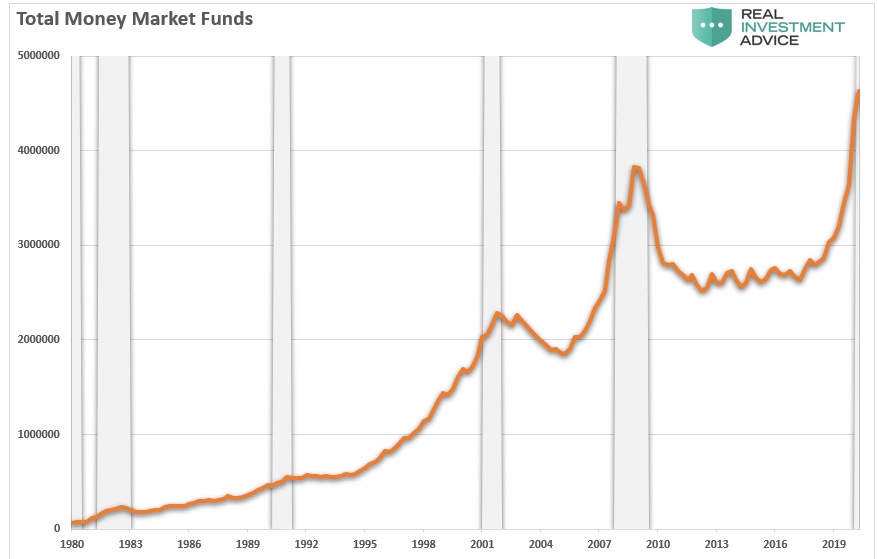
However, in 1998, the Federal Reserve “crossed the ‘Rubicon,’ whereby lowering interest rates failed to stimulate economic growth or inflation as the “debt burden” detracted from it. When compared to the total debt of the economy, monetary velocity shows the problem facing the Fed.

Look closely at the chart above. From 1950-1980 the economy grew at an annualized rate of 7.70%. The total credit market debt to GDP ratio was less than 150% to accomplish this growth rate. The CRITICAL factor to note is that economic growth was trending higher during this span, rising from roughly 5% to nearly 15%.

There were a couple of reasons for this. Lower levels of debt allowed for personal savings to remain robust, fueling productive investment in the economy. Secondly, the economy focused primarily on production and manufacturing, which has a high multiplier effect on the economy.  This growth feat also occurred in the face of steadily rising interest rates peaking with the economic expansion in 1980.

How did the Federal Reserve get themselves into this trap?

“Slowly, and then all at once.”

The Interest Rate Trap

One of the biggest problems over the last decade is why interest rates don’t rise. While all of the “bond gurus” have had an annual prognostication of “the death of the bond bull market,” it has yet to occur.

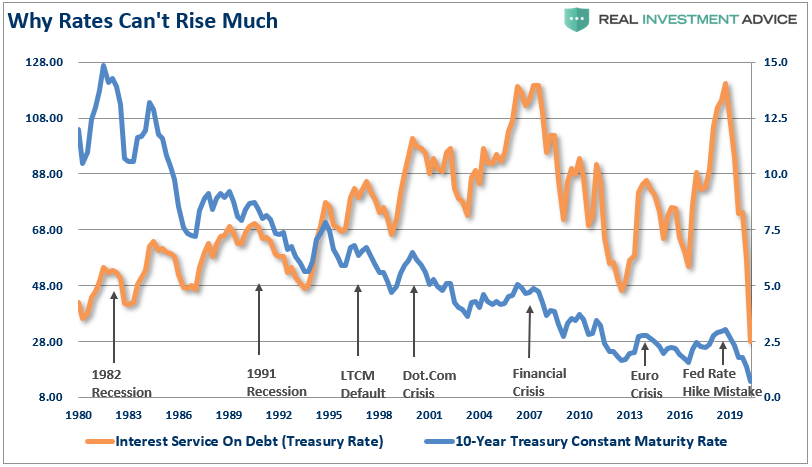
In an economy laden with $75 Trillion in total debt, higher interest rates have an immediate impact on consumption, which is 70% of economic growth. The chart below shows this to be the case, which is the interest service on total credit market debt. (The chart assumes all debt is equivalent to the 10-year Treasury, which is not the case.)

Importantly, note that each time rates have risen substantially from previous lows, there has been a crisis, recession, or a bear market. Currently, with rates at historic lows, consumers are rushing out to buy houses and cars. However, if rates rise to between 1.5 and 2%, economic growth will quickly stall.

The Federal Reserve is well aware of the problem and why they have been quick to reduce rates and increase bond purchases. Such is because higher rates spread through the economy like a virus.

The Rate Virus

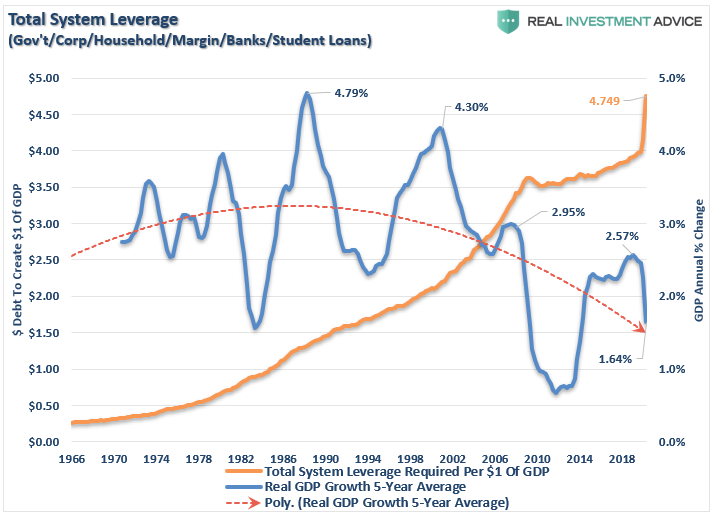
In an economy that requires $5 of debt to create $1 of economic growth, changes to interest rates have an immediate impact on consumption and growth.

1) An increase in rates curtails growth as rising borrowing costs slow consumption.

2) As of October 1, the Fed now has $7.02 trillion in liabilities and $39.2 billion in capital. A sharp rise in rates will dramatically impair their balance sheet.

3) Rising interest rates will immediately slow the housing market. People buy payments, not houses, and rising rates mean higher payments.

4) An increase in rates means higher borrowing costs and lower profit margins for corporations. 

5) Stock valuations have been elevated due to low rates. Higher rates exacerbate the valuation problem for equities.

6) The negative impact on the massive derivatives market could lead to another credit crisis as rate-spread derivatives go bust.

7) As rates increase, so do the variable rate interest payments on credit cards. With the consumer already impacted by stagnant wages, under-employment, and high living costs, a rise in debt payments would further curtail disposable incomes. 

8) Rising defaults on debt service will negatively impact banks that are still not adequately capitalized and still burdened by massive bad debt levels.

9) The deficit/GDP ratio will surge as borrowing costs rise sharply. 

I could go on, but you get the idea.

The Liquidity Trap

While the Federal Reserve keeps wanting higher inflation rates, which should correspond with economic growth, its policy actions continue to work to the contrary.

In theory, their actions should lead to higher inflation as low rates spur consumption and investment. However, a signature characteristic of a “liquidity trap” is:

“When injections of cash into the private banking system by a central bank fail to lower interest rates or stimulate economic growth. A liquidity trap occurs when people hoard cash because they expect an adverse event such as deflation, insufficient aggregate demand, or war.

Signature characteristics of a liquidity trap are short-term interest rates remain near zero. Furthermore, fluctuations in the monetary base fail to translate into fluctuations in general price levels.

Pay particular attention to the last sentence.

As discussed through the entirety of this article, every “check box” of a liquidity-trap has gotten filled:

  • Lower interest rates fail to stimulate economic growth.

  • Short-term interest rates near zero.

  • Fluctuations in monetary base fail to translate into general price levels.

  • People hoard cash because they expect an adverse event (economic crisis).

Long-Term Evidence

Given that higher rates of inflation would also correspond with higher interest rates, such will negatively impact virtually every aspect of the economy. As rates rise, so do rates on credit card payments, auto loans, business loans, capital expenditures, leases, etc., while reducing corporate profitability.

In an economy supported by debt, rates must remain low. Therefore, the Federal Reserve has no choice but to monetize as much debt issuance as is needed to keep rates from substantially rising.

Unfortunately, higher levels of debt continue to retard economic growth keeping the Fed trapped in a debt cycle as hopes of “growth” remain elusive. The current 5-year average inflation-adjusted growth rate is just 1.64%, a far cry from the 4.79% real growth rate in the ’80s.

Deflation Still Present

The debt problem exposes the Fed’s risk and why they have no choice but to monetize the Government’s debt issuance to keep interest rates suppressed. More importantly, the decline in monetary velocity clearly shows that deflation is a persistent threat, and one the Fed is most afraid of.

Treasury&Risk clearly explained the reasoning:

“It is hard to overstate the degree to which psychology drives an economy’s shift to deflation. When the prevailing economic mood in a nation changes from optimism to pessimism, participants change. Creditors, debtors, investors, producers, and consumers all change their primary orientation from expansion to conservation.

  • Creditors become more conservative, and slow their lending.

  • Potential debtors become more conservative, and borrow less or not at all.

  • Investors become more conservative, they commit less money to debt investments.

  • Producers become more conservative and reduce expansion plans.

  • Consumers become more conservative, and save more and spend less.

These behaviors reduce the velocity of money, which puts downward pressure on prices. Money velocity has already been slowing for years, a classic warning sign that deflation is impending. Now, thanks to the virus-related lockdowns, money velocity has begun to collapse. As widespread pessimism takes hold, expect it to fall even further.”

No Real Options

The Federal Reserve has no real options unless they are willing to allow the system to reset painfully.

Unfortunately, given we now have a decade of experience of watching monetary experiments only succeed in creating a massive “wealth gap,” maybe we should consider the alternative.

Ultimately, the Federal Reserve, and the Administration, will have to face hard choices to extricate the economy from the current “liquidity trap.”  However, history shows that political leadership never makes hard choices until those choices get forced upon them.

While we continue to “hope” we can “grow” our way out of our debt problem, “hope” has never been a functional strategy for fixing problems.

via ZeroHedge News https://ift.tt/321G6LY Tyler Durden

Catholic Poland Rocked By Largest Protests In Decades As Abortion Advocates Rage

Catholic Poland Rocked By Largest Protests In Decades As Abortion Advocates Rage

Tyler Durden

Sat, 10/31/2020 – 11:35

Huge pro-abortion protests have gridlocked the center of Warsaw, Poland for a week. The demonstrations are being widely described as the largest to hit the conservative Catholic country in decades, triggered by a new court decision that effectively bans all abortions throughout the country. 

Especially starting Wednesday into Friday the protests appeared massive, with some international reports saying some 400,000 people flooded the streets on single days.

Poland’s Constitutional Court last week ruled that an existing law allowing for abortions in cases of birth defects was unconstitutional. Conservative critics pointed to it being a form of eugenics, while feminist and other activist groups considered it an attack on women’s rights.

The government hailed the court decision as finally banning “eugenic abortions”; however, in the wake of the firestorm of protests President Andrzej Duda said he would consider legislation that allows for it in cases of “lethal defects”. 

Drone footage from Friday protests, which went into the evening, showed masses taking over entire highways and multiple city blocks.

The protesters’ wrath is being directed at the Catholic and nationalist Law and Justice (PiS) party, who pushed the decision to the court.

There were clashes with police in front of Poland’s parliament over the past days, but the demonstrations are being widely described as mostly peaceful, also with a heavy police presence and some groups of counter-demonstrators. 

The only possible instances of a legal abortion in Poland are now cases of rape, incest, or where the mother’s life is in danger due to pregnancy or delivery complications.

Via Reuters

Reports cite that there are less than 2,000 legal abortions in Poland each year; however, it’s estimated that tens of thousands of women abort illegally or go abroad, especially to other parts of Europe.

via ZeroHedge News https://ift.tt/3mDcjB5 Tyler Durden