2020 In 12 Stunning Charts
With just one day left in what has been a dismal year, we decided to look back at the past 12 months and summarize the most notable market events and developments in 12 charts. So without further ado, and courtesy of BoA’s Michael Hartnett, here is…
2020 in 12 charts.
- 2020 was a year dominated by a virus identified in 2019, which as BofA notes, “spread into a pandemic shattering all 2020 social,political, economic and financial market predictions.”
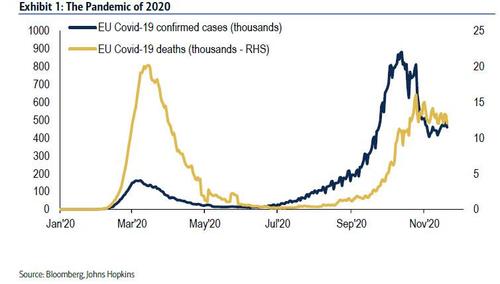
- According to Hartnett, “75mn people have contracted COVID-19,and 1.7mn people have died from COVID-19 in 2020; US & Europe (Exhibit 1) harderhit than Asia.”
- The 1st wave of the virus Mar-May precipitated a financial market crash,lockdowns & recessions; the less deadly autumn 2nd wave did not.
- In response to the pandemic, there were multiple COVID-19 vaccines in development by the end of 2020, with several approved out with unprecedented speed/
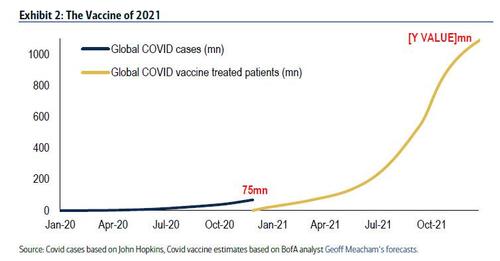
- 2021 will be a year of the vaccine not thevirus…BofA forecasts 1.1bn people will be vaccinated by year-end ’21, a figure that dwarfs the 75mn that contracted the virus in 2020 (Exhibit 2).
- The WHO designated COVID-19 a global pandemic on March 10th 2020.
- Global credit & equity prices had fallen sharply in Feb and early-March in anticipation…credit & equity prices then went into freefall.
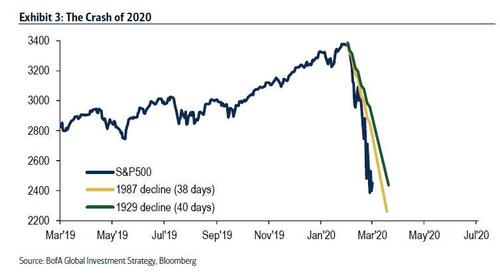
- In less than one month $30tn had been wiped off the value of global stock markets (Exhibit 3), one of the greatest crashes of all time in both speed and magnitude
- In Q2 global GDP collapsed $10tn, Chinese business confidence slumped to an all-time low, oil prices turned negative, as human “mobility” ceased (US TSA air passengers -96% YoY in April).
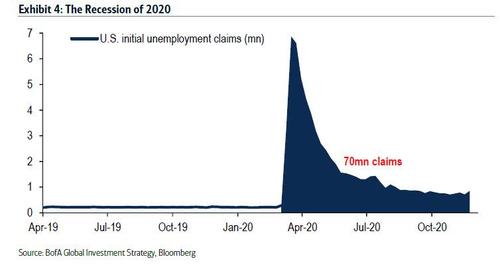
- US unemployment rate soared to 15% as 70mn people filed for unemployment benefits in 2020 (Exhibit 4); US household savings rate jumped to an all-time high of 34%.
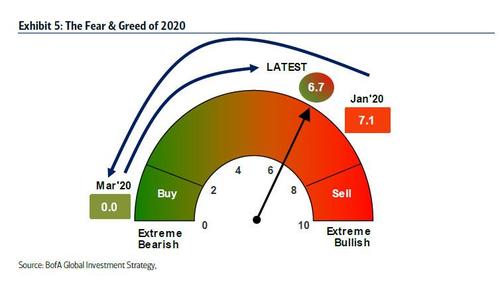
- Investors began the year in a very bullish frame of mind; mood flipped to maximum bearish by mid-March and remained there until mid-June according to the BofA Bull & Bear Indicator (Exhibit 5).
- Investor sentiment has since recovered, particularly after vaccine announcements in early-Nov; the BofA Bull & Bear Indicator has accelerated to 6.7, and is approaching the Sell zone.
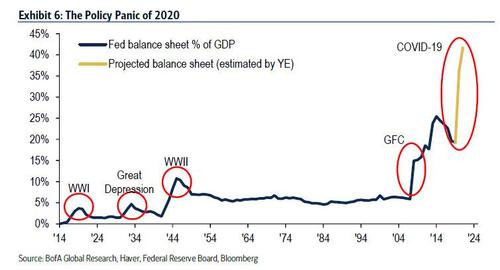
- The virus, crash, lockdown & recession provoked an unprecedented monetary & fiscal policy panic (Exhibit 6); $22tn of stimulus has been announced in the past 9 months around the world.
- Central banks spent over $1tn a month on financial assets via QE, crushing yields, volatility, and spreads, successfully inciting asset price inflation on Wall St to short-circuit recession on Main St.
- And presaging a secular shift from monetary QE to fiscal MMT, $14tn of fiscal stimulus was announced; the quantity of global debt now stands at a record $277tn, the price of debt also at a record 5,000 year low (global negative yielding debt =$18tn).
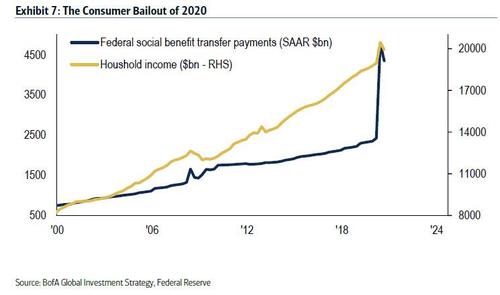
- The US government transferred $2 trillion directly to the household sector in 2020 (Exhibit 7), and consumer spending was nothing short of heroic in face of virus and unemployment; but Wall St & Main St addiction to government bailouts now habitual.
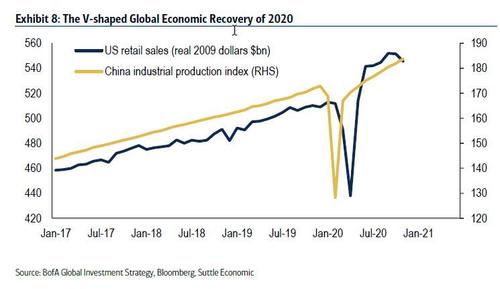
- The policy panic led to an epic rally on Wall St and a dramatic V-shaped economic recovery in H2’2020.
- The recovery was led by China where industrial production (Exhibit 8) and exports quickly recovered to pre-COVID-19levels, but more remarkable to many, was the rebound in US consumer spending (retail sales are currently $32bn higher than in Jan’20).
- Global equity market cap has soared by $40tn to over $100tn since the Mar’20lows.
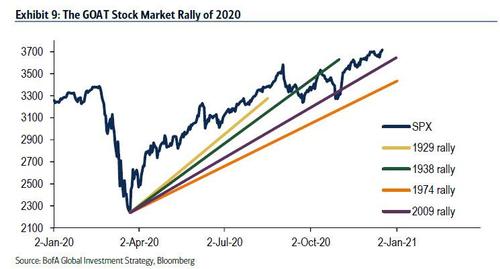
- The rally off the Mar’20 lows (Exhibit 9) has surpassed all of the 4 greatest rallies off the lows of the past century (1929,1938, 1974, and 2009).
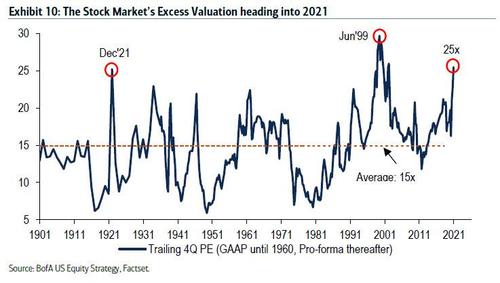
- Wall St optimism heading into 2021 means the S&P500 trades on a trailing PE of > 25X (Exhibit 10), a level only exceeded in 1921 and 1999.
- The capitulation of consensus to “don’t fight the Fed”, front-running MMT, secular tech-led productivity…many catalysts exist for more years of big equity gains…but an old-fashioned bubble remains most plausible catalyst.
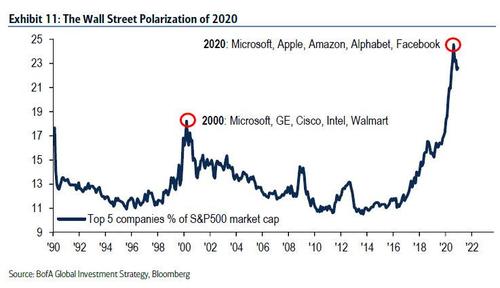
- Wall St in 2020 was also marked by significant polarization of returns: in recent months, the top 5 companies in the S&P500 represented a breathtaking 25% of the index (Exhibit 11).
- The rally broadened by style, sector, size & region as 2020, and the year ended with the majority of equity & credit investors adopting a fashionable “barbell” approach to investing.
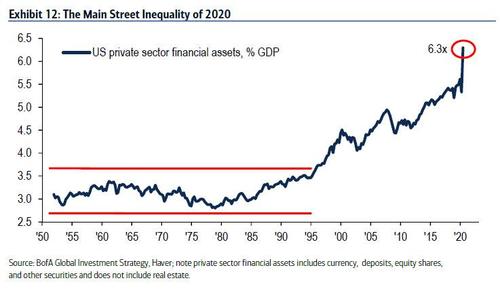
- The bottom line: the Fed, which set off to “fight” inequality has failed tremendously because as even BofA admits, “the pandemic worsened inequality in 2020” – value of financial assets (Wall St) relative to economy (Main St) hit all-time high of 6.3x (Exhibit 12).
- This won’t improve without a revolution, as the coming years will be marked by bigger government, dollar debasement, policy flip from monetary & QE to fiscal & MMT, all in an attempt to increase price of labor relative to capital yet which will achieve just the opposite; 2020 was year of COVID-19 pandemic; it will, according to Hartnett, “also be remembered as the secular low point for both inflation & interest rates.”
Tyler Durden
Wed, 12/30/2020 – 15:22
via ZeroHedge News https://ift.tt/3huPUEz Tyler Durden
